20080-090 Rio de Janeiro, RJ, Brazil
The Alpha Centauri binary system ††thanks: Based on observations collected at Observatório do Pico dos Dias (OPD), operated by the Laboratório Nacional de Astrofísica, CNPq, Brazil.
Abstract
Context. The Centauri binary system, owing to its duplicity, proximity and brightness, and its components’ likeness to the Sun, is a fundamental calibrating object for the theory of stellar structure and evolution and the determination of stellar atmospheric parameters. This role, however, is hindered by a considerable disagreement in the published analyses of its atmospheric parameters and abundances.
Aims. We report a new spectroscopic analysis of both components of the Centauri binary system, compare published analyses of the system, and attempt to quantify the discrepancies still extant in the determinations of the atmospheric parameters and abundances of these stars.
Methods. The analysis is differential with respect to the Sun, based on spectra with R = 35 000 and signal-to-noise ratio 1 000, and employed spectroscopic and photometric methods to obtain as many independent determinations as possible. The atmospheric parameters are also checked for consistency against the results of the dynamical analysis and the positions of the components in a theoretical HR diagram.
Results. The spectroscopic atmospheric parameters of the system are found to be = (5847 27) K, Fe/H = 0.24 0.03, = 4.34 0.12 and = 1.46 0.03 km s-1, for Cen A, and = (5316 28) K, Fe/H = 0.25 0.04, = 4.44 0.15 and = 1.28 0.15 km s-1 for Cen B. The parameters were derived from the simultaneous excitation & ionization equilibria of Fe i and Fe ii lines. s were also obtained by fitting theoretical profiles to the H line and from photometric calibrations.
Conclusions. Good agreement was reached between the three criteria for Cen A. For Cen B the spectroscopic is 140 K higher than the other two determinations. We discuss possible origins of this inconsistency, concluding that the presence of NLTE effects is a probable candidate, but we note that there is as yet no consensus on the existence and cause of an offset between the spectroscopic and photometric scales of cool dwarfs. The spectroscopic surface gravities also agree with those derived from directly measured masses and radii. An average of three independent criteria leads to (A) = (5824 26) K and (B) = (5223 62) K. The abundances of Na, Mg, Si, Mn, Co and Ni and, possibly, Cu are significantly enriched in the system, which also seems to be deficient in Y and Ba. This abundance pattern can be deemed normal in the context of recent data on metal-rich stars. The position of Cen A in an up-to-date theoretical evolutionary diagrams yields a good match of the evolutionary mass and age (in the 4.5 to 5.3 Gyr range) of with those from the dynamical solution and seismology, but only marginal agreement for Cen B, taking into account its more uncertain .
Key Words.:
individual: Centauri – stars: late-type – stars: abundances – stars: fundamental parameters – techniques: spectroscopic1 Introduction
The Centauri binary system, composed of two solar-type stars (HD 128620 and 128621), is one of the brightest in the sky and figures as our second closest galactic neighbor, 1.34 parsec away. The star closest to the Sun is the M5.5 dwarf Proxima Centauri (Gliese & Jahreiss 1991), 15,000 A.U. away from the Centauri binary, and its gravitational connection to the system is still a topic of controversy. Anosova et al. (1994) proposed that Proxima has a hyperbolic orbit around the inner pair, and that the three stars might form part of a more extended kinematical group. Wertheimer & Laughlin (2006), however, found the distance between Proxima and the pair as comparable to the Hill radius of the latter, whereby the Galactic potential becomes dominant over that of the inner pair and the system becomes unbound. These authors favor the existence of a physically bound triple system, suggesting that Proxima is presently at the apoastron of its orbit. Highly precise monitoring of radial velocity variations of the system by Endl et al. (2001) constrains the upper limit of the mass of putative planetary or substellar companions of the system as less than 3.5 Jupiter masses (actually less than one Saturn mass if coplanar orbits are assumed).
The proximity of the Centauri system provides a well determined parallax, and its brightness allows the acquisition of extremely high-quality spectra. Moreover, its binary nature and relatively short period of 80 years enables the hypothesis-free accurate determination of masses (Pourbaix et al. 1999, 2002). If we couple to these facts their being very solar-like, the Centauri stars thus appear as objects of fundamental importance in the calibration of evolutionary tracks, theoretical isochrones and model atmospheres, hence the great interest in the precise determination of their atmospheric parameters, evolutionary state and chemical composition.
| Centauri A | |||||||
|---|---|---|---|---|---|---|---|
| Reference | Atmospheric Parameter | Method Used | |||||
| (K) | (km s-1) | ||||||
| French & Powell (1971) | 5770 | - | - | 0.22 | - | ||
| Soderblom (1986) | 5770 | - | - | - | - | ||
| England (1980) | 5750 | 4.38 | 1.0 | 0.28 | |||
| Bessell (1981) | 5820 | 4.25 | 1.7 | 0.01 | |||
| Smith et al. (1986) | 5820 | 4.40 | 1.54 | 0.20 | |||
| Gratton & Sneden (1987) | 5750 | 4.38 | 1.2 | 0.11 | |||
| Abia et al. (1988) | 5770 | 4.5 | 1.0 | 0.22 | |||
| Edvardsson (1988) | - | 4.42 | - | 0.28 | - | ||
| Furenlid & Meylan (1990) | 5710 | 4.27 | 1.0 | 0.12 | |||
| Chmielewski et al. (1992) | 5800 | 4.31 | - | 0.22 | |||
| Neuforge-Verheecke & Magain (1997) | 5830 | 4.34 | 1.09 | 0.25 | |||
| Allende-Prieto et al. (2004) | 5519 | 4.26 | 1.04 | 0.12 | |||
| Doyle et al. (2005) | 5784 | 4.28 | 1.08 | 0.12 | |||
| Santos et al. (2005) | 5844 | 4.30 | 1.18 | 0.28 | |||
| del Peloso et al. (2005a) | 5813 | 4.30 | 1.23 | 0.26 | |||
| Valenti & Fischer (2005) | 5802 | 4.33 | - | 0.23 | |||
| This work | 5824 | 4.34 | 1.46 | 0.24 | |||
| Centauri B | |||||||
| Reference | Atmospheric Parameter | Method Used | |||||
| (K) | (km s-1) | ||||||
| French & Powell (1971) | 5340 | - | - | 0.12 | - | ||
| Soderblom (1986) | 5350 | - | - | - | - | ||
| England (1980) | 5260 | 4.73 | 1.1 | 0.38 | |||
| Bessell (1981) | 5350 | 4.5 | 1.0 | 0.05 | |||
| Smith et al. (1986) | 5280 | 4.65 | 1.35 | 0.20 | |||
| Gratton & Sneden (1987) | 5250 | 4.50 | 1.0 | 0.08 | |||
| Abia et al. (1988) | 5300 | 4.5 | 1.5 | 0.14 | |||
| Edvardsson (1988) | - | 4.65 | - | 0.32 | - | ||
| Chmielewski et al. (1992) | 5325 | 4.58 | - | 0.26 | |||
| Neuforge-Verheecke & Magain (1997) | 5255 | 4.51 | 1.00 | 0.24 | |||
| Allende-Prieto et al. (2004) | 4970 | 4.59 | 0.81 | 0.18 | |||
| Santos et al. (2005) | 5199 | 4.37 | 1.05 | 0.19 | |||
| Valenti & Fischer (2005) | 5178 | 4.56 | - | 0.22 | |||
| This work | 5223 | 4.44 | 1.28 | 0.25 | |||
The brightness of the system’s components also favor the determination of internal structure and state of evolution by seismological observations. The analysis of the frequency spectrum and amplitudes of both photometric and spectroscopic oscillations in the outer layers of solar-type stars, driven by convection, can yield otherwise unobtainable information on internal structure, such as the depth of the convection zone and the density and temperature profiles. They can also provide independent checks on stellar masses, ages and chemical composition. Yıldız (2007), Eggenberger et al. (2004) and Thoul et al. (2003) have agreed on an age for the system between 5.6 and 6.5 Gyr. Miglio & Montalbán (2005) propose model-dependent ages in the 5.2 to 7.1 Gyr interval. However, they also note that fixing the non-seismic observables, namely masses and radii, leads to an age as large as 8.9 Gyr, proposing that further seismological observations may be needed to clarify this apparent discrepancy between the independent observation of the oscillation spectra and the directly measured masses and radii. The previous analysis of Guenther & Demarque (2000) favors a slightly higher age of 7.6 Gyr. The masses are very well constrained at MA = 1.105 0.007 and MB = 0.934 0.006 in solar masses (Pourbaix et al. 2002), which, along with interferometrically measured (in solar units) radii of RA = 1.224 0.003 and RB = 0.863 0.005 (Kervella et al. 2003) yield surface gravities (in c.g.s. units) of log gA = 4.307 0.005 and log gB = 4.538 0.008, an accuracy seldom enjoyed by stellar spectroscopists. Altogether, these data pose very tight constrains on the modelling of fundamental quantities of internal structure, such as mixing-length parameters and convection zone depths.
Nevertheless, the state of our current understanding of this system still lags behind its importance, since published spectroscopic analyses reveal considerable disagreement (Table 1) in the determination of atmospheric parameters and chemical abundances, particularly for component B, though most authors agree that the system is significantly metal-rich with respect to the Sun. This fact is embarrassing, even in our modern era of massive surveys, since the individual study of key objects is necessary to quantify systematic errors which might be lurking inside huge databases, and cannot be reduced with large number statistics. Indeed, considering only those analyses since the 90s, eight performed a detailed analysis of the atmospheric parameters and chemical composition of Cen A (Furenlid & Meylan (1990), hereafter FM90; Chmielewski et al. (1992), Neuforge-Verheecke & Magain (1997), Allende-Prieto et al (2004), hereafter ABLC04; del Peloso et al. (2005a), Santos et al. (2005); Valenti & Fisher (2005); Doyle et al. (2005)), whilst five of them also performed this analysis for the cooler and fainter component Cen B (Chmielewski et al. 1992, Neuforge-Verheecke & Magain (1997), ABLC04; Valenti & Fisher (2005) and Santos et al. 2005). All these authors, but Chmielewski et al. (1992) and Santos et al. (2005), obtained abundances for many chemical elements other than iron.
The analysis of FM90 for Cen A is noteworthy in that it was the first to imply an abundance pattern considerably different from solar, with excesses relative to Fe in Na, V, Mn, Co, Cu, and deficits in Zn and the heavy neutron capture elements, and also proposed a low and a near solar metallicity for component A, in contrast with most previously published figures. These authors invoked a supernova to explain the peculiar chemical features of the system. The next analysis (Chmielewski et al. 1992) sustained a high and appreciably higher metallicity for the system, which was also obtained by Neuforge-Verheecke & Magain (1997). The latter authors, moreover, found an abundance pattern not diverging significantly from that of the Sun, though supporting the deficiency of heavy elements found by FM90.
del Peloso et al. (2005a) and Santos et al. (2005) have both derived a high metallicity for the system. Doyle et al. (2005) added to the controversy by proposing both a low and a metallicity not appreciably above solar for component A, as did FM90. Their abundance pattern is, however, solar. ABLC04 propose for both components much lower s than previously found by any author. Even though their metallicity agrees reasonably with that of Chmielewski et al. (1992) and Neuforge-Verheecke & Magain (1997), their detailed abundance pattern is highly non-solar and also very different from any thus far, with high excesses of Mg, Si, Ca, Sc, Ti, Zn and Y. Their low metallicity is a result of a lower adopted , as also is the case for the FM90 analysis.
Doyle et al. (2005) presented the most recent abundance analysis of Cen A and obtained abundances for six elements. They made use of the Anstee, Barklem and O’Mara (ABO) line damping theory (Barklem et al. 1998 and references therein), which allowed them to fit accurate damping constants to the profile of strong lines, turning these into reliable abundances indicators, an approach normally avoided in abundance analyses. They found [Fe/H]= for the iron abundance, which is in disagreement with most authors using the standard method, although agreeing with FM90. To bring home the point of the existing large disagreement between the various published results, one needs look no further than at the last entries of Table 1, all based on very high-quality data and state of the art methods. These disagreements in chemical composition lie beyond the confidence levels usually quoted by the authors. Moreover, the dispersion of the values found range between 300K and 400K, respectively, for component A and B.
Pourbaix et al. (1999) finish their paper thus: “we urge southern spectroscopists to put a high priority on Centauri”. Clearly, this very important stellar system is entitled to additional attention, fulfilling its utility as a reliable calibrator for theories of stellar structure and evolution, and taking full advantage of its tight observational constraints towards our understanding of our second closest neighbor and the atmospheres of cool stars. The widely differing results of the chemical analysis also cast doubt about the place of Centauri in the galactic chemical evolution scenario. The goal of the present study is a simultaneous analysis of the two components of the system, obtaining their atmospheric parameters and detailed abundance pattern, providing an up-to-date comparative analysis of the different determinations, the methods used and their results.
This paper is organized as follows. In section 2 we describe the data acquisition and reduction. In section 3 we describe the spectroscopic derivation of the atmospheric parameters and Fe abundance, and compare them to other recent results from other techniques, discussing possible sources of discrepancies. The chemical composition pattern and its comparison to those of other authors, is outlined in section 4. Section 5 is devoted to the analysis of the evolutionary state of the system, and section 6 summarizes the conclusions.
2 Observations and line measurement
Observations were performed in 2001 with the coudé spectrograph, coupled to the 1.60m telescope of Observatório do Pico dos Dias (OPD, Brasópolis, Brazil), operated by Laboratório Nacional de Astrofısica (LNA/CNPq). As both Cen A and B are solar-type stars, the Sun is the natural choice as the standard star of a differential analysis. The expectation of this approach is that systematic errors in the measurement of line strengths, the representation of model atmospheres, and the possible presence of Non-Local Thermodynamic Equilibrium (NLTE) effects, will be eliminated or at least greatly lessened, if the standard and the analysed object are sufficiently similar. We chose the moon as a sunlight surrogate to secure a solar flux spectrum. The slit width was adjusted to give a two-pixel resolving power R = 35 000. A 1 800 l/mm diffraction grating was employed in the first direct order, projecting onto a 24m, 1024 pixels CCD. The exposure times were chosen to allow for a S/N ratio in excess of 1 000. A decker was used to block one star of the binary system while exposing the other, and we ascertained that there was no significant contamination. The moon image, also exposed to very high S/N, was stopped orthogonally to the slit width to a size comparable to the seeing disks of the stars.
Nine spectral regions were observed, centered at 5100, 5245, 5342, 5411, 5528, 5691, 5825, 6128 and 6242 Å, with spectral coverage of 90 Å each. The chemical species represented by spectral lines reasonably free from blending are Na i, Si i, Ca i, Sc i, Sc ii, Ti i, Ti ii,V i, Cr i, Cr ii, Mn i, Fe i, Fe ii, Co i, Ni i, Cu i, Y ii, Ba ii. Additional data centered on the H spectral region, for the Cen stars and moonlight, were secured in 2004, using a 13.5m, 4608 pixels CCD, integrated to S/N 500 and with R = 43 000.
Data reduction was carried out by the standard procedure using IRAF111Image Reduction and Analysis Facility (IRAF) is distributed by the National Optical Astronomical Observatories (NOAO), which is operated by the Association of Universities for Research in Astronomy (AURA), Inc., under contract to the National Science Foundation (NSF).. After usual bias and flat-field correction, the background and scattered light were subtracted and the one-dimensional spectra were extracted. No fringing was present in our spectra. The pixel-to-wavelength calibration was obtained from the stellar spectra themselves, by selecting isolated spectral lines in the object spectra and checking for the absence of blends, the main screen for blends being the Solar Flux Atlas (Kurucz et al. 1984) and the Utrecht spectral line compilation (Moore et al. 1966). Gaussian fits were applied to the cores of the selected lines, and pixel- polynomial fits determined. For the short spectral selections individually reduced, a 2nd-order polynomial always sufficed, the average r.m.s. of the residuals being 0.005 or better. There followed the Doppler correction of all spectra to a rest reference frame.
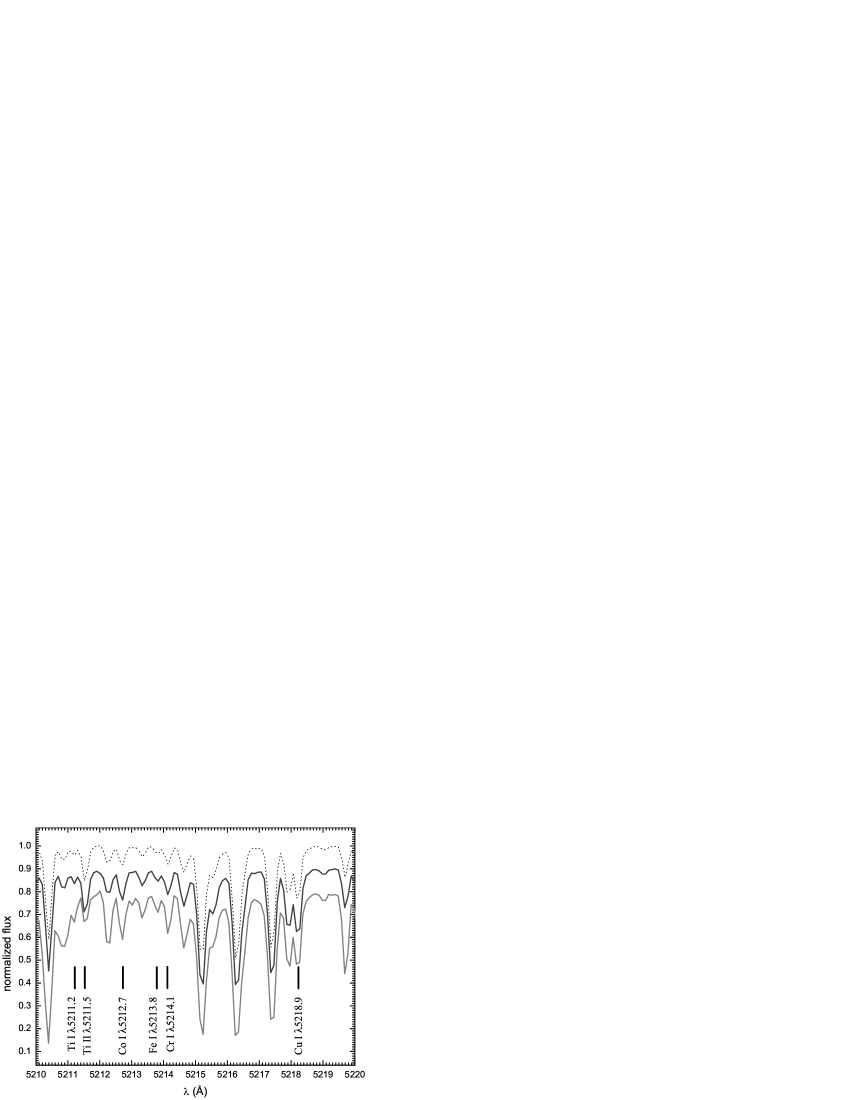
Normalization of the continuum is a very delicate and relevant step in the analysis procedure, since the accuracy of line equivalent width (hereafter ) measurements is very sensitive to a faulty determination of the continuum level. We selected continuum windows in the Solar Flux Atlas, apparently free from telluric or photospheric lines. We took great care in constantly comparing the spectra of the two Cen components and the Sun, to ensure that a consistent choice of continuum windows was achieved in all three objects, since the very strong-lined spectra of the Cen stars caused continuum depressions systematically larger than in the Sun. A number of pixels was chosen in the selected continuum windows, followed by the determination of a low order polynomial fitting these points. The wavelength coverage of each single spectrum was in all cases sufficient to ensure an appropriate number of windows, with special attention given to the edge of the spectra. Sample spectra are shown in Fig. 1. As will be seen below, the errors of the atmospheric parameters derived directly from the spectra, and the element abundances of Cen B, are greater than in Cen A, probably due to a less trouble-free normalization of its strongly line-blocked spectrum, and to a better cancellation of uncertainties in the differential analysis.
For the determination of element abundances, we chose lines of moderate intensity with profiles that indicate little or no blending. To avoid contamination of telluric lines we computed for each spectrum, using cross-correlation techniques, the displacement the telluric lines would show relative to their rest position , as given by the Solar Flux Atlas. We discarded photospheric lines closer than 2 from a telluric line.
The equivalent widths were measured by fitting single or multiple (the latter when deblending closely spaced lines) gaussian profiles to the selected lines, using IRAF. The moderately high spectral resolution we chose was designed to guarantee that the instrumental profile dominates the observed profile, and therefore that purely gaussian fits would adequately represent the observed line profiles. To test the representation of the solar flux spectrum by the moon, we also observed, with exactly the same setup, spectra of daylight and the asteroid Ceres. A direct comparison of the moon, daylight and asteroid s showed perfect agreement between the three sets of measurements to better than 1% even for moderately strong lines. This lends confidence to our determination of solar gf-values based on measured off the moon spectra. The moonlight spectra was actually preferred due to its higher S/N ratio as compared to Ceres, for which no high-quality spectrum could be obtained in a reasonable exposure time. Also, daylight spectra may show systematic fill-in effects by up to 4%, as a combination of aerosol and Rayleigh-Brillouin effects (this effect depends on observing angle and can be eliminated or minimized if care is applied, see Gray et al. 2000 for details). Even though no difference could be measured in our spectra, we considered it more prudent to use the moonlight spectrum as the solar proxy: it should be an accurate representation of the solar flux spectrum in the visible.
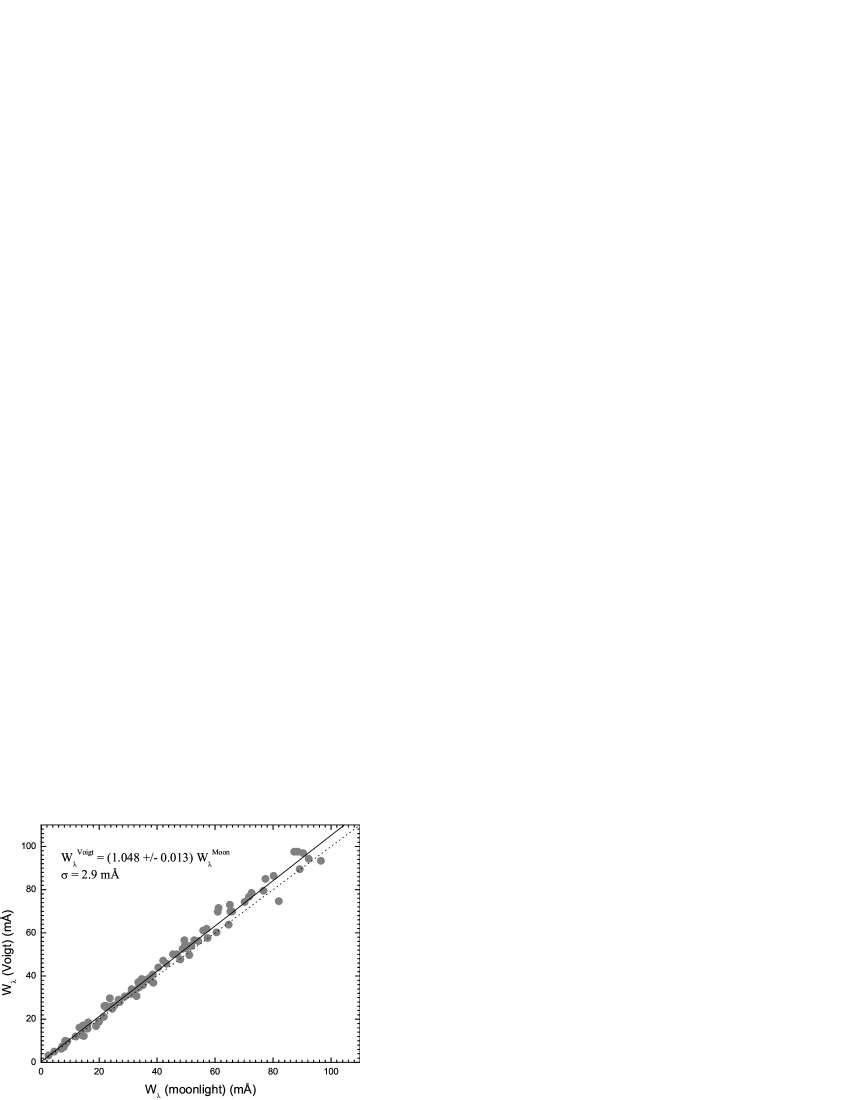
Even at our not-so-high resolution, lines stronger than 50 mÅ begin to develop visible Voigt wings. To account for this effect, we performed a linear regression of our gaussian moon s against the s measured off the Solar Flux Atlas by Meylan et al. (1993). These authors fitted Voigt profiles to a set of lines deemed sufficiently unblended to warrant the measurement of their true s, and they should be a homogeneous and high-precision representation of the true line intensities. We then determined the correction necessary to convert our measurements to a scale compatible with the Voigt-fitted s. The result is shown in Fig. 2, where the excellent correlation, with very small dispersion, is seen. The correction derived is
| (1) |
The r.m.s. standard deviation of the linear regression is 2.9 mÅ, regarding the Voigt as essentially error-free as compared to our data. This regression was applied to all our measurements. We take 2.9 mÅ as the 1 uncertainty of our internal measurements.
| (mÅ) | (mÅ) | (mÅ) | |||||||||||||||||
|---|---|---|---|---|---|---|---|---|---|---|---|---|---|---|---|---|---|---|---|
| (Å) | (eV) | Moon | A | B | (Å) | (eV) | Moon | A | B | (Å) | (eV) | Moon | A | B | |||||
| Na I | 5381.020 | 1.57 | -1.855 | 65.9 | 79.0 | 80.9 | 5701.557 | 2.56 | -2.116 | 89.2 | 99.5 | 127.9 | |||||||
| 6154.230 | 2.10 | -1.532 | 40.6 | 62.5 | 92.3 | 5418.756 | 1.58 | -2.116 | 52.8 | 66.9 | 55.8 | 5705.473 | 4.30 | -1.427 | 42.1 | 53.0 | 66.8 | ||
| 6160.753 | 2.10 | -1.224 | 60.5 | 86.3 | 120.4 | 5731.761 | 4.26 | -1.115 | 60.9 | 71.1 | 85.9 | ||||||||
| V I | 5784.666 | 3.40 | -2.487 | 33.0 | 42.8 | 61.0 | |||||||||||||
| Mg I | 5657.436 | 1.06 | -0.889 | 8.5 | 10.4 | 40.4 | 5811.916 | 4.14 | -2.383 | 11.3 | 17.6 | 26.3 | |||||||
| 5711.095 | 4.34 | -1.658 | 112.2 | 124.3 | … | 5668.362 | 1.08 | -0.940 | 7.3 | 11.7 | 38.2 | 5814.805 | 4.28 | -1.851 | 23.7 | 33.6 | 44.7 | ||
| 5785.285 | 5.11 | -1.826 | 59.0 | 68.3 | 88.7 | 5670.851 | 1.08 | -0.396 | 21.6 | 31.4 | 82.1 | 5835.098 | 4.26 | -2.085 | 16.2 | 22.8 | 35.0 | ||
| 5727.661 | 1.05 | -0.835 | 9.8 | 14.6 | 56.8 | 5849.681 | 3.69 | -2.963 | 8.3 | 13.5 | 22.9 | ||||||||
| Si I | 6135.370 | 1.05 | -0.674 | 14.1 | 20.6 | 59.6 | 5852.222 | 4.55 | -1.180 | 43.2 | 54.3 | 71.3 | |||||||
| 5517.533 | 5.08 | -2.454 | 14.5 | 25.5 | 21.8 | 6150.154 | 0.30 | -1.478 | 12.9 | 20.4 | 65.5 | 5855.086 | 4.61 | -1.521 | 24.5 | 34.8 | 42.8 | ||
| 5665.563 | 4.92 | -1.957 | 43.0 | 57.0 | 62.3 | 6274.658 | 0.27 | -1.570 | 11.1 | 15.0 | 60.6 | 5856.096 | 4.29 | -1.553 | 36.6 | 48.1 | 61.2 | ||
| 5684.484 | 4.95 | -1.581 | 65.1 | 79.4 | 78.6 | 6285.165 | 0.28 | -1.543 | 11.5 | 25.1 | 66.3 | 5859.596 | 4.55 | -0.579 | 77.4 | 88.4 | 105.6 | ||
| 5690.433 | 4.93 | -1.627 | 63.2 | 67.4 | 64.6 | 6098.250 | 4.56 | -1.760 | 17.7 | 25.7 | 35.4 | ||||||||
| 5701.108 | 4.93 | -1.967 | 41.9 | 57.3 | 58.2 | Cr I | 6120.249 | 0.92 | -5.733 | 7.5 | 11.8 | 29.1 | |||||||
| 5708.405 | 4.95 | -1.326 | 78.7 | 93.1 | 95.9 | 5214.144 | 3.37 | -0.739 | 18.2 | 27.2 | 39.9 | 6137.002 | 2.20 | -2.830 | 72.9 | 83.4 | 104.9 | ||
| 5793.080 | 4.93 | -1.896 | 46.1 | 62.4 | 60.3 | 5238.964 | 2.71 | -1.312 | 19.9 | 33.8 | 55.2 | 6151.616 | 2.18 | -3.308 | 51.1 | 60.7 | 80.5 | ||
| 6125.021 | 5.61 | -1.496 | 34.7 | 51.3 | 51.4 | 5272.007 | 3.45 | -0.311 | 32.9 | 42.9 | 88.0 | 6173.340 | 2.22 | -2.871 | 70.2 | 83.7 | 100.9 | ||
| 6142.494 | 5.62 | -1.422 | 38.5 | 52.5 | 49.8 | 5287.183 | 3.44 | -0.822 | 13.8 | 16.6 | 34.9 | 6219.287 | 2.20 | -2.412 | 93.6 | 102.9 | 134.6 | ||
| 6145.020 | 5.61 | -1.397 | 40.5 | 55.1 | 55.3 | 5296.691 | 0.98 | -1.343 | 96.5 | 107.0 | 153.1 | 6226.730 | 3.88 | -2.068 | 31.2 | 40.1 | 56.8 | ||
| 6243.823 | 5.61 | -1.220 | 51.8 | 67.5 | 64.1 | 5300.751 | 0.98 | -2.020 | 64.7 | 76.6 | 103.7 | 6240.645 | 2.22 | -3.295 | 50.0 | 60.0 | 80.4 | ||
| 6244.476 | 5.61 | -1.264 | 48.8 | 66.5 | 66.3 | 5304.183 | 3.46 | -0.701 | 16.8 | 25.1 | 16.8 | 6265.131 | 2.18 | -2.537 | 88.3 | 99.9 | 135.0 | ||
| 5318.810 | 3.44 | -0.647 | 19.2 | 27.9 | 53.4 | 6271.283 | 3.33 | -2.703 | 26.5 | 36.7 | 54.9 | ||||||||
| Ca I | 5784.976 | 3.32 | -0.360 | 34.0 | 48.0 | 72.9 | |||||||||||||
| 5261.708 | 2.52 | -0.564 | 126.9 | 123.0 | 182.1 | 5787.965 | 3.32 | -0.129 | 49.4 | 59.8 | 83.8 | Fe II | |||||||
| 5867.572 | 2.93 | -1.566 | 26.7 | 35.8 | 58.6 | 5234.630 | 3.22 | -2.199 | 90.4 | 110.9 | 92.7 | ||||||||
| 6161.295 | 2.52 | -1.131 | 135.5 | 85.7 | 128.7 | Cr II | 5264.812 | 3.33 | -2.930 | 53.1 | 67.2 | 64.8 | |||||||
| 6163.754 | 2.52 | -1.079 | 126.6 | 87.7 | 93.8 | 5305.855 | 3.83 | -2.042 | 27.1 | 37.8 | 24.1 | 5325.560 | 3.22 | -3.082 | 51.1 | 66.3 | 52.7 | ||
| 6166.440 | 2.52 | -1.116 | 72.6 | 88.9 | 114.0 | 5313.526 | 4.07 | -1.539 | 38.7 | 49.3 | 43.4 | 5414.075 | 3.22 | -3.485 | 33.7 | 46.0 | 32.1 | ||
| 6169.044 | 2.52 | -0.718 | 97.7 | 113.4 | 158.0 | 5425.257 | 3.20 | -3.229 | 45.5 | 58.1 | 46.3 | ||||||||
| 6169.564 | 2.52 | -0.448 | 118.5 | 137.5 | 185.8 | Mn I | 6149.249 | 3.89 | -2.761 | 37.8 | 48.4 | 30.0 | |||||||
| 5394.670 | 0.00 | -2.916 | 83.4 | 103.8 | 165.0 | 6247.562 | 3.89 | -2.325 | 57.1 | 69.6 | 48.3 | ||||||||
| Sc I | 5399.479 | 3.85 | -0.045 | 42.9 | 63.4 | 96.6 | |||||||||||||
| 5671.826 | 1.45 | 0.538 | 16.1 | 24.2 | 64.1 | 5413.684 | 3.86 | -0.343 | 28.0 | 45.8 | 73.1 | Co I | |||||||
| 6239.408 | 0.00 | -1.270 | 7.8 | 12.3 | 12.9 | 5420.350 | 2.14 | -0.720 | 88.6 | 116.4 | 177.5 | 5212.691 | 3.51 | -0.180 | 20.0 | 34.8 | 50.6 | ||
| 5432.548 | 0.00 | -3.540 | 54.9 | 73.3 | 141.0 | 5301.047 | 1.71 | -1.864 | 22.5 | 33.8 | 57.9 | ||||||||
| Sc II | 5537.765 | 2.19 | -1.748 | 37.3 | 57.4 | 113.3 | 5342.708 | 4.02 | 0.661 | 35.1 | 48.5 | 80.5 | |||||||
| 5318.346 | 1.36 | -1.712 | 16.0 | 23.3 | 28.7 | 5359.192 | 4.15 | 0.147 | 11.9 | 20.1 | 37.3 | ||||||||
| 5526.815 | 1.77 | 0.099 | 80.2 | 97.8 | 86.5 | Fe I | 5381.772 | 4.24 | 0.000 | 8.2 | 15.6 | 20.0 | |||||||
| 5657.874 | 1.51 | -0.353 | 71.2 | 85.9 | 76.5 | 5054.647 | 3.64 | -1.806 | 53.0 | 67.6 | 97.6 | 5454.572 | 4.07 | 0.319 | 18.9 | 26.8 | 42.8 | ||
| 5684.189 | 1.51 | -0.984 | 40.4 | 55.6 | 48.9 | 5067.162 | 4.22 | -0.709 | 85.4 | 90.3 | 123.1 | ||||||||
| 6245.660 | 1.51 | -1.063 | 37.6 | 51.1 | 51.0 | 5109.649 | 4.30 | -0.609 | 87.9 | 100.1 | 143.0 | Ni I | |||||||
| 5127.359 | 0.93 | -3.186 | 109.6 | 117.7 | 164.8 | 5094.406 | 3.83 | -1.088 | 32.4 | 45.0 | 62.2 | ||||||||
| Ti I | 5151.971 | 1.01 | -3.128 | 108.9 | 120.8 | 177.5 | 5220.300 | 3.74 | -1.263 | 28.5 | 40.6 | 52.1 | |||||||
| 5071.472 | 1.46 | -0.683 | 36.1 | 45.7 | 99.0 | 5213.818 | 3.94 | -2.752 | 7.5 | 13.0 | 20.2 | 5435.866 | 1.99 | -2.340 | 57.4 | 73.8 | 88.9 | ||
| 5113.448 | 1.44 | -0.815 | 30.9 | 36.4 | 98.3 | 5223.188 | 3.63 | -2.244 | 32.3 | 41.6 | 56.5 | 5452.860 | 3.84 | -1.420 | 19.0 | 29.1 | 37.3 | ||
| 5145.464 | 1.46 | -0.615 | 39.6 | 50.8 | 90.6 | 5225.525 | 0.11 | -4.577 | 83.2 | 92.7 | 128.8 | 5846.986 | 1.68 | -3.380 | 24.2 | 35.8 | 56.9 | ||
| 5147.479 | 0.00 | -1.973 | 43.7 | 66.8 | 102.7 | 5242.491 | 3.63 | -1.083 | 92.3 | 107.5 | 132.2 | 6176.807 | 4.09 | -0.315 | 61.2 | 86.8 | 90.1 | ||
| 5152.185 | 0.02 | -2.130 | 34.9 | 43.5 | 79.1 | 5243.773 | 4.26 | -0.947 | 69.6 | 84.3 | 91.5 | 6177.236 | 1.83 | -3.476 | 16.4 | 29.4 | 41.2 | ||
| 5211.206 | 0.84 | -2.063 | 9.3 | 13.7 | … | 5250.216 | 0.12 | -4.668 | 78.1 | 96.1 | 136.0 | ||||||||
| 5219.700 | 0.02 | -2.264 | 28.9 | 39.0 | 82.9 | 5321.109 | 4.43 | -1.191 | 48.0 | 59.5 | 76.8 | Cu I | |||||||
| 5295.780 | 1.07 | -1.633 | 14.2 | 18.6 | 49.8 | 5332.908 | 1.56 | -2.751 | 102.8 | 118.6 | 139.8 | 5218.209 | 3.82 | 0.293 | 55.9 | 71.8 | 82.5 | ||
| 5426.236 | 0.02 | -2.903 | 9.0 | 12.1 | 48.2 | 5379.574 | 3.69 | -1.542 | 64.8 | 76.5 | 94.4 | 5220.086 | 3.82 | -0.630 | 15.5 | 25.0 | 32.5 | ||
| 5679.937 | 2.47 | -0.535 | 8.6 | 10.1 | 28.8 | 5389.486 | 4.41 | -0.533 | 87.3 | 102.2 | 123.0 | ||||||||
| 5866.452 | 1.07 | -0.842 | 49.6 | 64.8 | 107.5 | 5395.222 | 4.44 | -1.653 | 25.2 | 33.7 | 52.1 | Y II | |||||||
| 6098.694 | 3.06 | -0.095 | 6.9 | 10.1 | 27.6 | 5432.946 | 4.44 | -0.682 | 76.4 | 90.2 | 106.7 | 5087.426 | 1.08 | -0.329 | 49.3 | 53.7 | 54.2 | ||
| 6126.224 | 1.07 | -1.358 | 25.3 | 31.9 | 68.3 | 5491.845 | 4.19 | -2.209 | 14.3 | 25.4 | 32.9 | 5289.820 | 1.03 | -1.847 | 4.5 | 5.6 | 7.7 | ||
| 6258.104 | 1.44 | -0.410 | 54.2 | 65.5 | 102.5 | 5522.454 | 4.21 | -1.418 | 46.8 | 59.9 | 70.4 | 5402.780 | 1.84 | -0.510 | 14.7 | 22.2 | 22.1 | ||
| 5560.207 | 4.43 | -1.064 | 55.1 | 66.7 | 75.6 | ||||||||||||||
| Ti II | 5577.013 | 5.03 | -1.415 | 14.5 | 20.3 | 26.3 | Ba II | ||||||||||||
| 5211.544 | 2.59 | -1.551 | 33.5 | 46.1 | 35.2 | 5661.348 | 4.28 | -1.802 | 25.5 | 33.6 | 48.6 | 5853.688 | 0.60 | -0.828 | 67.5 | 73.4 | 68.6 | ||
| 5336.783 | 1.58 | -1.592 | 76.7 | 90.0 | 89.7 | 5680.240 | 4.19 | -2.255 | 13.2 | 19.1 | 27.8 | 6141.727 | 0.70 | 0.244 | 124.4 | 127.4 | 140.1 | ||
3 Atmospheric parameters and Fe abundance
A solar gf-value for each spectral line was calculated from a LTE, 1-D, homogeneous and plane-parallel solar model atmosphere from the NMARCS grid, as described by Edvardsson et al. (1993) (see http://marcs.astro.uu.se, and also Gustafsson et al. 2008). The adopted parameters for the Sun were = 5780K, log g = 4.44, Fe/H = 0.00 and = 1.30 km s-1, and we employed the s measured off the moon spectra, corrected to the Voigt scale. The adopted solar absolute abundances are those of Grevesse & Noels (1993). In a purely differential analysis such as ours, the absolute abundance scale is inconsequential. We provide in Table 2 the details of all lines used. They include wavelength , excitation potential , the calculated solar log values, and the raw measured s in the moon’s, Cen A and Cen B spectra, prior to the correction to the Voigt system (Fig. 2). Hyperfine structure (HFS) corrections for the lines of Mg i, Sc i, Sc ii, V i, Mn i, Co i, Cu i and Ba ii were adopted from Steffen (1985). del Peloso et al. (2005b) discuss the influence of adopting different HFS scales on abundance analyses of Mn and Co, concluding that it is small, particularly for metallicities not too far from the solar one, as compared to not using any HFS data. Therefore, the source of the HFS corrections is not an important issue on the error budget of our analysis, at least for Mn and Co. The other elements of our analysis requiring HFS have usually simpler structures (excepting Cu), and it is safe to conclude that the use of HFS has not introduced any important error.
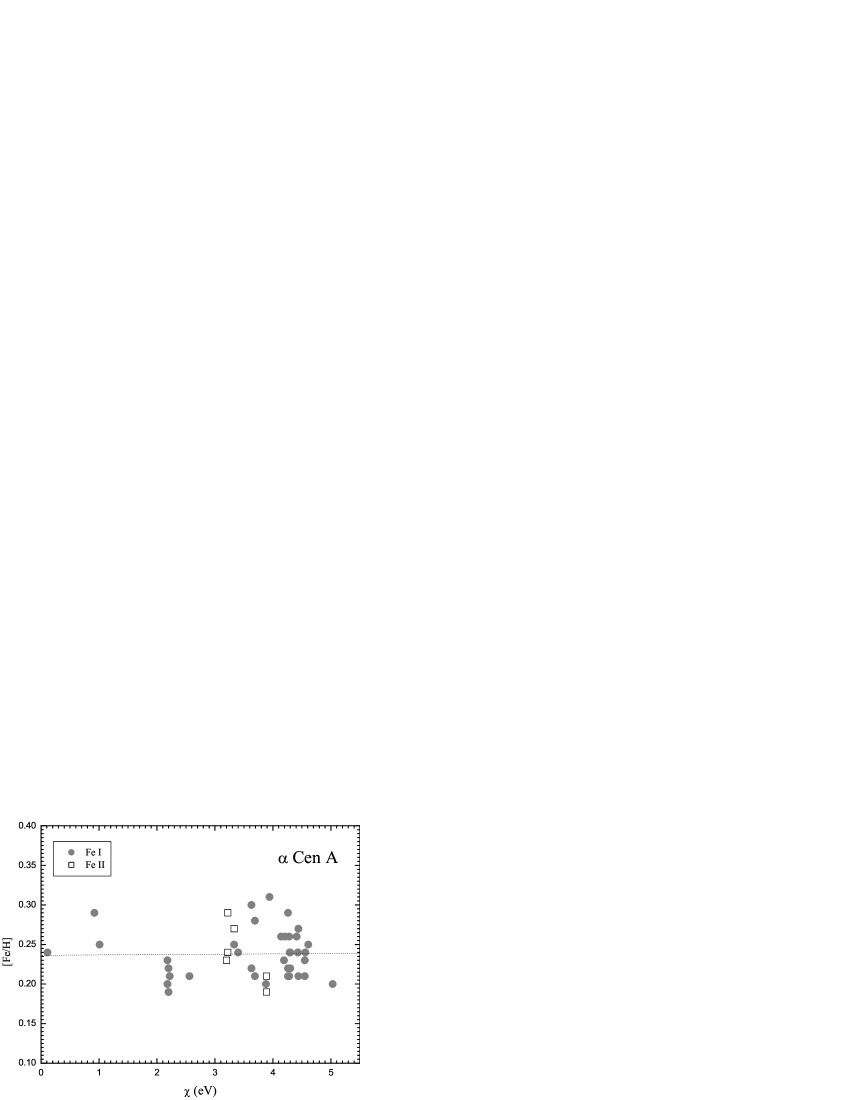
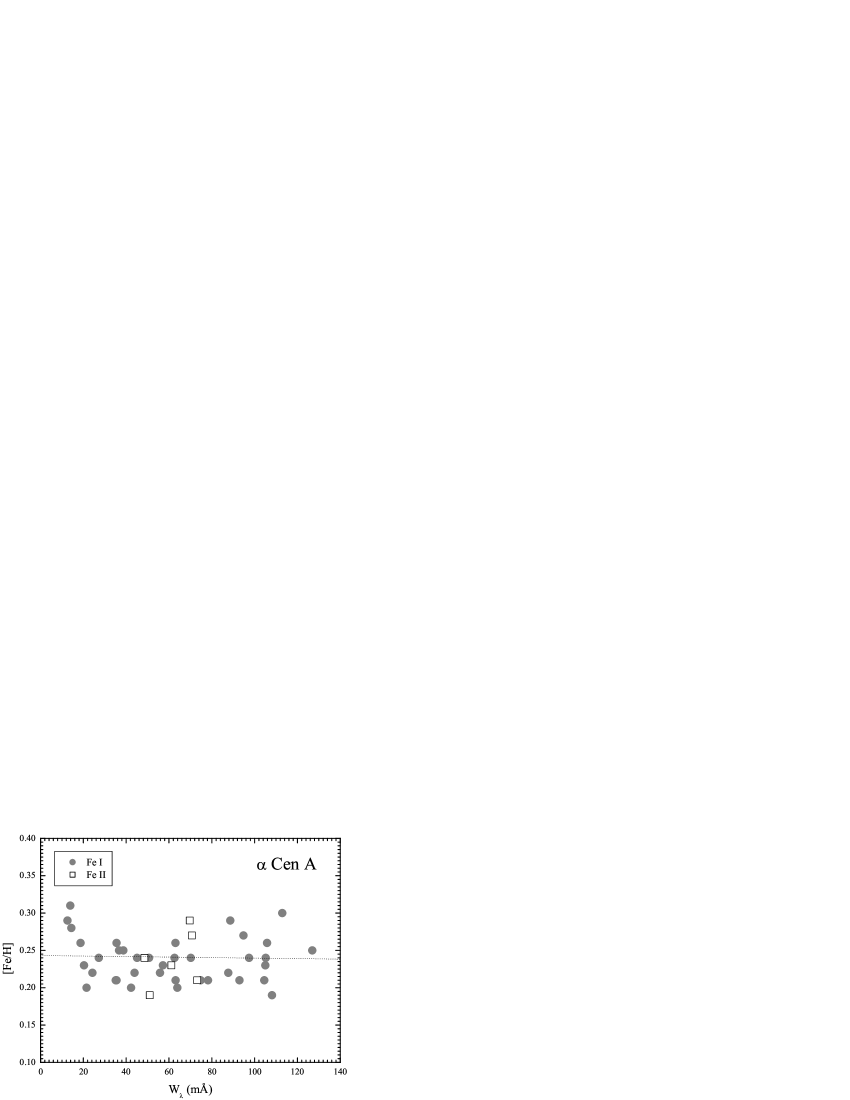
The atmospheric parameters of the Cen stars were determined by simultaneously realizing the excitation & ionization equilibria of Fe i and Fe ii. For each star, was obtained by forcing the Fe i line abundances to be independent of their excitation potential. Surface gravity was determined by forcing the lines of Fe i and Fe ii to yield the same abundance. Microturbulence velocities were determined forcing the lines of Fe i to be independent of their s. The Fe abundance Fe/H (we use throughout the notation A/B = log N(A)/N(B)star - log N(A)/N(B)Sun, where N denotes the number abundance) is automatically obtained as a byproduct of this method. The solution thus obtained is unique for a given set of gf values, s and model atmospheres, being independent of the starting point and the iteration path. The spectrum synthesis code is originally due to Dr. Monique Spite (Observatoire de Paris-Meudon, Spite 1967), having been continuously up-dated in the last 40 years.
Formal errors are estimated as follows: for , the 1 uncertainty of the slope of the linear regression in the [Fe/H] vs. diagram yields the variation which could still be accepted at the 1 level. For the microturbulence velocity, the same procedure provides the 1 microturbulence uncertainty in the [Fe/H] vs. diagram. For the metallicity [Fe/H], we adopt the standard deviation of the distribution of abundances derived from the Fe i lines. The error in is estimated by evaluating the variation in this parameter which produces a disagreement of 1 between the abundances of Fe i and Fe ii, where we regarded the abundance offset as 1 when its value was equal to the largest dispersion of the Fe abundances (usually that of Fe ii). The results of this procedure are shown in Fig. 3, where we plot the iron abundances of Cen A derived from lines of both Fe i and Fe ii against the excitation potential and s. The baseline of the Fe i lines is seen to be large both in and .
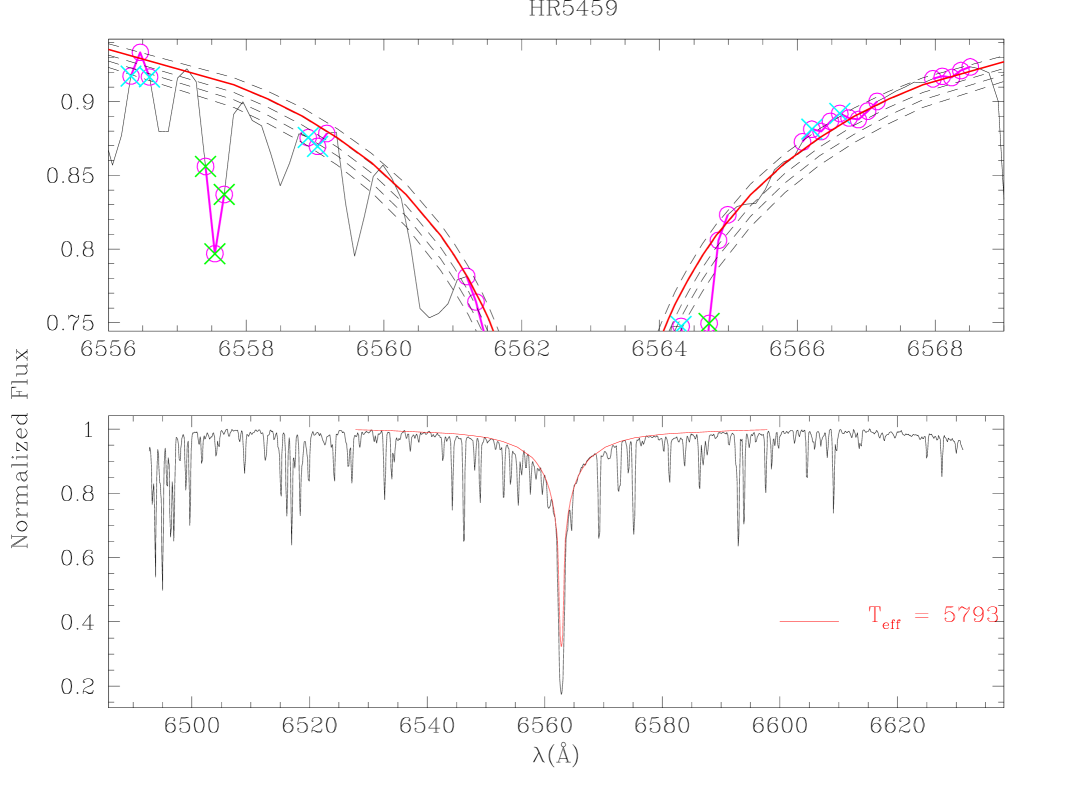
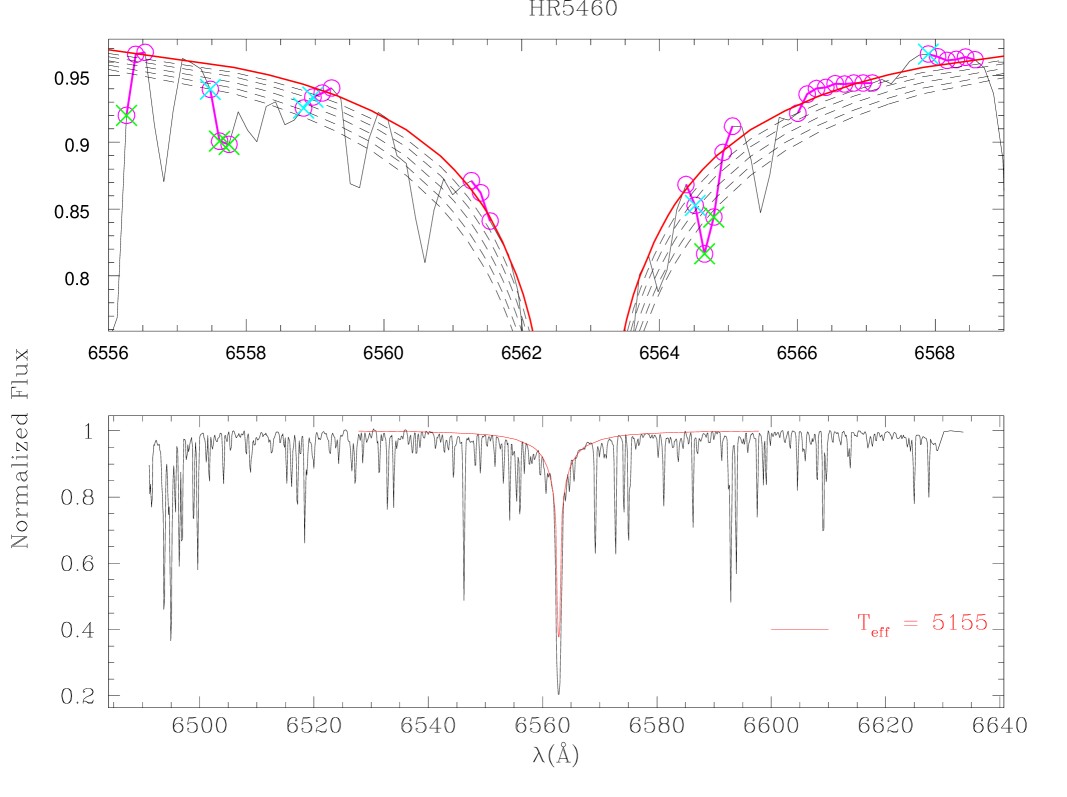
Additional effective temperatures were determined by fitting the observed wings of H, using the automated procedure described in detail in Lyra & Porto de Mello (2005). We have employed for the Cen stars new spectroscopic data from the Observatório do Pico dos Dias, with the same resolution but greater signal-to-noise ratio than used by Lyra & Porto de Mello (2005). This procedure is shown in Fig. 4 and Fig. 5. We found = 5793 25 K ( Cen A) and = 5155 4 K ( Cen B). The moon spectrum is very well fitted by the parameters adopted for the NMARCS solar atmosphere model. The quoted standard errors refer exclusively to the dispersion of temperature values attributed to the fitted profile data points. This makes the uncertainty of the Cen B artificially very low, due to the high number of rejected points. An analysis of errors incurred by the atmospheric parameters assumed in the fitting procedure, plus the photon statistics (not including possible systematic effects produced by the modelling, see Lyra & Porto de Mello (2005) for a full discussion), points to an average error of 50 K in the s determined from the H line. For the very low-noise spectra of these two stars, the expected errors would be slightly less, but the greater difficulty in finding line-free sections in the H profile of the severely blended spectrum of Cen B offsets this advantage. For the latter, thus, the probable uncertainty should be closer to 100 K. The normalization procedure is a a relevant source of error for s derived from H, as discussed by Lyra & Porto de Mello (2005): they found that a 0.2% error in the continuum level translates to 25 K in .
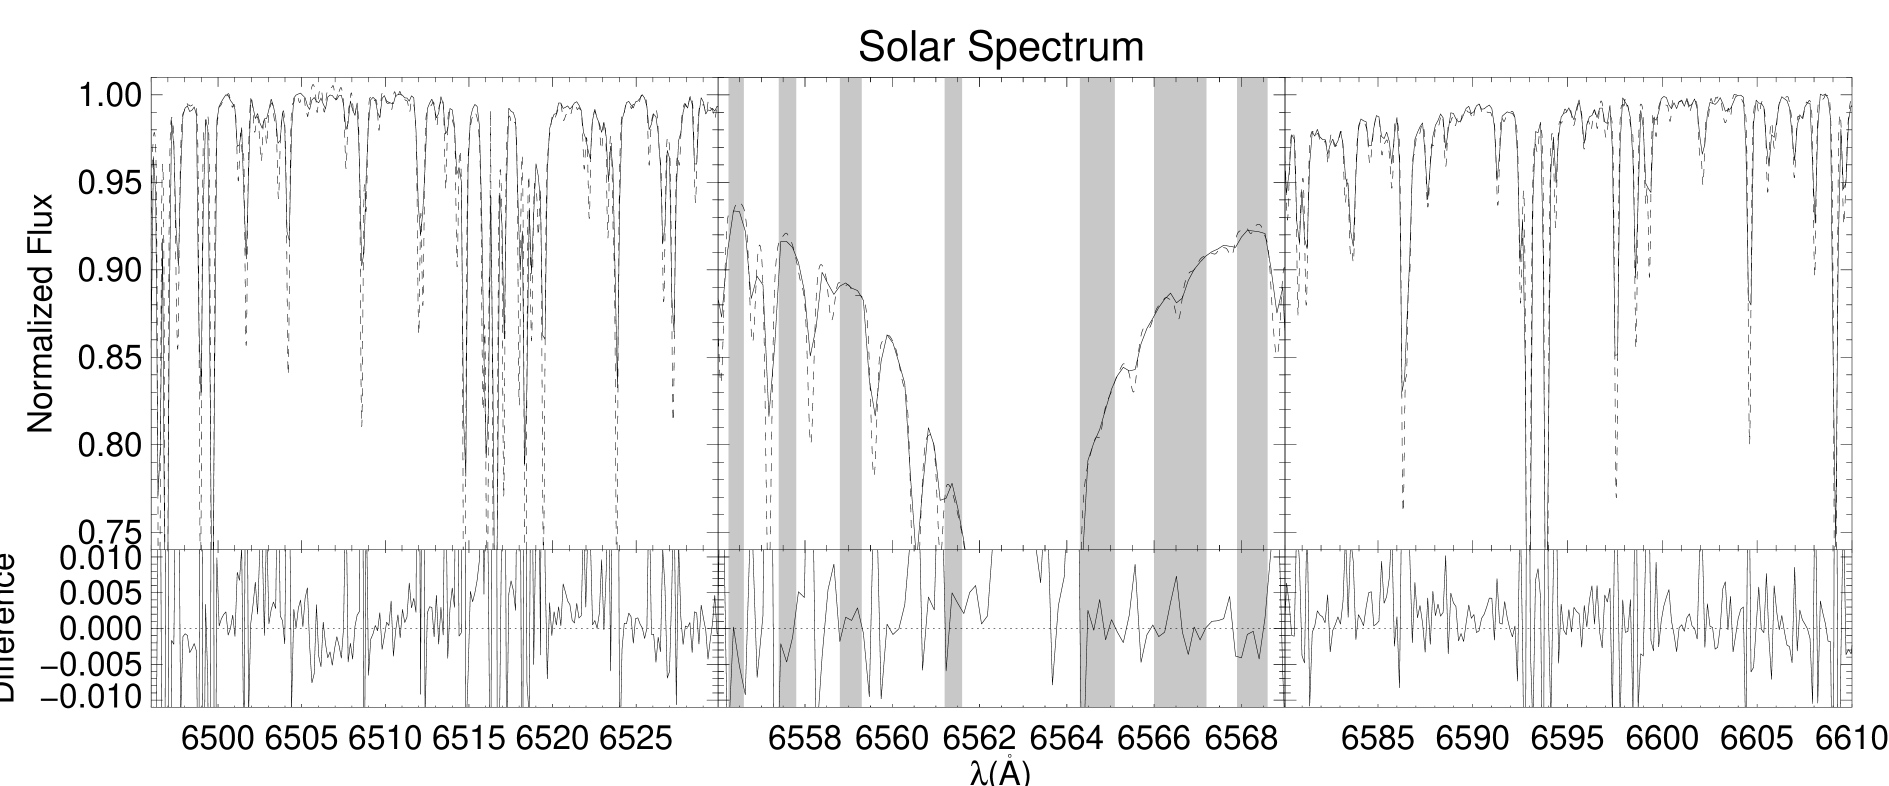
As an external check on our normalization procedure, we have compared H spectra of the Sun (moon) from Lyra & Porto de Mello (2005), from eight independent observing runs, also reduced independently, with the data of ABLC04, who performed a careful two-dimensional continuum normalization of the echelle spectra. Due to normalization problems in the FEROS/ESO (La Silla) spectra, these authors employed H spectra as a criterion only for the northern stars of their sample, which could be observed with the McDonald 2dcoudé spectrograph. So a direct comparison between the two sets of H spectra is not possible for the Cen stars. We found, for the solar spectra, an average difference of only (0.29 0.39) %, as measured in those regions relevant to the determination. This assures us of the absence of important systematic errors in this respect. A comparison of the H normalized spectra is shown in Fig. 6.
Another check on the values of the two stars may be obtained from the IRFM scale of Ramírez & Meléndez (2005a). Ramírez & Meléndez (2005b) compare, for the two Cen stars, direct s, obtained from measured bolometric fluxes and angular diameters, with those determined from the IRFM method, as well those obtained from the application of their own (IRFM) scale to color indices and an adopted metallicity of [Fe/H] = 0.20, for both stars. Respectively, they find, for Cen A, (direct) = 5771, (IRFM) = 5759 K and (calibration) = 5736 K; the corresponding values for Cen B are, respectively, (direct) = 5178 K, (IRFM) = 5221 K and (calibration) = 5103 K. They adopt as weighted averages ( Cen A) = 5744 72 K and ( Cen B) = 5136 68 K. For Cen A, a good agreement is found between this and our H one. Formally, there is also a reasonable agreement between this and our spectroscopic one. For Cen B, however, the spectroscopic is significantly higher than those derived from H and the IRFM method.
Yıldız (2007) drew attention to often neglected BVRI (Cousins system) measurements of the system’s components by Bessell (1990). It has long been considered risky to use color indices for the determination of very bright stars, in which a variety of systematic effects are expected as compared to standard stars of photometric systems, among which non-linearity, detector dead-time, and, in the case of Cen, possible contamination by the companion (see Chmielewski et al. 1992 for a full discussion). Introducing Bessell’s color indices into the Ramírez & Meléndez (2005b) calibrations, along with our metallicities (Table 3), we derive ( Cen A) = 5794 34 K and ( Cen B) = 5182 19 K, as a weighted average of the (), () and () color indices, the latter two in the Cousins system. These new photometric determinations, directly from the calibrations, agree well, for Cen A, with both the H and the spectroscopic one. On the other hand, for Cen B this determination lessens slightly, but does not eliminate, the disagreement between the spectroscopic and the other two. We must therefore state clearly that there is an offset between the spectroscopic of Cen B and the other two determinations. These last figures, in a classical spectroscopic analysis of solar-type stars, would be regarded as “photometric” s, to be compared to those obtained from other methods. Our results are all displayed in Table 3, where we also list the direct surface gravities resulting from the observed radii and dynamical masses.
Valenti & Fischer (2005) have derived the atmospheric parameters of Cen A and B by means of a different technique. They have fitted directly large sections of the observed spectra to synthetic ones, obtaining the atmospheric parameters (this technique also relies on the excitation & ionization equilibria of atomic species). Their analysis is differential with respect to the Sun, for which they adopted = 5770, [Fe/H] = 0.00 and log g = 4.44. They quote uncertainties of 44 K, 0.03 dex and 0.06 dex, respectively, for , log g and [Fe/H]. Their results are = 5802 K, log g = 4.33 and [Fe/H] = +0.23, for Cen A, and = 5178 K, log g = 4.56 and [Fe/H] = +0.21, for Cen B. These figures are in good agreement, even within their very small claimed uncertainties, with our spectroscopic parameters, again, with the exception of the spectroscopic of Cen B. Particularly, their log g values are in excellent agreement with the direct log g values of Table 3.
Frutiger et al. (2005) have also analysed the spectra of Cen A and B by a fundamentally different and promising technique. They have inverted high resolution (R 105), moderately high S/N (250) spectra of the stars by means of a multi-component model photosphere. The components take into account rotational broadening, center-to-limb variations and vertical and horizontal flows of surface elements, such as granules and inter-granular areas. In this approach, the full line profile is used to constrain the temperature stratification of the atmosphere, as well as the velocity fields (Allende-Prieto et al. 1998). The technique is rather model-dependent, however, and should be compared with classical spectroscopic analyses with caution. For the 3-component models, the ones they favor, s and [Fe/H] substantially lower than those found by us are obtained (their table 4). For Cen A, they favor = 5705 K, log g = 4.28 0.03 and [Fe/H] = +0.08 0.02 (we have converted their abundances from absolute to relative values with respect to the Sun, which they also analysed with the same techniques. Their analysis, in this sense, may also be considered as differential). For Cen B, the results are = 5310 K, log g = 4.74 0.02 and [Fe/H] = 0.05 0.01.
It is not straightforward to determine the uncertainties of their values, since they only quote the uncertainty of this parameter as derived by a weighted average of the fluxes of each atmospheric component, weighted by the filling-factors, by means of the Eddington-Barbier relation applied to a grey atmosphere. The s we quoted are the ones they computed from the flux spectra obtained from their temperature stratifications fed into an ATLAS9 model, for which they provided no formal uncertainty. The uncertainties of their s within the Eddington-Barbier approximation, are, respectively, 130 K and 67 K for Cen A and B. Within these error bars, then, their s resulting purely from the inversion procedure (letting all parameters free) may be regarded as compatible with ours. Their metallicities, however, are significantly lower. They also found a very high log g for Cen B, prompting them to attempt a larger number of inversions this for component, first fixing log g = 4.48 dex, which led to a reduced = 5154 K with no appreciable change in metallicity, and then fixing the rotational velocity, which produced = 5260 K, again with no significant impact on metallicity, and a new log g = 4.68 0.05.
The s favored by the inversion method of Frutiger et al. (2005) add to a complex situation. They seem to be in good agreement with our spectroscopic for Cen B when all parameters are independently derived from the inversion method, but the agreement switches to one with the H and photometric s, when the surface gravity is fixed. All [Fe/H] values they obtain are lower than ours. For Cen A, their surface gravity is in good agreement with ours and the direct one. It is difficult, however, to reconcile their surface gravity for Cen B with our spectroscopic one, and the direct one given in Table 3. It is not clear whether their results can be directly compared to ours, given the difference in approach. These authors discuss the possibility of improving their technique by higher resolution spectra: they remark on the difficulty of disentangling effects of rotation, macro-turbulence, granulation and instrumental profile. This sophisticated approach, probably, can lead to substantially improved constraints to the atmospheric parameters of solar-type stars, leading to increased physical insight on the shortcomings of 1-D, static atmospheric models.
3.1 Systematic offsets between spectroscopic, Balmer line and photometric scales
The study of the atmospheric parameters collected at Table 1 reveals an interesting pattern, if one again considers only the analyses published since the 90s, invariably based on high S/N spectra acquired with solid-state detectors. For Cen A, the works employing the Fe i/Fe ii criterion, alone or combined with another method, obtained s generally higher than those derived exclusively from photometry (excepting the result of FM90, which is one of the lowest and applied the excitation & ionization approach). Thus, the present work, Santos et al. (2004) and Neuforge-Verheecke & Magain (1997) found the highest s, while ABLC04, relying only in photometry, derived the lowest . Doyle et al. (2005) also used the stellar luminosity and radius to derive , and found a value lower than the spectroscopic ones, but for the FM90 analysis. ABLC04 reported good agreement of their photometric s with those derived from the H profiles. Interestingly, they also found an offset of 120 K between their s and the ones of Kovtyukh et al. (2003), the latter being the higher. Kovtyukh et al. (2003) derived s by the line-depth ration method (Gray & Johanson 1991), and their s were actually calibrated by spectroscopic ones. The pattern just discussed suggests that the spectroscopic scale is indeed hotter than the photometric and Balmer line one, and that the latter two are in generally good agreement. The situation for Cen B is unfortunately much less clear: there are less analyses, and the authors employed a more restricted set of criteria. Nevertheless, the lowest is again due to photometric methods (ABLC04), the highest one in this case corresponding to the H-derived of Chmielewski et al. (1992).
A disagreement between photometric and spectroscopic scales has been recently pointed out by a number of authors. Ramírez et al. (2007) discussed how the Fe i/Fe ii ionization equilibrium is not realized in cool stars when an IRFM scale is applied, in the derivation of oxygen abundances from the 7774 triplet lines. Their sample is large, and they convincingly show (their fig. 5) that the offset between the IRFM and the spectroscopic scales is significant for 5000 K (a reasonable agreement was found for 6000 K). They note that Ramírez & Meléndez (2004) found the same offset, as did Santos et al. (2004), Yong et al. (2004) and Heiter & Luck (2003). Yong et al. (2004) suggested that non-LTE effects, shortcomings of the model atmosphere representation for cool stars, or as yet unidentified effects, might be responsible for the discrepancy. Ramírez et al. (2007), however, note that Santos et al. (2005) reported good agreement between IRFM and spectroscopic scales. Adding to this complex picture, Casagrande et al. (2006), in the derivation of their own IRFM scale, also found good agreement between spectroscopic and IRFM s. They argue that the disagreement reported by other authors might be due, at least in part, to uncertainties in the different absolute flux calibrations adopted, and suggest that additional direct angular diameter measurements for a well chosen sample of G and K dwarfs might go a long way towards clarifying the disagreement of the scales.
The results of Casagrande et al. (2006) were essentially backed by the scale of Masana et al. (2006). The latter employed a variation of the IRFM method, in which the stellar energy distributions were fitted, from the optical to the IR, to synthetic photometry computed from stellar atmosphere models. They found their results only slightly offset from the IRFM results. The offset, at 30 K, was deemed to be small, and these authors optimistically assert that their scale agrees with the spectroscopic one for FGK dwarfs and subgiants, such that s for this class of stars may be regarded as accurate within 1% or better.
The consistency of the different scales is sought as an important confirmation that 1-D, plane-parallel, static and LTE model atmospheres adequately represent cool stars, if not in the absolute, at least in the relative sense, provided that the Sun can be accurately placed in the stellar context. The solar placement in the Fe i/Fe ii excitation & ionization equilibria and Balmer line scale is obtained by the observation of solar flux spectra. An accurate photometric placement of the Sun in the corresponding scale, however, is a difficult task still beset with large uncertainties (see, e.g., Holmberg et al. 2006 for an up-to-date discussion). These three scales actually gauge rather dissimilar physical quantities. The excitation & ionization is obtained by matching models to observed spectral line intensities. The Balmer line measures the temperature stratification of the atmosphere, which is mapped onto the line wings by the depth-dependence of the source-function. The photometric must reproduce the stellar flux distribution in a large wavelength regime, and is the one most directly tied to the fundamental definition of effective temperature (Böhm-Vitense 1981). As long as the consistency between these scales is realized no better than within 150 K, the of cool dwarfs and subgiants will remain uncertain by this amount at the very least.
Non-LTE and other possibly more complex effects have repeatedly been blamed for offsets between spectroscopically and photometrically derived atmospheric parameters in cool stars. Schuler et al (2006a), in their analysis of Hyades dwarfs, reported a systematic offset of the oxygen abundances derived from the 7774 triplet lines, for 5450 K, in the opposite sense of the NLTE expectations. They tentatively suggest that chromospheric activity might be at least partially responsible for the offset, an explanation also concurred by Morell & Micela (2004), though the latter propose that model atmosphere pitfalls might be also present. Schuler et al. (2006b) reinforce this interpretation in an analysis of the 6300 [OI] line in the very active Hyades stars, reporting offsets between Fe i/Fe ii abundances which increase as 5000 K. It should be emphasized that high chromospheric activity is unlikely to be a source of the discrepancy of Cen B, since both components of the system are inactive stars, which probably implies that the problem is more complex. We also draw attention to the result of Shchukina & Trujillo-Bueno (2001), who found an offset of the Fe i/Fe ii abundances of the Sun. They interpret this offset as well explained by NLTE effects amounting to 0.07 dex for Fe i, the best fit Fe abundance for a LTE analysis being the lower by this amount. They assert that a full 3-D, NLTE model atmosphere formulation is able to bring the solar photospheric Fe abundance in line with the meteoritic one, at log N(Fe) = 7.50 (in the usual scale where log N(H) = 12.00). The main cause of the offset is the overionization of Fe i, and the larger errors are seen in the s of low excitation lines, which are weaker in the NLTE case.
It is interesting to note that this effect, in a classical LTE model atmosphere analysis, would result in the overabundance of the high excitation Fe i lines, an effect naturally interpreted as too low a being attributed to the model. This is exactly the condition necessary for a 1-D, LTE analysis to lead to the high spectroscopic that we obtained. Forcing the Fe i/Fe ii abundances into agreement in a LTE analysis would indeed call for a higher , to a first approximation, by 100 K, a value similar to the difference between our spectroscopic and H/photometric s of Cen B. We suggest that the similarity in atmospheric parameters between Cen A and the Sun, in the context of a differential analysis, led to a good agreement between the three criteria for the former. For Cen B, a much cooler object, an imperfect cancellation of the presence of NLTE effects is probably the reason why the three different criteria do not agree.
Even if the presence of NLTE effects and other problems can be established, one must keep in mind that other uncertainties are present in the photometric and H scales, as discussed above. It would be very valuable to extend the novel approaches of Valenti & Fischer (2005) and Frutiger et al. (2005) to additional stars for which stringent observational constraints are available, to quantify how discrepancies of the type discussed here do occur for objects with atmospheric parameters increasingly different from the Sun’s. At present, we can state that it is likely that our spectroscopic for Cen B is more uncertain that the other two determinations, being too high. This conclusion is, however, drawn in the context of a confusing picture. Additional work is clearly necessary before a definitive judgment can be passed on the consistency between the excitation & ionization, Balmer line and photometric scales can be reached.
Notwithstanding the discrepancies, if we follow an usual practice in spectroscopic abundance analysis which obtain atmospheric parameters with more than one criterion, mean s for the Cen stars can be calculated from the values of Table 3, averaged by their inverse variances. The results are ( Cen A) = 5824 27 K and ( Cen B) = 5223 62 K, where the quoted uncertainties are the standard deviations of the average, and do not reflect external and systematic errors. Good agreement between our ionization surface gravities, and those directly determined from measured masses and radii, within the errors, for both stars, is realized.
| (K) | (K) | (K) | (K) | (km s-1) | ||||
|---|---|---|---|---|---|---|---|---|
| excitation | H | photometric | weighted mean | ionization | direct | |||
| Cen A | 584727 | 579350 | 579434 | 582426 | 4.340.12 | 4.3070.005 | 0.240.03 | 1.460.03 |
| Cen B | 531628 | 5155100 | 518219 | 522362 | 4.440.15 | 4.5380.008 | 0.250.04 | 1.280.12 |

| element | Cen A | Cen B | ||||||
|---|---|---|---|---|---|---|---|---|
| [X/Fe] | [X/Fe] | |||||||
| Na | 0.14 | … | 0.25 | … | 0.03 | |||
| Mg | 0.00 | … | 0.04 | … | 0.03 | |||
| Si | 0.00 | 0.06 | 0.00 | 0.05 | 0.05 | |||
| Ca | 0.03 | 0.03 | 0.09 | 0.08 | 0.03 | |||
| Sc | 0.00 | 0.02 | 0.01 | 0.07 | 0.06 | |||
| Ti | 0.01 | 0.04 | 0.19 | 0.14 | 0.06 | |||
| V | 0.02 | 0.05 | 0.21 | 0.09 | 0.07 | |||
| Cr | 0.00 | 0.06 | 0.06 | 0.09 | 0.06 | |||
| Mn | 0.07 | 0.01 | 0.19 | 0.06 | 0.04 | |||
| Co | 0.00 | 0.06 | 0.06 | 0.07 | 0.07 | |||
| Ni | 0.10 | 0.07 | 0.11 | 0.05 | 0.04 | |||
| Cu | 0.10 | … | 0.10 | … | 0.04 | |||
| Y | 0.09 | 0.05 | 0.09 | 0.08 | 0.07 | |||
| Ba | 0.13 | 0.05 | 0.16 | 0.08 | 0.06 | |||
4 Abundance pattern
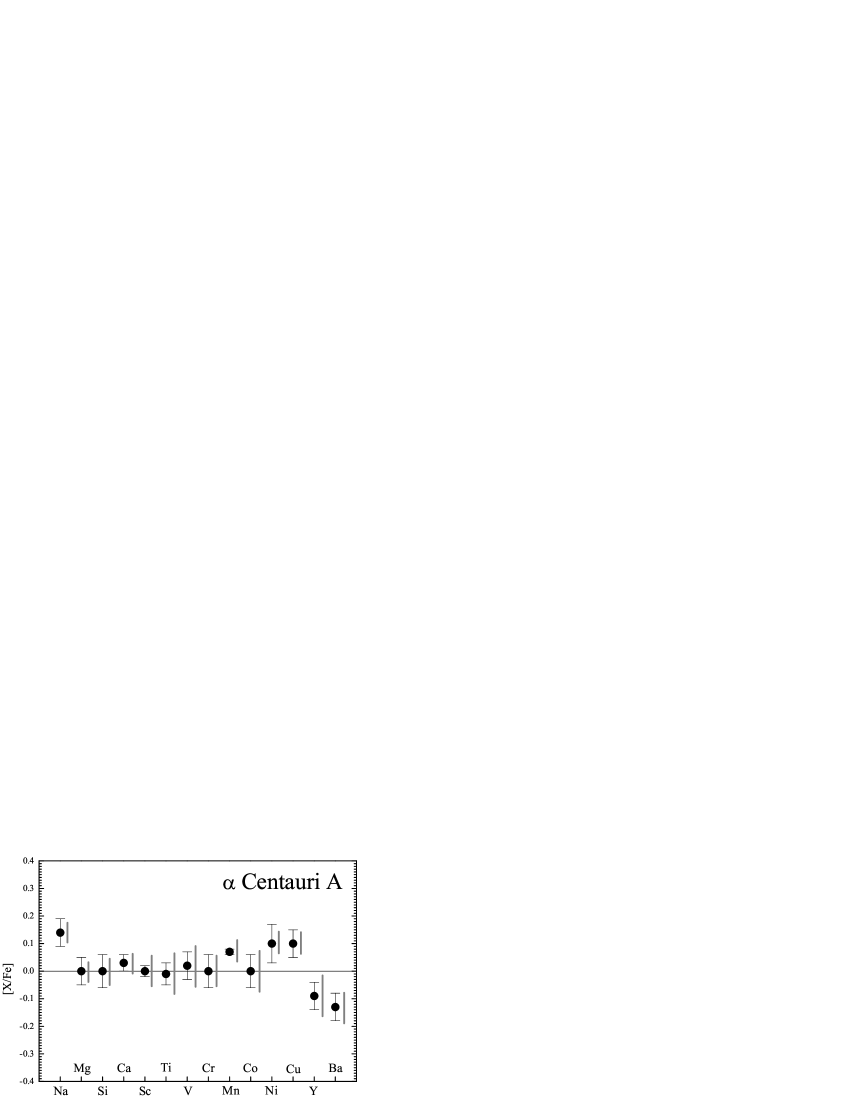
The abundances of the other elements were obtained with the adopted atmospheric model of each star, corresponding to the spectroscopic s, and the log g, Fe/H and values as given in Table 3. Average abundances were calculated by the straight mean of the individual line abundances. For Sc, Ti and Cr, good agreement, within the errors, was obtained for the abundances of the neutral and singly ionized species, and thus these species confirm the Fe i/Fe ii ionization equilibria. The results are plotted in Fig. 7 as [X/Fe] relative to the Sun. In this figure the error bars are merely the internal dispersion of the individual line abundances. For Na i, Mg i, Cu i and Ba ii, the dispersions refer to the difference between the abundances of the two available lines for each element. There is a very good consistency between the abundance patterns of the two stars, but for the the Ti i and V i abundances. The larger error bars for Cen B, however, lead us to consider the two abundance patterns as consistent with each other.
In Fig. 7, the vertical dark grey bars besides the data points of the abundance pattern of Cen A are the composed r.m.s. uncertainties, for each element, calculated by varying the spectroscopic atmospheric parameters of Cen A by the corresponding uncertainties of Table 3. To this calculation we added the abundance variations caused by summing to all s the 2.9 mÅ uncertainty of the correction of Fig 2. This uncertainty enters twice: once for the uncertainty in the corrected moon s, reflecting onto the solar log s, and another one due to stellar themselves. In Fig 7, it is apparent that the abundance variations due to the uncertainties in the atmospheric parameters and s are comparable to the observed dispersions of the line abundances for Cen A. For Cen B, the line abundance dispersions are generally larger, probably due to its more uncertain s, but also, as discussed above, possibly owing to its larger difference from the standard object (the Sun) and its more uncertain atmospheric parameters.
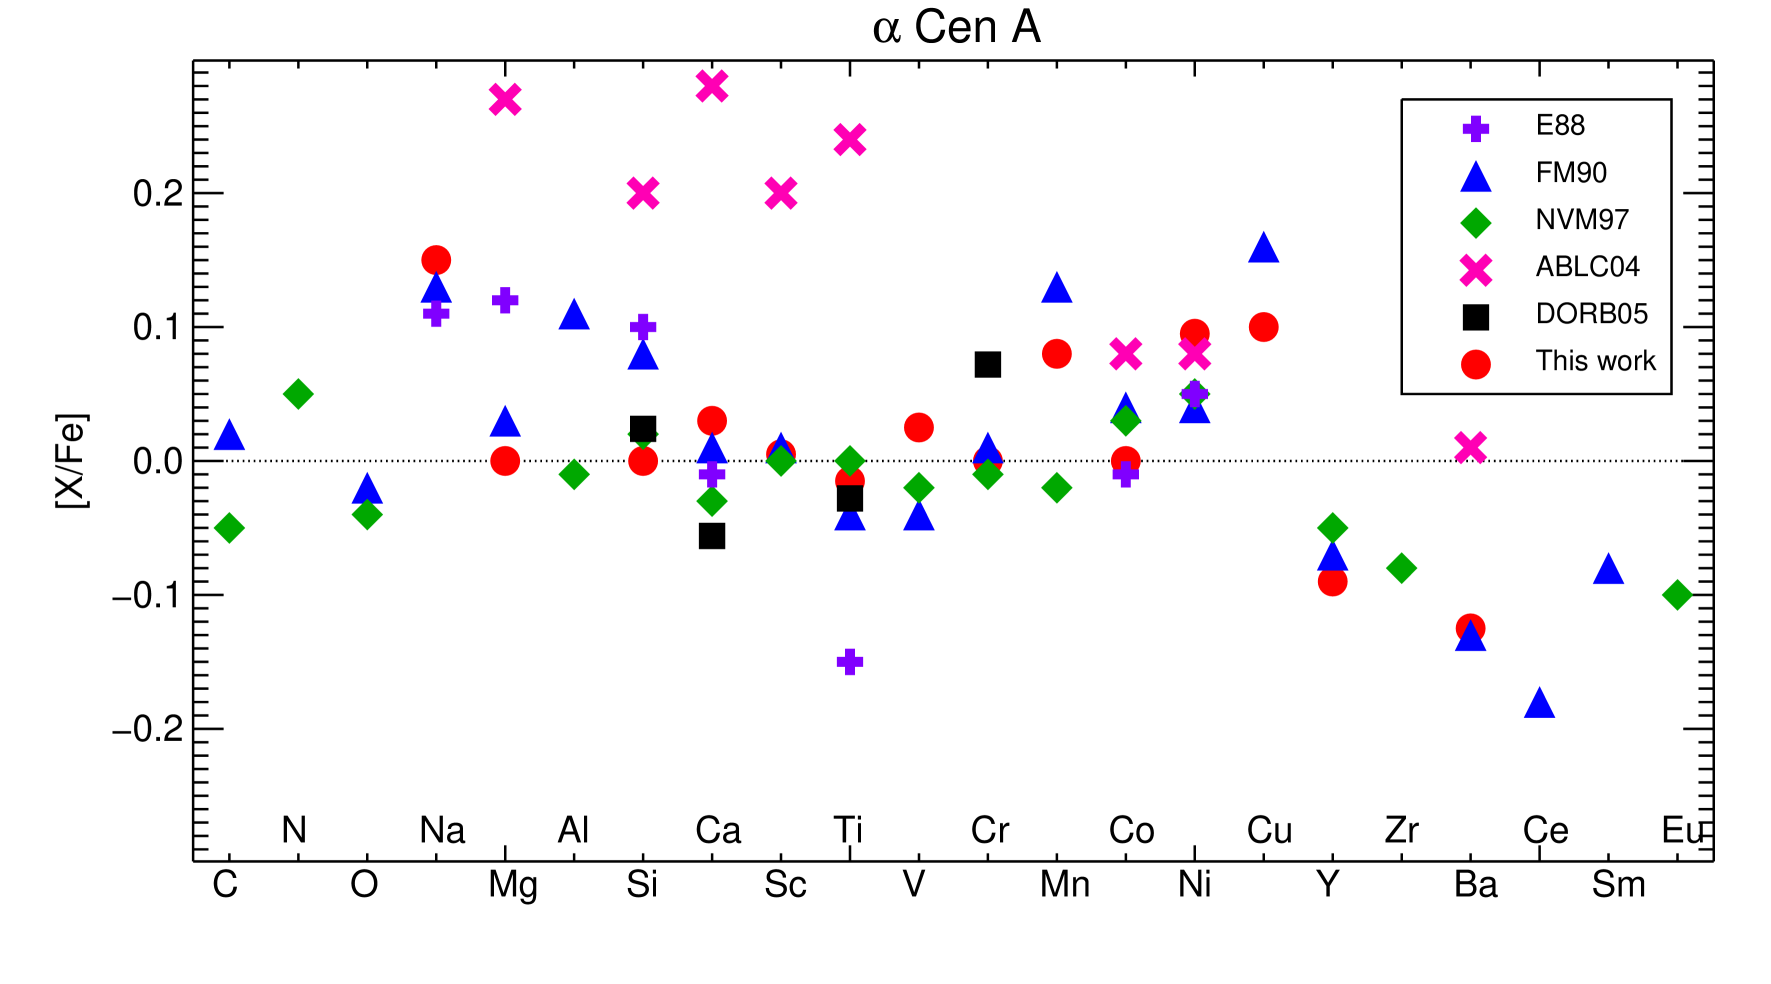
Our abundance pattern for Cen A is clearly the most reliable of the pair, and is directly compared to those of other authors in Fig 8. Only abundances represented by more than one spectral line are shown. The observed dispersion is comparable to the uncertainties normally quoted in spectroscopic analyses. Only for the light elements between Mg and Ti is a larger disagreement observed, in this case due to the analysis of ABLC04, in which abundances are higher than in the bulk of other data by 0.2 dex. For the elements heavier than V, essentially all data agree that V and Cr have normal abundance ratios, that Mn, Co, Ni and Cu are enhanced, and all heavy elements from Y to Eu are deficient in the abundance pattern of Cen A with respect to the Sun, with the sole exception of Ba, for which ABLC04 found a normal abundance. The available literature data also suggests that the C, N and O abundance ratios of Cen A are solar.
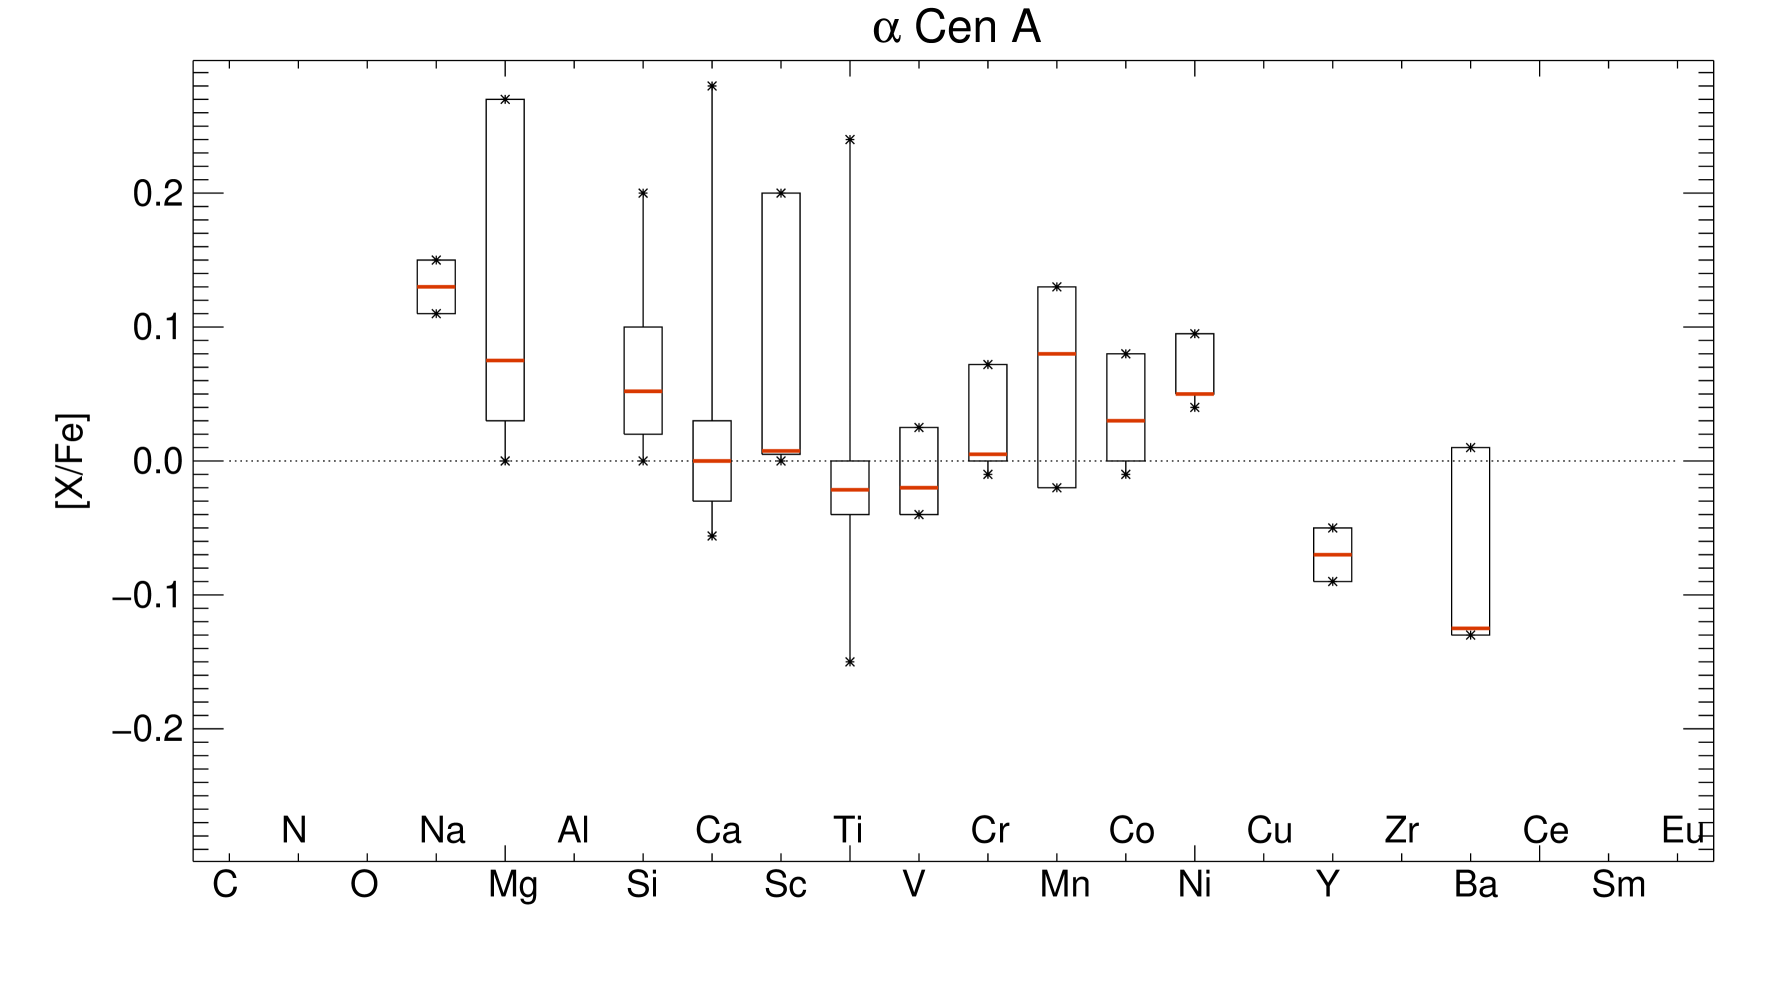
This statistical analysis can be extended if we regard only the elements for which at least three independent studies provided data. This is shown in Fig 9, for a more select sample of elements. We may conclude, with somewhat greater robustness, considering the number of abundance results, that Na, Mg, Si, Mn, Co and Ni are over-abundant; that Ca, Sc, Ti, V and Cr have solar abundance ratios; and that Y and Ba are over-deficient in the abundance pattern of Cen with respect to the Sun.
The high metallicity of the Cen system, and its space velocity components (U,V,W)(km.s-1) = (-24, +10, +8) (Porto de Mello et al. 2006, all with respect to the Sun) place it unambiguously as a thin disk star. We next analyze its abundance ratios, for the elements with more reliable data, as compared to recent literature results for metal-rich stars. Bensby et al. (2003, hereafter BFL) analysed 66 stars belonging to the thin and thick disks of the Milky Way, deriving abundances of Na, Mg, Al, Si, Ca, Ti, Cr, Fe, Ni and Zn. Bodaghee et al. (2003, hereafter BSIM) analysed a sample of 119 stars, of which 77 are known to harbor planetary companions, deriving abundances of Si, Ca, Sc, Ti, V, Cr, Mn, Fe, Co and Ni. The data of the latter study comes from the Geneva observatory planet-search campaign (e.g., Santos et al. 2005). Since they concluded that planet-bearing stars merely represent the high metallicity extension of the abundance distribution of nearby stars, their full sample can be used to adequately represent the abundance ratios of metal rich stars, without distinction to the presence or absence of low mass companions. These two works have in common the important fact that they sample well the metallicity interval 0.20 Fe/H 0.40, an essential feature for our aim.
The elements in common between the two abundance sets are Si, Ca, Ti, Cr and Ni. It can be concluded (Fig. 13 of BFL, Fig. 2 of BSIM) that, in Fe/H 0.20 stars, Ca is under-abundant, Ti is normal and Ni is enhanced. For Si, BFL suggest abundance ratios higher than solar, while BSIM found a normal abundance. For Cr, the data of BSIM suggests abundance ratios lower than solar, while BFL found solar ratios. For the elements not in common in the two studies, Na, Mg, Al, Sc, V, Mn and Co are found to be enhanced in Fe/H 0.20 stars, while Zn has normal abundance ratios.
An interesting feature of the Cen abundance pattern is the under-abundance in the elements heavier than Y, which could be reliably established for Y and Ba (Fig 9). This result is confirmed by Bensby et al. (2005), who found both for Y and Ba lower than solar abundance ratios for metal rich thin disk stars. Another interesting feature, the excess of Cu (found by us and FM90), can be checked with the recent results of Ecuvillon et al. (2004), who also obtain for Fe/H 0.20 stars an average Cu/Fe 0.1 dex.
Merging our evaluation of the abundance pattern of Cen A, from the available independent analyses, with the previous discussion, we conclude that Cen A is a normal metal-rich star in its Na, Mg, Si, Ti, V, Cr, Mn, Co and Ni abundances. The result for Ca is inconclusive, and only for Sc does its abundance diverge from the BFL/BSIM data, in that its normal abundance ratio contrasts with the overabundance found for Fe/H 0.20 stars by BSIM. It seems reasonably well established then that the Cen system is composed of two normal metal rich stars when regarded in the local disk population.
5 Evolutionary state
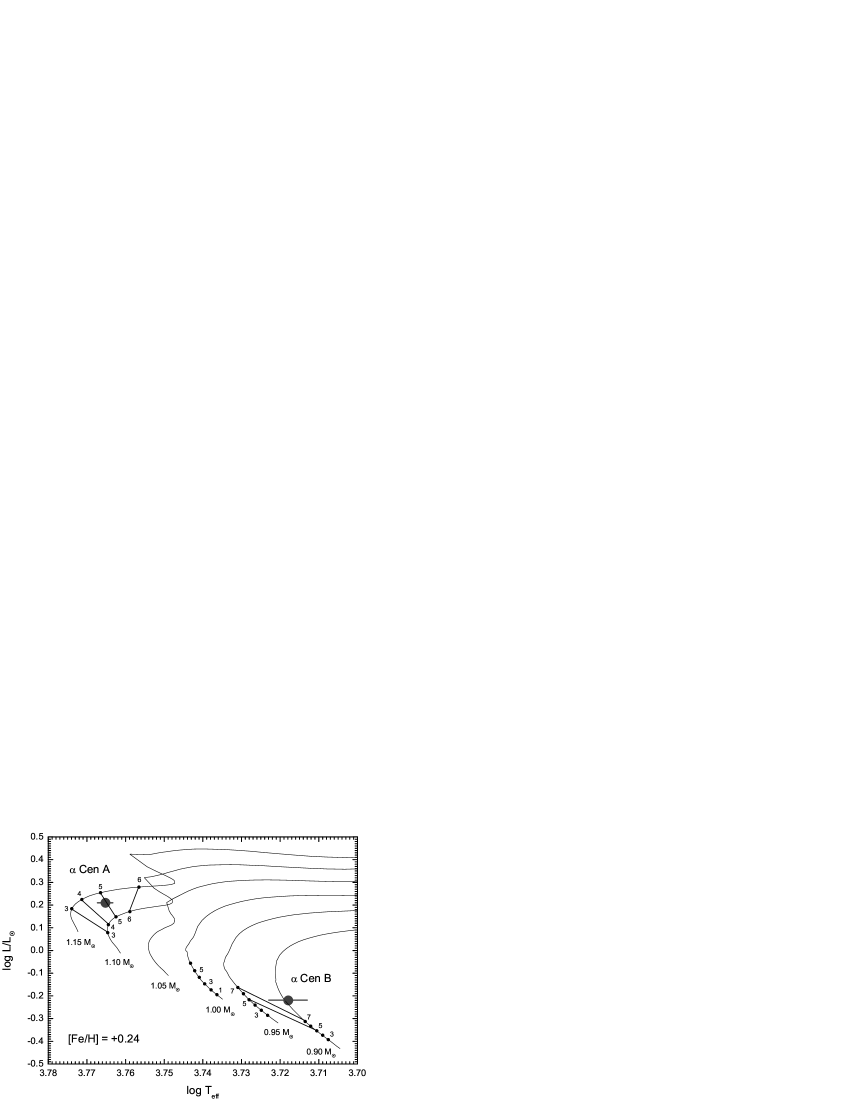
An important outcome of the present analysis is to establish if the derived atmospheric parameters, coupled to high-quality parallaxes, allow a consistent determination of the masses and ages of the Cen system in a traditional HR diagram analysis, matching the stringent constraints posed by the orbital solution and seismological data. In Fig. 10 we plot the position of the Cen components in the theoretical HR diagram of Kim et al. (2002) and Yi et al. (2003), corresponding to its exact metallicity and a solar abundance pattern. The bolometric corrections were taken from Flower (1996), and in calculating the luminosities the Hipparcos (ESA 1997) parallaxes and visual magnitudes were used. Evolutionary tracks and isochrones from different authors (e.g., Girardi et al 2000, Charbonnel et al. 1999, Schaller et al. 1992) were also tested, and good agreement between the different tracks was found, to better than 50 K, for the position of both Cen components. This is an expected result, given that the Sun is generally used to calibrate these models. The solar mass, radius and age provides a zero point to the models and allow a solution as a function of the adopted mixing-length of the convection theory (still a free parameter) and the initial helium abundance. Thus, differences between the models can be substantial in the treatment of stars which are very different from the Sun (e.g., Lyra et al. 2006), but good agreement for solar-type stars is a natural outcome of this procedure. The conclusions drawn below, then, are essentially model-independent, at least for the and luminosity intervals involved here.
The values and error bars in the diagram are those of the weighted mean of table 3. From the diagram, masses of MA = 1.13 0.01 and MB = 0.89 0.03 can be derived, and agree well with the orbital solution of Pourbaix et al. (2002). The age of Cen A can be relatively well constrained to the interval of 4.5 to 5.3 Gyr (1), again, in good agreement with the seismological results of Yıldız (2007), Eggenberger et al. (2004), Miglio & Montalbán (2005) and Thoul et al. (2003), within the quoted uncertainties. We conclude that, adopting the average s and [Fe/H] found in this work, the position of Cen A in up-to-date theoretical HR diagrams can be reconciled both with seismological and dynamical data. Despite its higher mass and its being (probably) older than the Sun, the higher metallicity slows the evolution to the point that the star has not yet reached the “hook” zone of the HR diagram, thus enabling a unique age solution through this type of analysis.
Concerning Cen B, it is also apparent in Fig 10 that its position cannot be reconciled, within 1, with an age near 5 Gyr, as was possible for Cen A. However, an upward revision of only 60 K would bring its position in agreement with a track of 0.93 solar mass (the dynamical value), and an age of 5-8 Gyr. Given the uncertainties discussed in section 3, along with the probable effect of systematic errors in the determination of Cen B, this is not outside the 2 confidence interval of the results. We conclude that Cen A has its position in the theoretical HR diagram well matched by up-to-date models, within the uncertainties of the determination of its atmospheric parameters, and also within the small differences, in this and luminosity regime, between different grids of evolutionary models. Cen B, in its turn, has been shown to suffer from a larger uncertainty in its , precluding a more stringent assessment of a match between its evolutionary mass and age and the results from the dynamical solution and asteroseismology. Further data are still necessary to allow a more definitive conclusion on this issue. If indeed its spectroscopic is systematically offset, the mean we derived would decrease and displace its position on the HR diagram to the right, forestalling a match with the age of Cen A. For a better understanding of the onset of possible NLTE effects in cool stars, and the hindrance thus incurred in the determination of their atmospheric parameters, it would be interesting to perform further analyses of such objects, for which high-quality spectra could be secured, and the relevant observational constraints made at least partially available. Interesting bright, nearby K-dwarf candidates for such an enterprise are Eri, 36 and 70 Oph, o2 Eri and Dra.
6 Conclusions
We have undertaken a new detailed spectroscopic analysis of the two components of the Centauri binary system, and have attempted an appraisal of the many discordant determinations of its atmospheric parameters and abundance pattern, and of the sources of errors in their determination. We derived purely spectroscopic atmospheric parameters, from R = 35 000 and S/N 1 000 spectra, in a strictly differential analysis with the Sun as the standard. We obtained A = 5847 27 K and B = 5316 28 K from the spectroscopic analysis, and A = 5824 26 K and B = 5223 62 K from the average of spectroscopic, H and photometric s). We derived Fe/H = 0.24 0.03 dex for the system. The spectroscopic surface gravities, log g A = 4.34 0.12 and log g B = 4.44 0.15, are a good match to those determined from directly measured masses and radii. Good agreement, in both components, is found between the photometric and the one resulting from the fitting of the wings of H. For Cen A, these two s also agree with the spectroscopic one. However, for Cen B, the spectroscopic was found to be significantly higher, by 140 K, than the other two. A comparison of the published s for the system in the last 20 years roughly support a spectroscopic scale hotter than the ones owed to photometric methods or the fitting of Balmer lines.
A comparison with recent results from other techniques revealed an unclear picture. Atmospheric parameters for the Cen stars derived by Valenti & Fisher (2005) by fitting directly synthetic spectra to a large spectral coverage, agree well with our determinations, but for the spectroscopic of Cen B. Their surface gravities and metallicities are also in line with our figures. Frutiger et al. (2005), inverting high-resolution line profiles, found a substantially lower [Fe/H], and their model-dependent s agree either with our spectroscopic or with the photometric/H , depending on assumptions. Their log g for Cen B is also higher than all other recent determinations.
We discuss possible origins of the offset between the scales, concluding that the presence of NLTE effects, and also a possible inconsistency between spectroscopic and photometric scales, are probable explanations. Recent results reporting offsets between spectroscopic and photometric scales in cool stars, of similar magnitude, lend some credence to this interpretation. But we note that some authors claim consistency between the two scales, and that other sources of errors may be at play, such as uncertainties in the absolute flux calibration of photometric s. We also note that recent claims of such offsets as caused by chromospheric activity cannot explain the present discrepancy given that both Cen stars are considerably inactive stars. These discordant data still preclude a clear evaluation of the problem. For both Cen A and B, the spectroscopic surface gravities agree well, within the uncertainties, with direct values derived from the dynamical masses of Pourbaix et al. (2002) and the radii of Kervella et al. (2003). The atmospheric parameters resulting from our analysis are collected in Tab 3.
The abundance pattern of the system, when the various authors’s data are considered for those elements for which at least three independent analyses are available, is found to be enriched in Na, Mg, Si, Mn, Co, Ni and (with less reliability) Cu, and deficient in Y and Ba (Fig 9). This abundance pattern is found to be in very good agreement with recent results on the abundance ratios of metal-rich stars. Thus, the system may be considered as a normal pair of middle-aged, metal-rich, thin disk stars.
An analysis of the evolutionary state of the system in the theoretical tracks of Kim et al. (2002) and Yi et al. (2003) yields a very good agreement of the evolutionary mass (MA = 1.13 0.01) and age (4.5-5.3 Gyr) of Cen A with the results of recent seismological and dynamical data (Fig 10). For Cen B, a 1 upward revision of its would bring its position in the HR diagram within reasonable agreement with the age found for Cen A, and an evolutionary mass (MB 0.93) in good agreement with the dynamical one would result. This merely marginal compatibility suggests that, in order to fulfill the privileged situation of the Cen system as a fundamental calibrator of the modelling of stellar structure and atmosphere models, additional analyses of component B seem to be necessary to quantify the onset and magnitude of possible NLTE in cool stars, as well as allow a more precise evaluation of possible offsets between spectroscopic and photometric scales in this class of objects.
Acknowledgements.
We acknowledge fruitful discussions with Bengt Edvardsson. W. L. and G. R. K. wish to thank CNPq-Brazil for the award of a scholarship. G. F. P. M. acknowledges financial support by CNPq grant n∘ 476909/2006-6, FAPERJ grant n∘ APQ1/26/170.687/2004, and a CAPES post-doctoral fellowship n∘ BEX 4261/07-0. We thank the staff of the OPD/LNA for considerable support in the observing runs necessary for this project. Use was made of the Simbad database, operated at CDS, Strasbourg, France, and of NASA’s Astrophysics Data System Bibliographic Services. Criticism and suggestions from the anonymous referee have considerably improved the manuscript.References
- Abia (1988) Abia, C., Rebolo, R., Beckman, J.E., & Crivellari, L. 1988, A&A, 206, 100
- Allende-Prieto et al. (1998) Allende-Prieto, C., Cobo, B. R., & García-López, R. J. 1998, ApJ, 502, 951
- Allende-Prieto et al. (2004) Allende Prieto, C., Barklem, P.S., Lambert, D.L., & Cunha, K. 2004, A&A, 420, 183 (ABLC04)
- Anosova et al. (1994) Anosova, J., Orlov, V. V., Pavlova, N. A. 1994, A&A, 292, 115
- Barklem et al. (1998) Barklem, P.S., O’Mara, B.J., & Ross, J.E. 1998, A&A, , 100
- Bensby et al. (2003) Bensby, T., Feltzing, & S., Lundström, I. 2003, A&A, 433, 185 (BFL03)
- Bensby et al. (2005) Bensby, T., Feltzing, S., Lundström, I., & Ylyin, I. 2005, A&A, 410, 527
- Bessell (1990) Bessell, M. S. 1990, A&AS, 83, 357
- Bessell (1981) Bessell, M.S. 1981, PASA, 4, 2
- Bodaghee et al. (2003) Bodaghee, A., Santos, N.C., Israelian, G., & Mayor, M., 2003 A&A, 404, 715 (BSIM03)
- Böhm-Vitense (1981) Böhm-Vitense, E. 1981, ARA&A, 19, 295
- Casagrande et al. (2006) Casagrande, L., Portinari, L., Flynn, C. 2006, MNRAS, 373, 13
- Charbonnel et al. (1999) Charbonnel, C., Däppen, W., Schaerer, D., Bernasconi, P.A., Maeder, A., Meynet, G., & Mowlavi, N. 1999, A&AS, 135, 405
- Chmielewski et al., (1992) Chmielewski, Y., Friel, E., Cayrel de Strobel, G., & Bentolila, C. 1992, A&A, 263, 219
- (15) del Peloso, E.F., da Silva, L., & Porto de Mello, G.F. 2005, A&A, 434, 275
- (16) del Peloso, E.F., Cunha, K., da Silva, L., & Porto de Mello, G.F. 2005, A&A, 441, 1149
- Doyle et al. (2005) Doyle, M.T., O’Mara, B.J., Ross, J.E., & Bessell, M.S. 2005, PASA, 22, 6
- Ecuvillon et al. (2004) Ecuvillon, A., Santos, N.C., Mayor, M., Villar, V., & Bihain. G. 2004, A&A, 426, 619
- Edvardsson (1988) Edvardsson, B. 1988, A&A, 190, 148
- Edvardsson et al. (1993) Edvardsson, B., Andersen, J., Gustafsson, B., Lambert, D.L., Nissen, P.E., & Tomkin, J. 1993, A&A, 275, 101
- Eggenberger et al. (2004) Eggenberger, P., Charbonnel, C., Talon, S., Meynet, G., Maeder, A., Carrier, F., & Bourban, G. 2004, A&A, 417, 235
- Endl et al. (2001) Endl, M., Kürster, M., Els, S., Hatzes, A. P. & Cochran, W. D. 2001, A&A, 374, 675
- England (1980) England, M.N. 1980, MNRAS, 191, 23
- ESA (1997) European Space Agency 1997, The Hipparcos Catalogue, Special Publication 120, ESA Publications Division, Nordwijk, The Netherlands.
- Flower (1996) Flower, P.J. 1996, ApJ, 469, 355
- (26) French, V.A., & Powell, A.L.T. 1971, R. Obser. Bull., 173, 63
- Frutiger et al. (2005) Frutiger, C., Solanki, S. K., & Mathys, G. 2005, A&A, 444, 549
- Furenlid & Meylan (1990) Furenlid, I., & Meylan, T 1990, ApJ, 350, 827 (FM90)
- Girardi et al. (2000) Girardi, L., Bressan, A., Bertelli, G., & Chiosi, C. 2000, A&AS, 141, 371
- Gliese & Jahreiss (1991) Gliese, W., & Jahreiss H. 1991, Preliminary Version of the Third Catalogue of Nearby Stars, Astronomisches Rechen-Institut, Heidelberg
- Gratton & Sneden (1987) Gratton, R.G., & Sneden, C. 1987, A&A, 178, 179
- Gray & Johanson (1991) Gray, D. F. & Johanson, H. L. 1991, PASP, 103, 439
- Gray et al (2000) Gray, D. F., Tycner, C., & Brown, K. 2000, PASP, 112, 328
- Grevesse & Noels (1993) Grevesse, N., & Noels, A. 1993, in N. Prantzos, E. Vangioni-Flam and M. Cassé (eds.), Origin and Evolution of the Elements, p. 14, Cambridge Univ. Press, Cambridge.
- (35) Guenther, D. B., & Demarque, P. 2000, ApJ, 531, 503
- Gustafsson et al. (2008) Gustafsson B., Edvardsson, B., Eriksson, K., Joergensen U.G., Nordlund, AA., & Plez, B. 2008, A&A, accepted, arXiv 0805.0554
- Heiter & Luck (2003) Heiter, U. & Luck, R. E. 2003, AJ, 126, 2015
- Holmberg et al. (2006) Holmberg, J. Flynn, C. & Portinari, L. 2006, MNRAS, 367, 449
- Kervella et a. (2003) Kervella, P., Thévenin, F., Ségransan, D., Berthomieu, G., Lopez, B., Morel, P., & Provost, J. 2003, A&A, 404, 1087
- Kim et al. (2002) Kim, Y. C., Demarque, P., 2003, & Yi, S. K. 2002, ApJS, 143, 499.
- Kovtyukh et al. (2003) Kovtyukh, V. V., Soubiran, C., Belik, S. I. & Gorlova, N. I. 2003, A&A, 411, 559
- Kurucz et al. (1984) Kurucz, R. L., Furenlid, I., Brault, J., & Testerman, L. 1984, Solar Flux Atlas from 296 to 1300 nm, National Solar Observatory.
- Lyra et al. (2006) Lyra, W., Moitinho, A., van der Bliek, N., & Alves, J. 2006, A&A, 453, 101
- Lyra & Porto de Mello (2005) Lyra, W., & Porto de Mello, G. F. 2005, A&A, 431, 329
- Masana et al. (2006) Masana, E., Jordi, C., Ribas, I. 2006, A&A, 450, 753
- Meylan et al. (1993) Meylan, T., Furenlid, I., Wigss, M. S., & Kurucz, R. L. 1993, ApJS,85, 163
- Miglio & Montalbán (2005) Miglio, A., & Montalbán, J. 2005, A&A, 441, 615
- Moore et al. (1996) Moore, C. E., Minnaert, M. M., Houtgast, J. 1996, The Solar Spectrum from 2935 Åto 8770 Å, Nat. Bur. Std., U.S. Monograph 61.
- Morel et al. (2004) Morel, T., & Micela, G. 2004, A&A, 423, 677
- Neuforge-Verheecke & Magain (1997) Neuforge-Verheecke, C., & Magain, P. 1990, A&A, 328, 261
- Porto de Mello et al. (2006) Porto de Mello, G., del Peloso, E. F., & Ghezzi, L., 2006, AsBio, 6, 308
- Pourbaix et al. (1999) Pourbaix, D., Neuforge-Verheecke, C., Noels, A. 1999, A&A, 344, 172
- Pourbaix et al. (2002) Pourbaix, D., Nidever, D., McCarthy, C., Butler, R. P., Tinney, C. G., Marcy, G. W., Jones, H. R. A., Penny, A. J., Carter, B. D., Bouchy, F., Pepe, F., Hearnshaw, J. B., Skuljan, J., Ramm, D., & Kent, D. 2002, A&A, 386, 280
- Ramírez & Melendez (2004) Ramírez, I. & Melendez, J. 2004, A&A, 609, 417
- (55) Ramírez, I., & Meléndez, J. 2005a, ApJ, 626, 446
- (56) Ramírez, I., & Meléndez, J. 2005b, ApJ, 626, 465
- Ramírez et al. (2007) Ramírez, I., Allende-Prieto, C., Lambert, D. L. 2007, A&A, 465, 271
- Santos et al. (2004) Santos, N. C., Israelian, G., & Mayor, M. 2004, A&A, 415, 1153
- Santos et al. (2005) Santos, N. C., Israelian, G., Mayor, M., Bento, J. P., Almeida, P. C., Sousa, S. G., & Ecuvillon, A. 2005, A&A, 437, 1127
- Schaller et al. (1992) Schaller, G., Schaerer, D., Meynet, G., & Maeder, A. 1992, A&AS, 96, 269
- (61) Schuler, S. C., King, J. R., Terndrup, D. M., Pinsonneault, M. H., Murray, N. & Hobbs, L. M. 2006, ApJ, 636, 432
- (62) Schuler, S. C., Hatzes, A. P., King, J. R., Kürster, M. & The, L.-S. 2006, AJ, 131, 1057
- Shchukina & Trujillo-Bueno (2001) Shchukina, N. & Trujillo-Bueno, J. 2001, ApJ, 550, 970
- Smith et al. (1986) Smith, G., Edvardsson, B., & Frisk, U. 1986, A&A, 165, 126
- Soderblom (1986) Soderblom, D. R. 1986, A&A, 158, 273
- Spite (1967) Spite, M. 1967, Ann. Astrophys., 30, 211
- Steffen (1985) Steffen, M. 1985, A&AS, 59, 403
- Thoul et al (2003) Thoul, A., Scuflaire, R., Noels, A., Vatovez, B., Briquet, M., Dupret, M.-A., & Montalban, J. 2003, A&A, 402, 293
- Wertheimer & Laughlin (2006) Wertheimer, J. G., & Laughlin, G. 2006, AJ, 132, 1995
- Valenti & Fischer (2005) Valenti, J. A. & Fischer, D. A. 2005, ApJS, 159, 141
- Yi et al. (2003) Yi, S. K., Kim, Y. C., & Demarque, P. 2003, ApJS, 144, 259
- Yildiz (2007) Yıldız, M. 2007, MNRAS, 374, 264
- Yong et al. (2004) Yong, D., Lambert, D. L., Allende Prieto, C., & Paulson, D. B. 2004, ApJ, 603, 697