11email: rkari@iiap.res.in 22institutetext: Max-Planck-Institut für Aeronomie, D-37191 Katlenburg-Lindau, Germany
Detection of mesogranulation at the upper chromosphere from SOHO/SUMER observations
Abstract
Aims. Our aim is to detect the mesogranulation structures at the upper solar chromosphere
Methods. We have analyzed a time series of spectra in the hydrogen Lyman lines and the Lyman continuum obtained by the Solar Ultraviolet Measurements of Emitted Radiation (SUMER) spectrometer on the SOlar Heliospheric Observatory (SOHO). The time series of about 2 hours and 22 minutes was obtained on 1999 March 9 in a quiet region near the center of the solar disk. For our analysis, we have selected a Lyman continuum window around 907 Å, and the five Lyman lines: Ly5 (937.8 Å), Ly7 (926.2 Å), Ly9 (920.9 Å), Ly11 (918.1 Å), and Ly15 (915.3 Å). A Fast Fourier analysis has been performed in the spatial domain, all along the slit length used, for all the spectra and for the total duration of the observations.
Results. We have detected a significant periodic spatial variations with Fourier transform power peaks around 9-10 arcsec and at 4 arcsec. They correspond to the scale of the mesogranulation structure and the width of the supergranular boundary, respectively. For the first time, this provides evidence for the existence of a meso-scale in the upper chromosphere, of the same size as observed in the photosphere and lower chromosphere by earlier studies. We find from the analysis that there seems to be no signature of any temporal evolution associated with the mesogranules, at least not during our observing period. This result suggests that the life time of mesogranules will be several hours or more, which confirms the earlier findings. In addition, we notice that the size (9-10 arcsec) of the mesocells appears to be the same in all Lyman lines and in the continuum, which are formed at different depths in the chromosphere.
Key Words.:
Sun: upper chromosphere - Sun: quiet region - Sun: mesogranulation - Sun: Lyman lines1 Introduction
It is well known that there is evidence for at least three scales of motion in the solar photosphere: granulation, mesogranulation, and supergranulation. The solar surface is subject to convective and oscillatory motions, the properties of which are fundamental to understanding the physics of solar surface evolution. One of the striking properties of the observed convective motions on the Sun is the discrete spectrum of their horizontal scales. Granules have scales of order 1 arcsec, the mesogranules of order 8 arcsec, and supergranules of order 40 arcsec. Granulation has been the subject of studies for more than a century, and its structure, physical properties, the life time, and evolution are rather well known both from observational work and numerical models, except at the smallest spatial scales below 0.2”, which are at present unaccessible by both ground-based and space-borne solar telescopes.
Simon & Leighton (1964) have discovered the supergranulation as a large-scale convective pattern, but the question of just what determines its dominant horizontal scale remains open. Muller et al. (1992) have studied the evolution of solar mesogranules, which seem to survive for at least 3 hours. In a recent paper, Roudier et al. (1998) find the lifetimes for mesogranules will be ranging from 16 to 185 min. November et al. (1981) suggested that mesogranulation could come from He0 ionization at a depth of 7 Mm, as the ”missing” scale in the scenario of the solar convective motions (in between the granulation arising from the H0 ionization instability region at 2 Mm depth, and the supergranulation from the ionization of He+ at 20 Mm). From the studies using simultaneous observations of the granular flows (SOUP instrument on board SPACELAB 2) and the magnetic field (Big Bear Observatory), Simon et al. (1988) raise the question ”whether the mesogranule is really a scale of solar convection distinct from the supergranulation”. There is still disagreement on the nature of the mesogranulation: whether it represents waves (Damé 1985, Straus & Bonaccini, 1997) or convection (e.g., Deubner 1989; Straus, Deubner, & Fleck 1992); whether it is a distinct spatial regime (Title et al. 1986; Simon et al. 1988, Ginet and Simon 1992) or cannot be identified as regime separated from granulation (Straus et al. 1992, Straus & Bonaccini 1997). Therefore, all these issues need to be better understood and related to the observed properties of the mesogranulation, particularly from a long-time sequence of simultaneous observations in many spectral lines.
The overshooting of convective motions into the solar photosphere, chromosphere, and transition region may provide a direct coupling between the atmosphere and the vigorous turbulence below the surface. Following the observation and a first attempt of interpretation of the mesogranulation by November et al. (1981), several related observations were carried out using different techniques either through intensity measurements (Koutchmy & Lebecq 1986), statistical studies of active granules grouping (Oda 1984), or by measurements of granular flows (November et al. 1987). Recently, Hirzberger et al. (1999) have studied a time series of white-light images of 80-minute duration and have shown that the dynamics of exploding granules is strongly affected by their surroundings and that their appearance is closely related to the mesogranular flow field. Martic, Damé, & Kariyappa (2000, in preparation) have analyzed the solar ultraviolet filtergrams obtained during the fourth rocket flight of the Transition Region Camera (TRC) of 1985 October 25, and have derived a mesogranulation pattern with a size of 8 Mm in the temperature minimum region. From different observations in [ Ca ii] H & K lines (Damé & Martic 1987, 1988; Kariyappa, Sivaraman, & Anadaram 1994) the meso-scale phenomenon was identified in the lower chromosphere.
In this paper, we attempt to detect the meso-scale structure in the upper chromosphere using a long-time sequence of spectra obtained with the SOHO/SUMER spectrometer in five Lyman lines and the continuum. They have simultaneously been observed near the center of the solar disk in a quiet region.
2 Observations and methods of data analysis
SUMER is a stigmatic, high-resolution normal-incidence spectrometer that covers the wavelength range between 400 and 1610 Å. With a spatial resolution close to 1 arcsec and spectral pixels of 43 mÅ(with subpixel resolution), it provides a unique opportunity to observe the whole hydrogen Lyman series plus the Lyman continuum. The SUMER capabilities are described in detail by Wilhelm et al. (1995), the in-flight performance is presented in Wilhelm et al. (1997) and Lemaire et al. (1997), and specific aspects related to the Lyman series spectra by Curdt & Heinzel (1998), Heinzel & Curdt (1999), Curdt et al. (1999) and Kariyappa, et al. (2001).
In this paper, we have analyzed the data set observed on 1999 March 9. We used the 1” 120” slit. We have obtained a set of 306 spectra with a repetition rate of about 27.72 s. A few extra seconds were required for the solar rotation tracking, using a special, so-called half-step solar rotation compensation scheme (cf., Curdt & Heinzel 1998). The whole sequence thus lasted for 8480 s ( 2 hours and 22 minutes). The slit has crossed two network cells with less brightness, a very bright network boundary lane and finally ends with a weak network lane on the southern part of the slit. In between these network regions, there are internetwork regions with oscillatory nature. The spectra were acquired by the detector A on its central band of 120 spatial x 1024 spectral pixels. This covered the wavelength band from 903 to 943 Å, including all Lyman lines from Ly5 up to the series limit, plus a portion of the Lyman continuum. This is shown in Figure 2 of Curdt and Heinzel (1998). We have selected five hydrogen Lyman lines: Ly5 (937.8 Å), Ly7 (926.2 Å), Ly9 (920.9 Å), Ly11 (918.1 Å) and Ly15 (915.3 Å), and a Lyman continuum window around 907 Å for the detailed study. For detailed line identifications see Curdt et al. (1997) and Curdt & Heinzel (1998).
The data set has been decompressed, flat-field corrected, and corrected for the geometrical distortion of the detector. We have performed a spatial Fourier analysis all along the slit length (120 arcsec) for all the Lyman lines and the continuum, and at every time interval for the duration of our observations to determine the periodicity in the spatial scale.
3 Results and discussions
3.1 Oscillatory behavior in bright network and internetwork regions
It is evident from the data set of 1999 March 9 that there are significant temporal variations of the intensities and shapes of all Lyman lines observed. We have derived the central intensity values for all the line profiles after calculating the center of gravity of the average profiles of these lines and applying a smooth–3 noise filter using all 306 spectra.
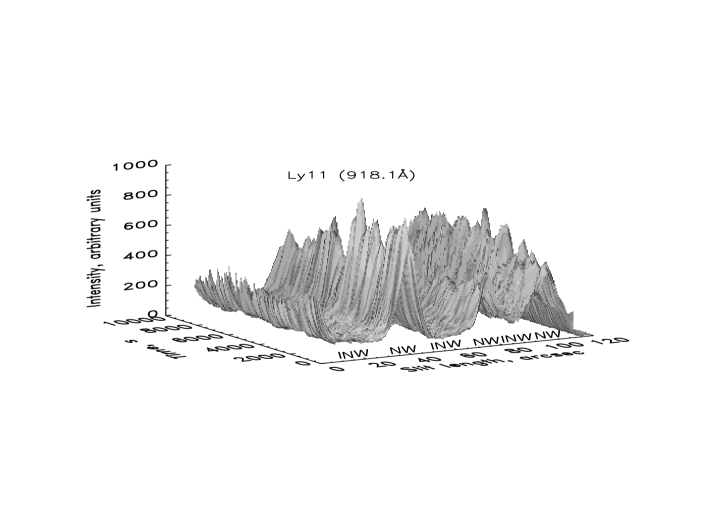

In Figure 1, we have shown a 3-D plot of the central intensity versus time and distance along the slit for the Ly11 (918.1 Å) line. It can be seen that the slit crosses three network lanes, which we have marked as NW, one of them is very bright at a pixel position around 40 and other two are less bright (at pixel positions roughly around 72 and 97). In between the network lanes, we see features of the internetwork oscillatory grains (around pixel positions : 10-20, 50-60, and 84), which we marked as INW. We can see from the 3D-plot that internetwork (INW) regions will show an oscillatory behavior of periodicity around 3-min, which one can derive by counting the number of intensity peaks over the observed time period. In a similar way, the network regions show 5-7 min. periodicity in their intensity oscillations. The 3-min in internetwork and 7-min in network regions have been reported earlier by Curdt & Heinzel (1998) and Kariyappa et al. (2001) from an analysis of a long time series spectra of hydrogen Lyman lines obtained with the SOHO/SUMER experiment. A large number of people have reported similar results from [ Ca ii] H & K lines ( e.g., Liu 1974; Cram & Damé 1983; Lites, Rutten, & Kalkofen 1993; Kariyappa et al. 1994; Kariyappa 1994, 1996). It is important to note that the emission profiles of the optically thick Lyman lines span relatively large atmospheric depths (see, e.g., Fig.1 in Vernazza, Avrett, & Loeser 1981) and, therefore, in oscillation studies one should better use the line-center intensities rather than the integrated emission, which would allow intensity variations to mix waves from different depths. More details on (i) the chromospheric oscillations in bright network and internetwork regions, (ii) the phase shift and wave properties, and (iii) the heating of the higher chromosphere at the sites of the network and internetwork regions, are not discussed here, since the theme of the present paper is the detection of mesocells at the upper chromosphere.
3.2 Detection of mesogranulation
We have derived the spatial power spectrum plots along the slit for a given time of observation. For example, in Figures 2 and 3, we have shown the spatial power spectrum plots for all the Lyman lines and continuum for the time intervals of around 2000 s and 4000 s, respectively. The spatial power spectrum plots show two significant power peaks. The first peak is around 9-10 arcsec, which is in consistent with the scale of mesogranulation observed in the photosphere from SOUP observations (November et al. 1981), in the temperature minimum region from TRC ultraviolet filtergrams (Martic et al. 2000, in preparation), as well as in the lower chromosphere from [ Ca ii] H & K lines (Damé & Martic 1987, 1988, Kariyappa et al. 1994), and the second peak is seen at 4 arcsec, which may be related to the width of the supergranular boundary. In addition to these two peaks, we find the smaller amplitude peaks at higher spatial periods. They may be related to the sizes of the supergranular cells. We have looked for potential instrumental effects that could create periodic signals in the spatial domain, and have analyzed the detector non-uniform response, often referred to as flatfield. The micro-channel-plate of the detector has more or less regular geometrical structures which lead to variations of the effective size of the pixels. The corresponding effect on the detector responsivity, which is been taken care of by the flatfield matrix revealed a clear peak near pixel 26, but no prominent peak at higher frequencies. This excludes that residual effects of the flatfield correction could possibly be responsible for the signals we have revealed and demonstrates their solar nature. Therefore, we conclude that the maximum around 9-10 arcsec corresponds to mesogranulation. This result from SUMER observations of higher hydrogen Lyman lines is new and suggests a mesogranulation structure in the upper chromosphere. After carefully examining the power peak values, it is interesting to mention that the size of the mesocells will be the same in all the Lyman lines including continuum, which are formed at different depths in the chromosphere. We can remark that further up in the atmosphere this 9-10 arcsec dimension will keep the same spatial extent and even up to the transition zone (Dere, Bartoe, & Brueckner 1986), where only a slight increase (11 arcsec) in dimension. The mesogranulation structure has been seen all along in the photosphere, temperature minimum region, in the lower and upper chromosphere, and this result suggests that there may be an overshooting of convective motions from layers below.

The observed periodical brightenings on a meso-scale spatial extent above the granulation certainly gives us an additional information on the processes governing the structures in that region of the solar atmosphere. The relationship between the time evolution and periodical brightenings of the mesogranulation has to be confirmed with still a longer duration of observations. We have checked the spatial power spectrum taken for all the lines randomly in time for the entire duration of our observations. We find that the size of the mesocells will appears to be the same in all the spectral lines and at the continuum. The amplitude of the power peak will remain the same for a given line and time during our observations. Except that we will see a slightly larger amplitude in the power peaks in the case of Lyman continuum ( at 907.0 Å) and Ly15 (915.3 Å) line compared to the rest of other lines, and these two are formed rather in the lower atmosphere. From this result, we can infer that the life time of the mesogranules will be more than several hours or more. This is in good agreement with the findings reported by Muller et al. (1992). However, in order to check: (i) Whether we could see another mesocell at the previous location or not; (ii) Whether it is changing with time and different positions over the solar disk, we need to investigate further with the new observations. The related research is in progress. Since the life time of the mesocells seems to be more than 3 hours, our present time sequence of observation is too short to comment on the temporal evolution of the mesogranulation structures.
Acknowledgements.
The SUMER project is financially supported by DLR, CNES, NASA, and the ESA PRODEX Programme (Swiss Contribution). SUMER is part of SOHO, the SOlar and Heliospheric Observatory, of ESA and NASA. We highly appreciate Dr. Luc Damé’s stimulating discussion on this research. We wish to thank Dr. Klaus Wilhelm for critical comments and suggestions, which helped to improve the manuscript.References
- (1) Cram, L.E., & Damé, L. 1983, ApJ, 272, 355
- (2) Curdt, W., et al. 1997, A&AS, 126, 281
- (3) Curdt, W., & Heinzel, P. 1998, ApJ, 503, L95
- (4) Curdt, W., Heinzel, P., Schmidt, W., Tarbell, T., von Uexküll, M., & Wilken, V. 1999, in EPS Conference, ed. A. Wilson, ESA - SP 448, 177
- (5) Damé, L. 1985, in Theoretical Problems in High Resolution Solar Physics, ed. H.U. Schmidt, 244
- (6) Damé, L., & Martic, M. 1987, ApJ, 314, L15
- (7) Damé, L., & Martic, M. 1988, in Advances in Helio- and Asteroseismology, eds. J. Christensen-Dalsgaard and S. Frandsen, IAU Symp. 123, 433
- (8) Dere, K.P., Bartoe, J.-D.F., & Brueckner, G.E. 1986, ApJ, 305, 947
- (9) Deubner, F.-L. 1989, A&A, 216, 259
- (10) Ginet, G.P., & Simon, G.W. 1992, ApJ, 386, 359
- (11) Heinzel, P., & Curdt, W. 1999, in Solar Magnetic Fields and Oscillations, ed. A. Hofmann & J. Staude, ASP Confer. Ser. Vol. 184, 201
- (12) Hirzberger, J., Bonet, J.A., Vázquez, M., & Hanslmeir, A. 1999, ApJ, 527, 405
- (13) Kariyappa, R. 1994, Sol. Phys. 154, 19
- (14) Kariyappa, R. 1996, Sol. Phys. 165, 211
- (15) Kariyappa, R., Sivaraman, K.R., & Anadaram, M.N. 1994, Sol. Phys. 151, 243
- (16) Kariyappa, R., Varghese, B. A. & Curdt, W. 2001, A & A 374, 691
- (17) Koutchmy, S., & Lebecq, C. 1986, A&A, 169, 323
- (18) Lemaire, P., et al. 1997, Sol. Phys., 170, 105
- (19) Lites, B.W., Rutten, R.J., & Kalkofen, W. 1993, ApJ, 414, 345
- (20) Liu, S.Y. 1974, ApJ, 189, 359
- (21) Muller, R., Auffret, H., Roudier, Th., Vignean, J., Simon, G.W., Frank, Z., Shine, R.A., & Title, A.M. 1992, Nature, 356, 322
- (22) November, L.J., Toomre, J., Gebbie, K.B., & Simon, G.W. 1981, ApJ, 245, L23
- (23) November, L.J., Simon, G.W., Tarbell, T.D., Title, A.M., & Ferguson, S.H. 1987, in Proc. Theoretical Problems in High Resolution Solar Physics II, eds. A. Athay & D.S. Spicer, NASA Conf. Publication 2483, 121
- (24) Oda, N. 1984, Sol. Phys., 93, 243
- (25) Roudier, Th., Malherbe, J.M., Vigneau, J., & Pfeiffer, B. 1998, A&A, 330, 1136
- (26) Simon, R.W., & Leighton, R. 1964, ApJ, 140, 1120
- (27) Simon, G.W., Title, A.M., Topka, K.p., Tarbell, T.D., Shine, R.A., Ferguson, S.H., Zirin, H. & the SOUP Team, 1988, ApJ, 327, 964
- (28) Straus Th., Deubner, F.-L., & Fleck, B. 1992, A&A, 256, 652
- (29) Straus Th., & Bonaccini, D. 1997, A&A, 324, 704
- (30) Title, A.M., Tarbell, T.D., Simon, G.W., & the SOUP Team 1986, Adv. Space Research 6(8), 253
- (31) Vernazza, J.E., Avrett, E.H., & Loeser, R. 1981, ApJS, 45, 635
- (32) Wilhelm, K., et al. 1995, Sol. Phys., 162, 189
- (33) ———–. 1997, Sol. Phys., 170, 75