Distinction between sequential and direct three-body decays
Abstract
We discuss the three-body decay mechanisms of many-body resonances. Sequential decays proceed via two-body configurations after emission of the third particle. In direct decay all three particles leave simultaneously their interaction regions. The intermediate paths within the interaction regions are not observables and only accessible through models. The momentum distributions carry, apart from polarization, all possible information about decay modes and resonance structure. In this context we discuss detailed results for the decay of the 9Be() resonance.
pacs:
21.45.-v, 31.15.xj, 25.70.EfIntroduction.
The distinction between different decay mechanisms of a given resonance is a general problem in quantum mechanics dal53 ; ams98 ; gri05 . The properties of the fragments emerging after the decay carry all possible information. A number of accurate and kinematically complete measurements appear these years in the literature for three-body decays gal05 ; bla03 ; fyn03 . The results are often used to interpret the decay as either sequential via an intermediate configuration or direct to the continuum pap07 . Also theoretical models are used to classify the decay mechanisms gar07 ; alv07b but the results of interpretations from different groups of comparable data are not always in agreement with each other gri05 ; pap07 ; des01 . This is unfortunate since a proper classification of the different decay modes is used both in analysis of data and in subsequent applications.
An important question is then to which extent are these disagreements real or only related to different models and choices of basis. A correct understanding is of crucial importance for several reasons, e.g.
(i) The analyses of data are based on an -matrix formalism which intrinsically assumes sequential decay via different intermediate configurations. No other procedure to analyze the data exists. Improvements are in addition at best included to account for symmetries and the interaction between the first emitted particle and the remaining subsystem.
(ii) The intermediate “paths” leading from initial to final states are in quantum mechanics not observables. The measured final state information only relates to the initial state through the filter of intermediate configurations. Initial state information and classifications into decay modes are then necessarily the results of interpretations or model computations. Understanding the underlying physics picture is then necessary for predictions.
(iii) The interpretations are used e.g. to derive the reaction rates for the inverse process of absorption in astrophysical environments. Reliable applications must use the correct rates which may depend on the adopted interpretation of the decay data.
The purpose of the present letter is to investigate the distinct features of different decay modes. We illustrate by comparing computed and experimental results and conflicting interpretations for decay of 9Be().
Procedure.
To describe three-body decay of a many-body resonance we must use a three-body model. Effects of many-body character at short-distances are mocked up by use of a structureless short-range phenomenological three-body potential which also is fine-tuning the resonance energy. The three particles have masses and coordinates , . To compute the resonance wave functions we use the Faddeev equations and the hyperspherical expansion method nie01 combined with complex scaling fed02 . The crucial coordinate is the hyperradius defined as a mass averaged distance, i.e. , where and is an arbitrary normalization mass chosen to be the nucleon mass. The remaining five intrinsic coordinates are dimensionless angles. We apply the transformation for a given scaling angle and compute the adiabatic potentials. When where is the energy and is the width, one of the potentials describes asymptotically this two-body resonance with the third particle far away.
To illustrate we compare measured distributions pap07 and computations for the -resonance of 9Be ( neutron). The two-body interactions reproduce the low-energy and scattering data alv07 ; gar02 . The three-body interaction is used to reproduce the measured resonance energy above the three-particle breakup threshold of MeV keV (excitation energy 2.429 MeV).
Adiabatic potentials.
The real parts of the coupled set of adiabatic potentials are shown in fig. 1. The potential has a pocket at small distance holding the resonance at the measured energy. All the other potentials are repulsive for all distances. The potential becomes the lowest at around fm and approaches the 8Be() resonance energy (dashed line) with a corresponding structure combined with the neutron far away. The two-body resonance energies of 8Be() and 5He() are above the first potential for almost all distances while the energy of 5He() only is above the first potential when is larger than fm. The angles for these three resonances are all larger than .
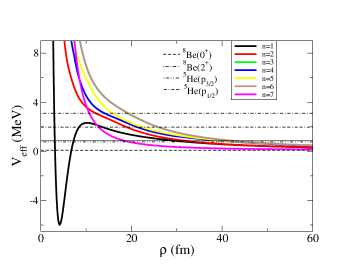
The population of the adiabatic components varies rapidly at small distances where the coupled adiabatic potentials move relative to each other. The couplings, when levels get close, are decisive for the choice between maintaining the structure or following the energetically most favorable path. In the present case about 96% of the wave function at large distance maintains the structure related to the pocket at small distance. About 3% is located in the component related to the ground state structure of 8Be. The relative populations become essentially constant at large distance although the 8Be() description is less accurate.
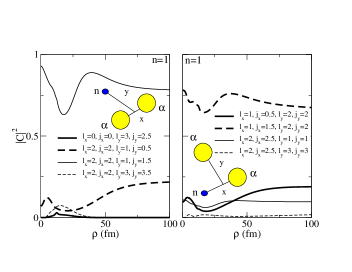
The partial wave decomposition of the dominating component is shown in fig. 2. The angular momentum combinations at large distance are almost entirely the 8Be() structure of between the two -particles coupled to between their center-of-mass and the neutron (fig. 2, left). The same wave function also has the 5He-structure of between the neutron and one -particle coupled to between their center-of-mass and the other -particle (fig. 2, right).
Energy distributions.
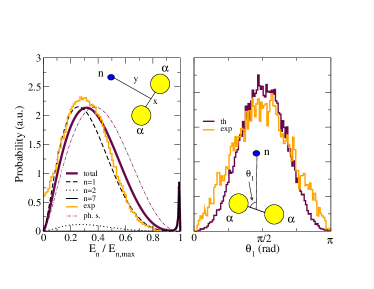
The computed neutron energy distribution (left in fig. 3) almost reproduces the experimental curve, although lies below at small energy and above at high energy. However the data is obviously an overestimate at small energy, and due to the normalization this appears as an underestimate at high energy. The computed small peak at almost maximum neutron energy arises from the potential, corresponding to decay via the ground state of 8Be. Essentially all other parts of the broad and smooth distribution arise from the potential which in no way corresponds to any two-body structures. In fact the distribution solely determined from phase space for the largest angular momentum component in fig. 2 only should be shifted a little to match the computed results. The angular distribution in fig. 3 between the direction of the neutron and the relative momentum of the two -particles also compares favorably with the measurement.
The traditional analysis in terms of tails of broad higher-lying resonances was applied in the recent experimental investigation pap07 where the 8Be() path was claimed to account for about 86% of the decay. This is in agreement with the theoretical computation in des01 but in contrast to gri05 where 8Be() was ignored and the 5He-channel was found to contribute a little on top of a “democratic” () (phase-space determined) decay. In pap07 it is also claimed that the decay via 5He() cannot explain the data as well as the 8Be() channel. This conclusion is based on analysis of the angular distribution while the energy distribution is equally well explained via both channels. This difference can be attributed to the neglect of 5He() which with 5He() is needed to be equivalent to 8Be(), see fig. 2.
Spatial structure
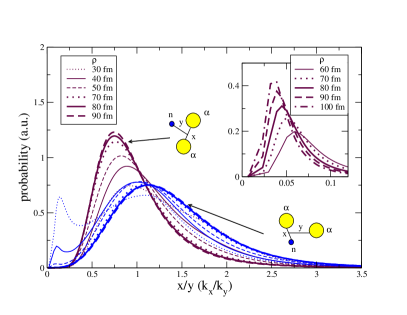
The decaying resonance wave function depends on the relative coordinates of the three particles. The variation describes the dynamical evolution of the substructures from before the barrier, via intermediate configurations to large distances. The structure of the resonance wave function can be seen in fig. 4 where we compare the probability for finding given values of the ratio of the distance between two particles and the distance from their center-of-mass to the third particle.
The peak in the first coordinate system (8Be) stabilizes at around 0.75 for larger than about fm. This means that when the system emerges from underneath the barrier at fm, see fig. 1, the most probable distance between the two -particles is about 18 fm which directly shows that the spatial 8Be-structure is not present. In contrast the peak in the inset moves towards smaller values as increases. This peak arises entirely from the lowest potential at large , see fig. 1, with the two -particles in a relative -structure and a distance of about 3.3 fm independent of . This reflects that 8Be() is populated and the -particles moves apart as for a decaying two-body resonance.
For the small -values, the other coordinate system (5He) reveals a small peak at small values connected to a rather broad distribution for higher ratios. The distance between the neutron and one -particle is about 2.8 fm for this small peak while the distance to the other -particle is about 27 fm. Combined with the partial wave decomposition in fig. 2 this means a small probability for a structure resembling 5He. However, as increases this peak disappears before the couplings between different potentials have vanished. The distribution stabilizes as the broad peak around 1.2 with two -particles each with comparable relative distances to the neutron.
Sequential and direct decays.
The observables are related to the asymptotic large-distance results. We classify the possible decay modes as direct to the three-body continuum or sequential via two-body configurations. The different decay modes can be found from the rotated wave function if the scaling angle is larger than the angles of the relevant two-body resonances.
For direct decays all three particles simultaneously leave the interaction region. This corresponds to converged distributions at the largest accurately computed -values. Further increase of increases all distances proportional to , and the points in fig. 4 can be translated into relative distances between the particles. Spatial and momentum distributions are asymptotically identical since the particles at large distances move along their respective coordinates relative to the center-of-mass.
The decay is sequential if the conserved two-body quantum numbers match an intermediate two-body structure and the corresponding distance in the complex scaled wave function remains small and constant until all energy exchanges, or couplings, with the third particle can be neglected. Each sequential decay corresponds to asymptotic population of the adiabatic component describing that structure. These decays result in distributions which continue to change with increasing like in the inset of fig. 4. In at least one of the three possible Jacobi coordinates the distribution is moving towards small values of the corresponding distance ratio. Then two particles remain close in the intermediate structure while the increase of the average size is achieved entirely by the third particle moving away. These components must be removed from the rotated wave function and treated separately as two consecutive two-body decays with precisely known kinematics. They are decoupled from each other and from the direct decay components.
One two-body configuration could have attraction enough to favor an intermediate resonance structure to (exceedingly) large average distances when one particle is far outside normal interaction ranges. This could happen when the total energy is smaller than the energy of the two-body resonance and the effective barrier in fig. 1 becomes very wide. The system remains in the classically forbidden region to large distances. The signature is stable population at intermediate of one adiabatic component. At larger the population necessarily decreases due to energy conservation corresponding to decay directly into the three-body continuum. The three-body decay width can be extremely small for such peculiar structures which have been baptized as virtual sequential decay gar04 . This is decay through the tail of an energy forbidden low-lying two-body resonance. The treatment can be either to continue the computation to much larger or handle separately as for sequential decay.
These decay modes are in fact different intermediate paths and as such not observables. In pronounced cases they leave distinctly different signatures in computed distributions as shown in fig. 4, but otherwise a distinction is not always meaningful and mode separation becomes artificial or model dependent.
Scaling angle dependence.
The presented results are all for . Increasing to 0.14 and 0.24 beyond the 8Be() and 5He() resonances, respectively, do not change the momentum distributions or the fractions of sequential decay. However, the accuracy decreases with increasing which therefore is kept as small as possible.
Geometric visualization.
One pertinent question is whether it is possible to distinguish the different decay modes by use of the experimental information without theoretical models. Let us plot the measured energy distributions of all three particles as functions of defined as the particle energies divided by the respective maximum values. We change into the distribution given as function of the variable in fig. 4. Since , this defines , where .
The resulting plot of is designed to resemble the direct decays or the converged part of fig. 4. However, it contains perhaps also sequential decay contributions which may exhibit characteristic features with a peak at the corresponding energy and a width equal to the sum of the widths of the intermediate two-body state and the decaying resonance. For virtual sequential decay the peak in the distribution arises from phase space combined with the tail of the intermediate resonance.
To visualize the measured decays geometrically, plots of in fig. 4 could be constructed. One could look for features of two-body kinematics corresponding to sequential decays. Then it is crucial to correlate consistently the results in different Jacobi coordinates. If these features cannot be identified it is probably because an extraction is ambiguous and the structures can be described in several basis sets or by different models. Then the positions of the remaining peaks can be interpreted as length ratios in triangular configurations.
When two particles are identical only two plots are possible as for 9Be. The two identical particles go together in an intermediate configuration through 9Be() and their energy distributions follow from two-body kinematics. Everything else is direct decay, and the distributions in fig. 4 correspond to a triangular decay geometry with side ratios .
For three identical particles, like 12C-decay into three -particles, only one such plot exists alv07b . Decays of the two lowest -resonances are preferentially sequential through the ground state of 8Be resulting in a peak corresponding to emission of the first particle and the kinematically related broad structure at lower energy. The direct decay of the -state gives three peaks and corresponding triangular side ratios of . A directly decaying linear chain would produce a distribution with peaks at and at a very large value.
Conclusions.
The measured energy distributions of three-body decaying resonances reflect the structure related to the decay mechanism. Specific plots are well suited for extraction of the corresponding geometry. Sharp peaks most likely correspond to sequential decays via energetically allowed two-body configurations. The energy forbidden virtual sequential decays leave a signature of the corresponding two-body angular momentum and parity. Direct decays only carry information of conserved quantum numbers of the decaying state. Direct and sequential decays can be distinguished if energy or angular momentum signatures are different.
In general, decays via high-lying or broad resonances are very unlikely because the corresponding components would be depopulated already at small hyperradii where the coupling is strong. Sequential decays via energy allowed low-lying and narrow resonances are possible but not unavoidable. Virtual (energy forbidden) sequential decays are possible when the two-body resonance energy and width both are small and the effective barrier therefore very thick. Several descriptions in terms of different basis sets may be equally efficient.
For application on the three-body decay of 9Be() we find a small fraction emerging via 8Be() but no decays via the 8Be() or 5He() structures. In this case reaction rates based on derived branching ratios via sequential channels are not meaningful or misleading.
Acknowledgments.
R.A.R. acknowledges support by a post-doctoral fellowship from Ministerio de Educación y Ciencia (Spain). We are grateful for many discussions with D.V. Fedorov and we thank O. Kirsebom for detecting several mistakes related to fig. 4.
References
- (1) R.H. Dalitz, Philosophical. mag. 44, 1068 (1953).
- (2) C. Amsler, Rev. Mod. Phys. 70, 1293 (1998).
- (3) L.V. Grigorenko and M.V. Zhukov, Phys. Rev. C 72, 015803 (2005).
- (4) U. Galster, F. Baumgartner, U. Müller, H. Helm, and M.Jungen, Phys.Rev. A72, 062506 (2005).
- (5) B. Blank et al., C. R. Physique 4, 521 (2003).
- (6) H.O.U. Fynbo et al., Phys.Rev.Lett. 91, 082502 (2003).
- (7) P. Papka et al., Phys. Rev. C 75, 045803 (2007).
- (8) E. Garrido, D.V. Fedorov, H.O.U. Fynbo and A.S. Jensen, Nucl. Phys. A 781, 387 (2007).
- (9) R. Alvarez-Rodriguez, A.S. Jensen, D.V. Fedorov, H.O.U. Fynbo and E. Garrido, Phys.Rev.Lett. 99, 072503 (2007).
- (10) P. Descouvemont, Eur. Phys. J.12, 413 (2001).
- (11) E. Nielsen, D.V. Fedorov, A.S. Jensen, and E. Garrido, Phys. Rep. 347, 373 (2001).
- (12) D.V. Fedorov, E. Garrido, and A.S. Jensen, Few-body systems, 33, 153 (2003).
- (13) R. Alvarez-Rodriguez, E. Garrido, A.S. Jensen, D.V. Fedorov, and H.O.U. Fynbo, Eur.Phys.J. A 31, 303 (2007).
- (14) E. Garrido, D.V. Fedorov and A.S. Jensen, Nucl. Phys. A 700, 117 (2002).
- (15) E. Garrido, D.V. Fedorov and A.S. Jensen, Nucl. Phys. A 733, 85 (2004).