Supernova 1996cr: SN 1987A’s Wild Cousin?
Abstract
We report on new VLT optical spectroscopic and multi-wavelength archival observations of SN 1996cr, a previously identified ultraluminous X-ray source known as Circinus Galaxy X-2. The spectrum of the optical counterpart confirms SN 1996cr as a bona fide type IIn SN, in accordance with its tentative SN classification at X-ray wavelengths. SN 1996cr is one of the closest SNe (3.8 Mpc) in the last several decades and in terms of flux ranks among the brightest radio and X-ray SNe ever detected. Optical imaging from the Anglo-Australian Telescope archive allows us to isolate the explosion date to between 1995-02-28 and 1996-03-16, while the wealth of optical, X-ray, and radio observations that exist for this source provide relatively detailed constraints on its post-explosion expansion and progenitor history, including an preliminary angular size constraint from VLBI. Archival X-ray and radio data imply that the progenitor of SN 1996cr evacuated a large cavity just prior to exploding via either a sped-up wind or a pre-SN explosion. The blast wave likely spent 1–2 yrs in relatively uninhibited expansion before eventually striking the dense circumstellar material which surrounds SN 1996cr to become a prodigious X-ray and radio emitter. The X-ray and radio emission, which trace the progenitor mass-loss rate, have respectively risen by a factor of 2 and remained roughly constant over the past yr. This behavior is reminiscent of the late rise of SN 1987A, but three orders of magnitude more luminous and much more rapid to onset. SN 1996cr may likewise provide us with a younger example of SN 1978K and SN 1979C, both of which exhibit flat X-ray evolution at late times. The optical spectrum suggests that the progenitor was a massive star that shed some of its outer envelope (many M) prior to explosion, while the complex Oxygen line emission hints at a possible concentric shell or ring-like structure. Taken together, this implies that a substantial fraction of the closest SNe observed in the last several decades have occurred in wind-blown bubbles, and argues for the phenomena being widespread.
Subject headings:
stars: supernovae: general — stars: circumstellar matter — X-rays: supernovae — radio: supernovae —1. Introduction
Although thousands of supernovae (SNe) have been discovered to date, only several dozen have been detected at either X-ray111See http://lheawww.gsfc.nasa.gov/users/immler/supernovae_list.html for a complete list of X-ray SNe and references or radio222See http://rsd-www.nrl.navy.mil/7213/weiler/kwdata/RSNtable.txt for a list of radio SNe and references wavelengths (designated XSNe or RSNe, respectively). Many of these XSNe and RSNe were originally detected simply as variable X-ray or radio sources, and only verified as true SNe after careful examination of archival optical data or through optical follow-up (e.g., Rupen1987; Ryder1993). This particular path to discovery has meant that only a handful of these sources have been well-studied during the first several hundred days, a period which is critical for identifying and characterizing the true nature of the SNe.333By contrast, XSNe and RSNe do comprise a substantial fraction of all SNe well-studied beyond a few hundred days, as such SNe end up being nearby and remain relatively bright for years to decades. Such SNe typically turn out to be core-collapse SNe of either type Ibc, which have been associated with long-duration gamma-ray bursts (GRBs), or type II, whereby the intense X-ray and/or radio emission is thought to stem from the interaction between the expanding shock and a dense progenitor wind. When well-sampled, the additional multi-wavelength constraints from XSNe and RSNe can provide physical insights into the late evolutionary stages of massive stars that are otherwise impossible to obtain. For instance, while robust constraints on the overall time-averaged mass-loss in various phases of stellar evolution exist, there has been a long-standing debate over the number and sequence of various evolutionary stages for massive stars, and relatively few observational constraints on the actual evolution of mass-loss within many particular stages (e.g., Lamers1991; Langer1994; Stothers1996; Maeder2000). Because the SN blast wave travels orders of magnitude faster than the stellar wind, studying the interaction between the blast wave and the progenitor stellar wind allows us to probe tens of thousands of years of evolution in a matter of decades. SNe progenitors are considered to provide the bulk of all processed stellar material additionally, and thus the characterization of these sources can likewise help further our understanding of overall galactic chemical enrichment.
Here we report on the spectroscopic confirmation of one such serendipitous source, SN 1996cr (Bauer2007), and present a multi-wavelength follow-up study using archival data to determine its explosion date and temporal properties. SN 1996cr was originally detected as Circinus Galaxy (CG) X-2, an ultraluminous X-ray source in the nearby Circinus Galaxy (Freeman1977), which Bauer2001 found to exhibit many characteristics of a young, type II SN enshrouded in a dense circumstellar environment. In particular, it demonstrated a factor of 30 increase in X-ray flux between 1997–2000, a 10 keV thermal spectrum with a strong, blended Fe emission-line component at 6.85 keV, and spatial coincidence with a strong radio and H-emitting point source. The proximity of this SN affords us a rare opportunity to study in detail a type II SN which is strongly interacting with its circumstellar medium.
This paper is organized as follows: data and reduction methods are detailed in 2; confirmation of SN 1996cr as a SN and isolation of its explosion date are provided in LABEL:confirm; overall temporal and spectroscopic constraints for SN 1996cr are investigated in LABEL:character; and finally conclusions and future prospects are explored in LABEL:conclude. Throughout this paper, we adopt a distance of Mpc to the Circinus Galaxy (converted from Freeman1977). While the Circinus Galaxy lies close to the Galactic Plane (38), it is located within a Galactic “window” with a visual extinction of and a neutral hydrogen column density of cm (whereas neighboring regions typically have and – cm; Schlegel1998; Dickey1990). Due to its inclination, however, there is significant internal obscuration as well [Bauer2001, – cm typically;].
2. Observational Data and Reduction Methods
We describe below the extensive observational data used to constrain the properties of SN 1996cr. Fortunately, plentiful archival data exist for the Circinus Galaxy due to the fact that it hosts the second closest Compton-thick active galactic nuclei (AGN) to our own Galaxy and exhibits signs of vigorous star formation (e.g., Matt1999). The resulting multiwavelength dataset provides good constraints on the explosion date and yields useful long-term X-ray and radio light curves. SN 1996cr lies 25″to the south of the Circinus Galaxy nucleus. We adopt the position of 01 (J2000), determined from the radio observations.
2.1. VLT Spectroscopy
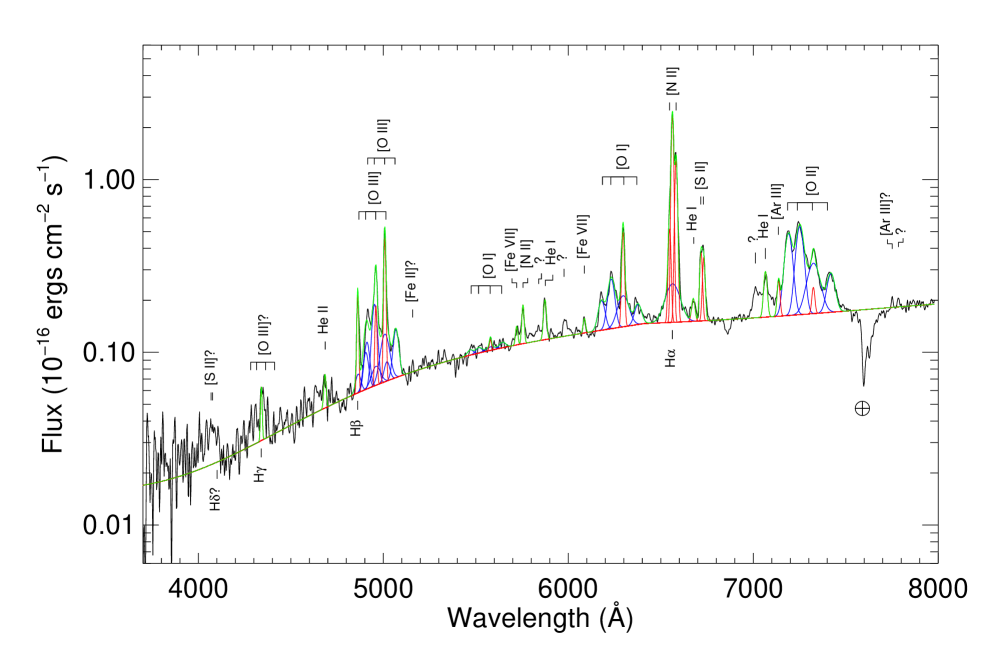
SN 1996cr was visited several times in service mode with the VLT FORS I spectrograph in two separate campaigns. The first program was initiated over the course of 2005-03-06 through 2005-03-17 but never completed, resulting in a low signal-to-noise spectrum. As such, we do not provide any further details. The second program was executed over three nights (2006-01-26, 2006-02-02, and 2006-03-10), yielding a high-quality spectrum confirming the ambiguous features seen in the spectrum from our first program. Our analyses focus only on the spectrum from the first night, as the observations on the subsequent two nights suffer from significantly worse seeing (15–20) such that the co-addition of these frames failed to improve the signal-to-noise of the final spectrum. Our observations on the first night consisted of four 1200 s exposures taken with the 300V grism and the TEK (24 pixel) CCD using a slitwidth of 20. The grism and CCD combination provided a dispersion of 2.66 Å pixel and a total useful wavelength coverage of 3600–7990 Å. These images were taken in excellent seeing conditions, in which stellar sources had a full-width half-maximum (FWHM) measured at 06–07 on the FORS I chip over the course of the night. Our target, SN 1996cr, had an % larger FWHM image size than the point sources in the acquisition image, suggesting that it may be spatially extended or possibly contaminated by a coincident H ii region. We investigated this further by measuring the FWHM orthogonal to the dispersion axis for the strong emission lines [O III]5007 and H, which had sizes of 074 and 085, respectively. The inherent FWHM slowly increased with decreasing wavelength, such that the FWHMs quoted above were 53% and 354% larger than their stellar equivalents, respectively. Thus the [O III]5007 FWHM is formally unresolved, while the H line is extended. The strength, extent, and visible asymmetry in the FWHM profile of the extended H are fully consistent with the underlying H ii region (see LABEL:confirm for details), although we caution that marginally-resolved light echoes could potentially contaminate and broaden the PSF (e.g., Sugerman2003). The spectral resolution (11 Å, or 500 km s) was estimated from the width of the arclines taken with a 10 slit, which matched closely the on-sky image size of SN 1996cr. After bias subtraction and flat-fielding using standard techniques, the co-added spectra were extracted, wavelength calibrated, and flux calibrated (using the standard LTT4816). Fig. 1 shows the resulting optical spectrum from 2006-01-26. We conservatively estimate the flux errors on the spectrum at 20%.
2.2. Archival Optical Data
We searched through the European Southern Observatory (ESO), Anglo Australian Telescope (AAT), United Kingdom Schmidt Telescope (UKST), and Hubble Space Telescope (HST) archives. We only list here data that ultimately were used to constrain the explosion date of SN 1996cr. Relevant data are listed in Tables 1–LABEL:tab:data_ukst. Aperture photometry was performed throughout, with PSF-fitting employed as a cross-check; there is only one instance where the PSF-fitting magnitude differed from the aperture-measured value at , which we explicitly document below.
2.2.1 ESO
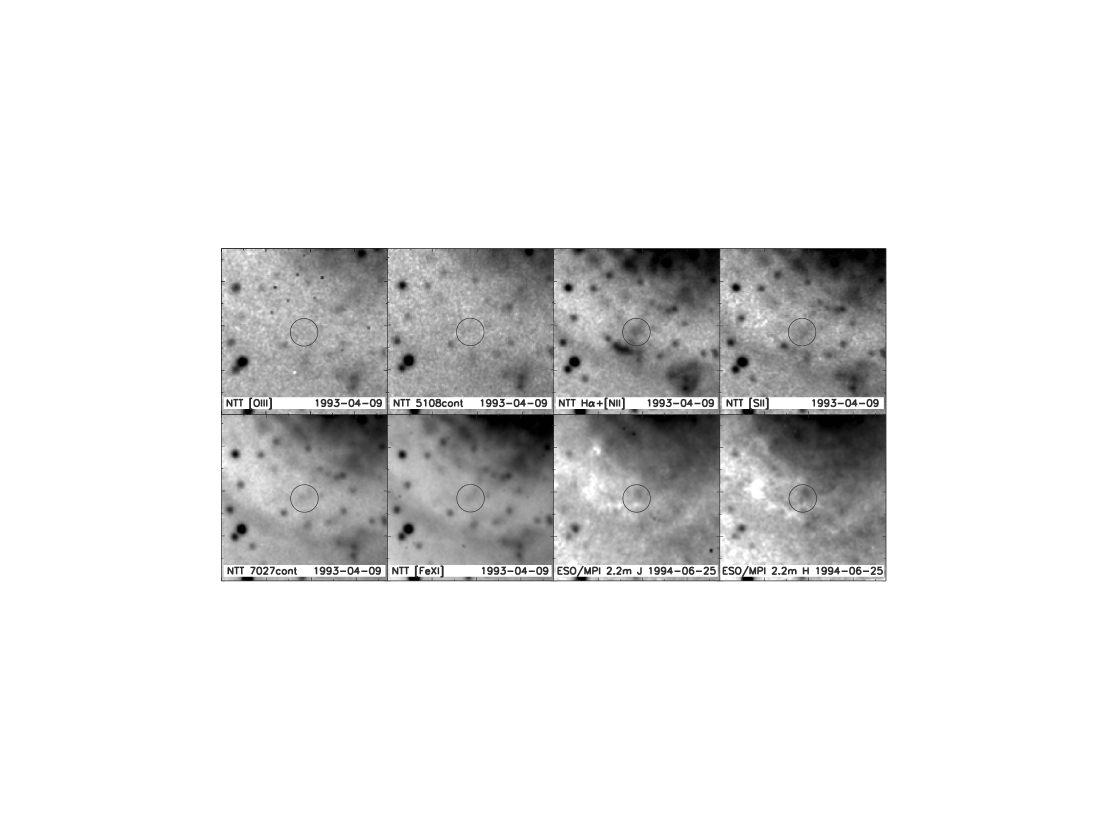
The Circinus Galaxy was observed extensively with SUSI at the NTT on 1993 April 9 using several narrow-band filters (#369:[O III], #430:5100 Å continuum, #629:H+[N II], #700:[S II], #443:7000 Å continuum, #415:[Fe XI]7892)444http://filters.ls.eso.org/efs/efs_fi.htm as well as with the IRAC2 camera at the ESO/MPI 2.2m telescope on 1994 June 25 using broad-band and filters. Reduced images were kindly provided by E. Oliva and A. Marconi (private communication, 2007), for which cutouts of SN 1996cr are shown in Fig. 2. Details of the observations and reduction procedures are given in Marconi1994. The [O III], H+[N II], and [S II] images were the only images provided to us in a flux-calibrated state, and therefore are the only ones for which we measure photometry. Magnitudes for the region in the vicinity of SN 1996cr were measured using a 10 radius circular aperture and previously established zero points. An aperture correction of 0.2 mags was estimated empirically using several bright, isolated point sources in the images. The resulting aperture-corrected magnitudes are presented in Table 1.
2.2.2 HST
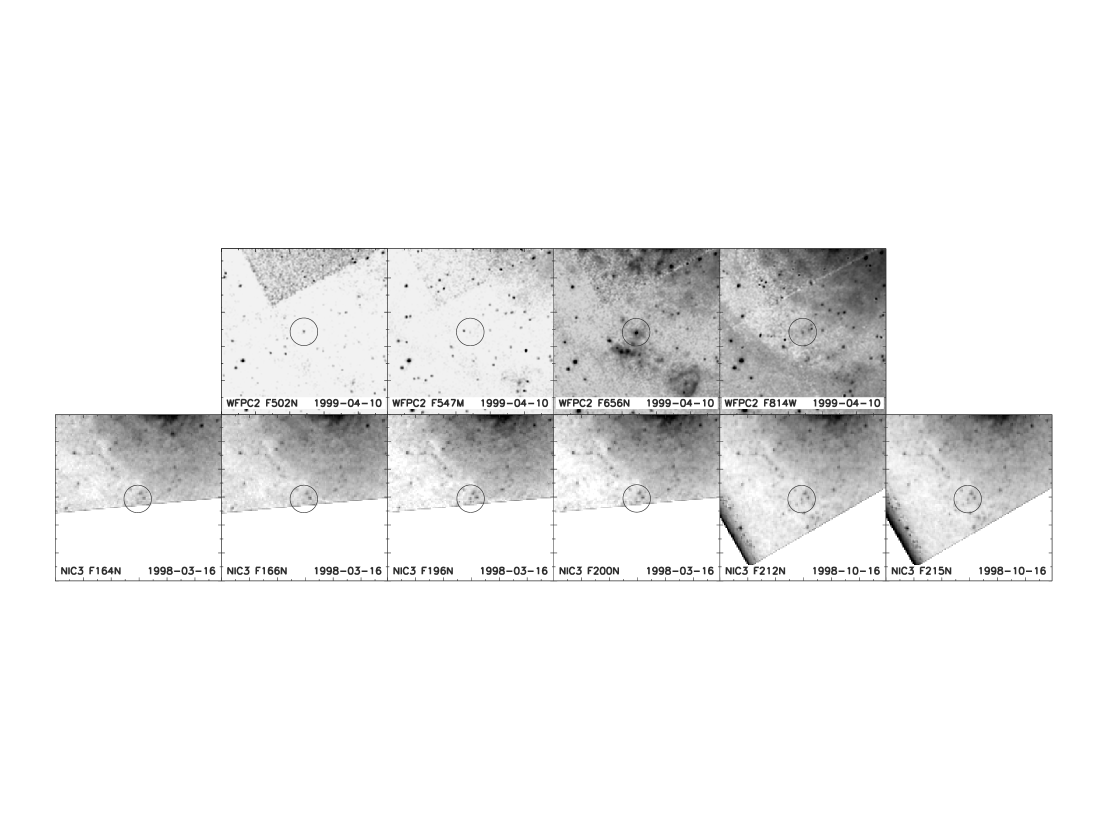
The Circinus Galaxy was observed with both the WFPC2 and NICMOS instruments aboard HST on four separate occasions, as outlined in Table 2. Details of the photometric and astrometric reduction of the WFPC2 data are given in Bauer2001. Briefly, after standard calibration of the HST images, we used the iraf package daophot to measure aperture-corrected magnitudes using a 02 radius aperture for all sources down to the 2 detection limit. The HST images were then aligned to the Hipparcos/Tycho astrometric reference frame to 04. Due to the negligible overlap of the F606W observation with the other filters and complete lack of coverage of SN 1996cr itself, we do not discuss it further. For the NICMOS data, of which only the NIC3 images provided useful imaging, we used the standard pipeline data products. We performed photometry using a 05 radius aperture and applied band-dependent aperture corrections determined from a set of isolated, unsaturated point sources in the vicinity of SN 1996cr. Cutout images of SN 1996cr are presented in Fig. 3. Notably, SN 1996cr appears to lie at the center of a diffuse patch of H emission in the F656N image and our aperture magnitude here differs from a PSF-fitting one at (0.11 magnitudes). We thus adopt the PSF-fitting magnitude, as well as an additional systematic error of 0.1 magnitudes to reflect the larger uncertainty associated with the deblending.
2.2.3 AAT
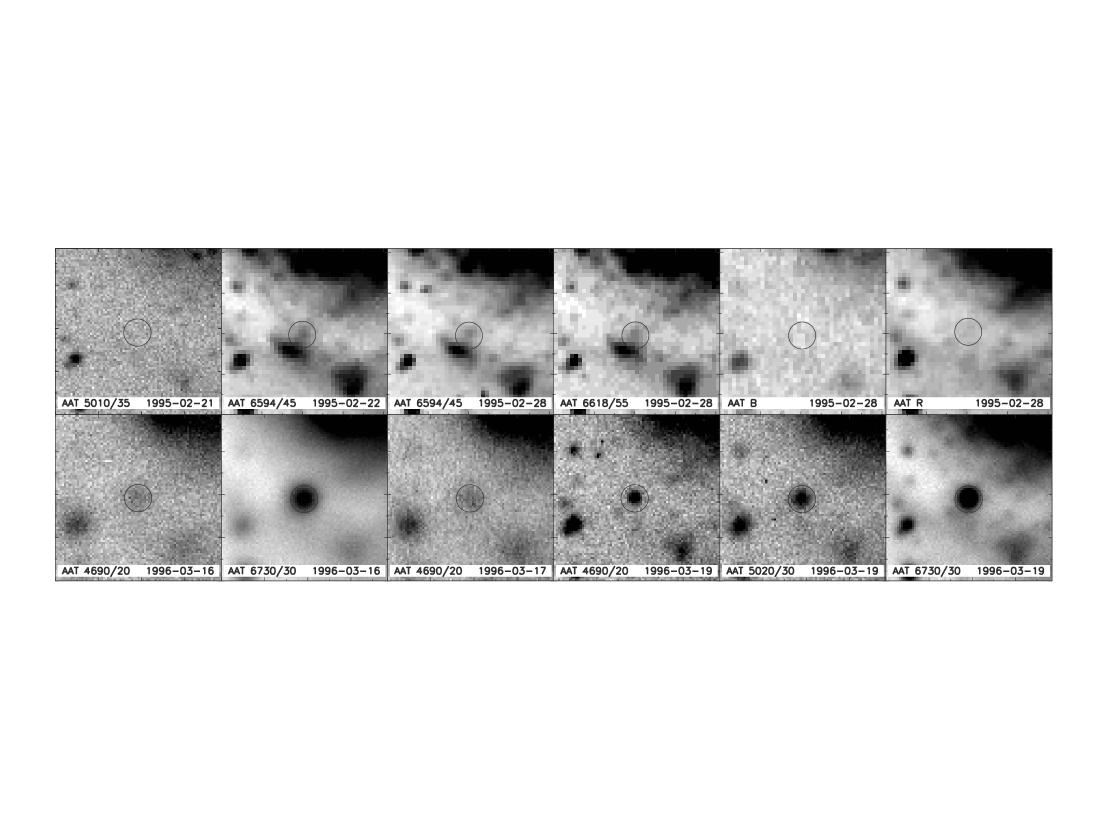
The Circinus Galaxy was observed numerous times with the TAURUS Fabry-Perot instrument on the AAT during 1995-02-21 to 1995-02-28 and 1996-03-15 to 1996-03-20. The data were retrieved through the AAT archive.555http://site.aao.gov.au/arc-bin/wdb/aat_database/observation_log/make The observations were comprised primarily of narrow-band imaging and TAURUS spectral imaging cubes centered on the He II4686, [O III]5007,4959, H[N II]6583,6548, and [S II]6731,6716 emission lines. The original investigators discuss their observational design in Veilleux1997 and Elmouttie1998, while more complete data reduction procedures are outlined in Gordon2000. To summarize, the TAURUS instrument was used in the angstrom imaging mode, wherein narrow-band filters were used at different tilt angles to isolate the lines of He II, [O III], H[N II], and [S II] (Bland-Hawthorn1998). Each square pixel subtended 0315 on the sky and the atmospheric seeing at FWHM averaged 12–20. Unfortunately, a significant portion of the archived TAURUS images for the Circinus Galaxy have only limited accompanying CCD calibration data; there were often no obvious superbias frames, dark frames, dome-flats, or flux standards, so the photometric quality of the reduced data is limited.
Our best-effort reduction proceeded as follows. The overscan regions were used to subtract the bias from each frame and each image was flat-fielded using a sky flat. When multiple frames in a given filter were available, the images were combined to reject cosmic rays using the iraf task crrej. Source detection and photometry were performed with SExtractor (Bertin1996). A set of 40 relatively bright, isolated, unsaturated stars, which are detected in all the AAT and HST images, were chosen to register the AAT images to the HST coordinate frame. The alignment of each AAT image to this reference frame is accurate to 01–02 (1). The zeropoints for the narrow-band images were obtained by bootstrapping the AAT magnitudes to the well-determined HST ones. To this end, HST colors were obtained for the 40 stars and matched to standard main sequence stellar templates from the Bruzual Atlas,666 http://www.stsci.edu/hst/observatory/cdbs/bz77.html modified by a standard Galactic dust model with (the extinction measured toward the Circinus Galaxy; e.g., Schlegel1998) using the iraf package synphot. Among the 40 calibration stars, 25 had colors consistent with one of the stellar templates. These particular stellar templates and the TAURUS-specific transmission curves777http://www.aao.gov.au/local/www/cgt/ccdimguide/filtercat.html were input into synphot to convert between HST and TAURUS magnitudes. We used the iraf task fitparams to compare interactively the HST-derived magnitudes to the SExtractor ones and derive reasonable zeropoints for each image. We typically rejected a few outliers in fitparams to obtain an adequate fit (0.3–0.5 mag 1 error typically on the zeropoint). The He II, [O III], and [S II] bands were observed multiple times, so we combined zeropoint estimates to ensure that magnitudes for the detected sources were consistent to within 0.1–0.2 mags across these images. For bands which sampled comparable spectral windows, we used synphot to convert from one band to another (for instance, from TAURUS 5020 Å/30 Å to HST F502N or from the VLT FORS spectrum to all overlapping bands). The resulting magnitudes are listed in Table 3, while Fig. 4 shows 12 images taken in 1995 February and 1996 March.
| Instrument | Filter | Date | Exp. | Seeing | Magnitude |
|---|---|---|---|---|---|
| SUSI/NTT | ESO#369 ([O III]) | 1993-04-09 | 900 | 07 | |
| SUSI/NTT | ESO#430 (5108 Å cont.) | 1993-04-09 | 900 | 07 | — |
| SUSI/NTT | ESO#629 (H+[N II]) | 1993-04-09 | 480 | 07 | |
| SUSI/NTT | ESO#700 ([S II]) | 1993-04-09 | 900 | 07 | |
| SUSI/NTT | ESO#443 (7027 Å cont.) | 1993-04-09 | 900 | 07 | — |
| SUSI/NTT | ESO#415 ([Fe XI]7892) | 1993-04-09 | 900 | 07 | — |
| IRAC2/ESO-MPI 2.2m | J (1.25 m) | 1993-06-25 | 360 | 09 | |
| IRAC2/ESO-MPI 2.2m | H (1.65 m) | 1993-06-25 | 360 | 09 |
Note. — Column 1: Instrument and telescope. Column 2: Filter. Column 3: UT date of observation given as year-month-day. Column 4: Exposure time in seconds. Column 5: Seeing. Column 6: Aperture-corrected Vega magnitude or 3 upper limit. Details are given in 2.2.1. The detected magnitudes denoted by s provide constraints on line emission from the H ii region which spatially overlaps SN 1996cr.
| Instrument | Filter | Date | Exp. | Magnitude |
|---|---|---|---|---|
| WFPC2 | F606W | 1996-08-11 | 200, 400 | — |
| NIC3 | F164N | 1998-03-16 | 64 | |
| NIC3 | F166N | 1998-03-16 | 64 | |
| NIC3 | F196N | 1998-03-16 | 80 | |
| NIC3 | F200N | 1998-03-16 | 80 | |
| NIC3 | F212N | 1998-10-16 | 160 | |
| NIC3 | F215N | 1998-10-16 | 160 | |
| WFPC2 | F502N | 1999-04-10 | 900, 900 | |
| WFPC2 | F547M | 1999-04-10 | 60 | |
| WFPC2 | F656N | 1999-04-10 | 800, 800 | |
| WFPC2 | F814W | 1999-04-10 | 40 |
Note. — Column 1: HST instrument and filter. Filter denotes the central filter wavelength in nanometers and the filter width (N=narrow, M=medium, W=wide). Details on individual filters can be found in the WFPC2888 http://www.stsci.edu/instruments/wfpc2/Wfpc2_hand_current/ and NICMOS999http://www.stsci.edu/hst/nicmos/documents/handbooks/v4.1/ Instrument Handbooks. Column 2: UT date of observation given as year-month-day. Column 3: Exposure time(s) in seconds. Column 4: Aperture-corrected Vega magnitude or 3 upper limit. Magnitudes were measured with circular apertures of radius 02 and 05 for WFPC2 and NIC3, respectively, and corrected for missing flux due to the shape of the PSF. Note that increasing the aperture radius in the HST F656N band to 12 yields a magnitude of 17.5 (i.e., an increase of 25% over the point-like magnitude from SN 1996cr alone) which we attribute to the flux of the underlying H ii region. We have added a systematic error of 0.1 magnitude to the F656N value to reflect the accuracy to which we can deblend the point source emission from the underlying H ii region. The H ii region alone should have a magnitude of , which is consistent with values measured from our early-time comparison images. Likewise, increasing the aperture in the NIC3 observations any further will begin to include nearby contaminating point sources, as shown in Fig. 3. Finally, we have incorporated an additional systematic error of 0.1 mag to account for the intrapixel sensitivity variations in the NIC3 observations.
| Filter | Date | Exp. | Seeing | Magnitude |
|---|---|---|---|---|
| 5020/30 (0) | 1995-02-21 | 300 | 12 | |
| 6583/45 (9) | 1995-02-22 | 300 | 12 | |
| 6583/45 (9) | 1995-02-28 | 267 | 11 | |
| 6618/55 (7) | 1995-02-28 | 1442 | 11 | |
| 1995-02-28 | 60 | 12 | ||
| 1995-02-28 | 20 | 14 | ||
| 4690/26 (5) | 1996-03-16 | 1200 | 35 | |
| 6730/30 (5) | 1996-03-16 | 1200 | 30 | |
| 4690/26 Z-CUBE (5) | 1996-03-16 | 30 | ||
| 4690/26 (0) | 1996-03-17 | 1200 | 31 | |
| 4690/26 (0) | 1996-03-19 | 1000 | 12 | |
| 5020/30 (0) | 1996-03-19 | 120 | 13 | |
| 6730/30 (0) | 1996-03-19 | 1000 | 13 |
Note. — Column 1: Filter, given here as central wavelength and bandwidth in Angstroms. 6370/30, 6583/45, 5020/30, 4690/26 are narrow-band filters used with the AAT TAURUS Tunable Filter (see AAT Filter Catalog101010http://www.aao.gov.au/local/www/cgt/ccdimguide/filtercat.html for details), while and are standard Johnson filters. Note that for the TAURUS instrument, we also list a tilt angle, which tunes the wavelength range such that , where is tilt angle in degrees. Column 2: UT date of observation given as year-month-day. Column 3: Exposure time in seconds. Column 4: Seeing. Column 5: Aperture-corrected Vega magnitude or 3 upper limit. Details are given in 2.2.3.