Path-integral molecular dynamics simulation of 3C-SiC
Abstract
Molecular dynamics simulations of 3C-SiC have been performed as a function of pressure and temperature. These simulations treat both electrons and atomic nuclei by quantum mechanical methods. While the electronic structure of the solid is described by an efficient tight-binding Hamiltonian, the nuclei dynamics is treated by the path integral formulation of statistical mechanics. To assess the relevance of nuclear quantum effects, the results of quantum simulations are compared to others where either the Si nuclei, the C nuclei or both atomic nuclei are treated as classical particles. We find that the experimental thermal expansion of 3C-SiC is realistically reproduced by our simulations. The calculated bulk modulus of 3C-SiC and its pressure derivative at room temperature show also good agreement with the available experimental data. The effect of the electron-phonon interaction on the direct electronic gap of 3C-SiC has been calculated as a function of temperature and related to results obtained for bulk diamond and Si. Comparison to available experimental data shows satisfactory agreement, although we observe that the employed tight-binding model tends to overestimate the magnitude of the electron-phonon interaction. The effect of treating the atomic nuclei as classical particles on the direct gap of 3C-SiC has been assessed. We find that non-linear quantum effects related to the atomic masses are particularly relevant at temperatures below 250 K.
pacs:
63.20.Kr,05.30.-d,71.15.PdI Introduction
Silicon carbide has attracted much interest in technology as a wide-gap semiconductor in high power electronic devices. Matsunami (2006) It features large electronic band gaps, extreme hardness, large thermal conductivity and excellent chemical stability. It is a prototype of materials which exhibit several polytypes (more than 200) and the only IV-IV compound which possesses long range order polytypes. The cubic modification 3C-SiC has a zinc-blende structure, being thus the type with closest structural relationship to both diamond and elemental Si. From the point of view of basic research, there exists a large body of experimental data on silicon carbide, so that the quality of theoretical approaches and computer simulations can be contrasted against them.Silicon Carbide and Related Materials 2001 (2002)
The influence of anharmonic effects in the vibrational properties of 3C-SiC is revealed by several experimental studies. The pressure dependence of optical phonons in 3C-SiC has been measured by means of first- and second-order Raman scattering up to 23 GPa, Olego et al. (1982) while their temperature dependence has been studied by first-order Raman scattering up to 750 K. Olego and Cardona (1982) The pressure dependence of phonon lifetimes, which provides detailed information on the anharmonic phonon-phonon interaction, has been also calculated from first principles using perturbation theory.Debernardi et al. (2001); Karch et al. (1996) These calculations permitted a detailed analysis of the microscopic anharmonic mechanism and yielded accurate predictions of experimental properties.
The thermal expansion of the lattice is another property determined by the anharmonicity of the interatomic potential. There is no evidence of negative thermal expansion in 3C-SiC, in contrast to diamond and elemental Si, which show negative thermal expansion at temperatures below 100 K. Biernacki and Scheffler (1989); Sato et al. (2002) An analysis of the most reliable experimental data for the thermal expansion of 3C-SiC led to a tabulation of recommended values for this quantity in Ref. Slack and Bartram, 1975. Theoretical results for the temperature dependence of the linear thermal expansion for 3C-SiC have been also reported using the quasiharmonic approximation.Talwar and Sherbondy (1995); Karch et al. (1994)
The optical properties of 3C-SiC have been measured using spectroscopic ellipsometry as a function of temperature in the range between 90 and 550 K.Petalas et al. (1998) The electron-phonon interaction is responsible for the decrease found in the interband transition energies as temperature increases. We recall that the renormalization of the optical response of semiconductors by electron-phonon interaction has been a topic of increasing interest in recent years,Cardona (2001, 2005) with special focus in the characterization of isotopic effects.Cardona and Thewalt (2005) From a theoretical point of view, the electron-phonon interaction in tetrahedral semiconductors has been studied so far by perturbation theory. Allen and Cardona (1981); Zollner et al. (1992); King-Smith et al. (1989)
An interesting alternative to perturbational approaches to study the coupling between electronic and vibrational degrees of freedom in solids, is the combination of the path integral (PI) formulation with electronic structure methods. The path integral approach to statistical mechanics allows us to study finite temperature properties that are related to the quantum nature of the atomic nuclei. Feynman (1972); Ceperley (1995) An advantage of its combination with electronic structure methods is that both the electrons and the atomic nuclei are then treated quantum mechanically in the framework of the Born-Oppenheimer (BO) approximation, so that phonon-phonon and electron-phonon interactions are automatically considered in the simulation. This unified scheme has been applied so far to the study of solids and molecules containing light atoms. Marx and Parrinello (1996); Tuckerman et al. (1997); Ramírez et al. (1998); Tachikawa and Shiga (2005); Shiga et al. (2001); Chen et al. (2003); Della Sala et al. (2004); Ohta et al. (2004) A recent application of this method has shown that the electron-phonon coupling leads to a zero-point renormalization of the direct electronic gap of diamond of 10%,Ramírez et al. (2006) in agreement with a previous perturbational analysis.Zollner et al. (1992)
In this paper we present a path integral molecular dynamics study of 3C-SiC at temperatures between 100 and 1200 K and pressures up to 60 GPa. The electronic structure was treated with a non-orthogonal tight-binding (TB) Hamiltonian as a reasonable compromise to reduce the computational cost of deriving the BO energy surface for the nuclear dynamics. We are interested in the simulation of vibrational properties that rely on phonon-phonon interactions, such as the temperature dependence of the linear expansion coefficient, and also in the simulation of electronic properties that are determined by electron-phonon coupling, such as the temperature dependence of the direct electronic gap.
This paper is organized as follows. In Sec. II, we describe the computational method employed in our simulations. Our results are presented and discussed in Sec. III, dealing with the thermal expansion coefficient and the temperature dependence of the direct electronic gap of 3C-SiC. The results for the electronic gap in 3C-SiC will be then related to those derived for diamond and crystalline Si. The results of the simulation will also be compared to available experimental data. The pressure dependence of the electronic gap as well as the results for the bulk modulus and its pressure derivative at 300 K will complete Sec. III. In Sec. IV, we present the main conclusions of the paper.
II Computational Method
The formalism employed here for the quantum treatment of electrons and nuclei is based on the combination of the path integral formulation, to derive properties of the atomic nuclei in thermal equilibrium, with an electronic tight-binding Hamiltonian to describe the BO energy surface, , of 3C-SiC as a function of the nuclear configuration . This approach has been recently used in our simulation of diamondRamírez et al. (2006) and isolated hydrogenic impurities in diamondHerrero et al. (2006) in the canonical ensemble (number of atoms , volume , and temperature are constant). Therefore, we present here only a brief summary of the method, with focus on those extensions required for the 3C-SiC simulations, that were performed in both the and the isothermal-isobaric ensemble (, pressure , and are constant). The combination of the path integral formalism with ab initio Hamiltonians based on density funtional theory (DFT) is an interesting alternative that has been reviewed in the literature, Mark and Hutter (2000); Tuckerman (2002a) but it has not been applied so far to the investigation of the temperature dependence of the optical response in semiconductors. Typically tight binding methods are two orders of magnitude faster than ab initio DFT methods.
The employed tight-binding one-electron effective Hamiltonian is based on density functional (DF) calculations.Porezag et al. (1995) The TB energy consists of two terms, the first one of which is the sum of occupied one-electron state energies, and the second is given by a pair-wise repulsive interatomic potential. The one-electron states are derived by diagonalizing a two-center Hamiltonian using a minimal basis of non-orthogonal atomic orbitals. The pair potential is adjusted so that the DF energy is reproduced for a series of reference systems (e.g. the dimer, the crystal, etc.) The total energy is thus obtained by adding to the electronic energy the repulsive pair-potential. Preliminary calculations on 3C-SiC revealed that the original parameterization of the pair-potential between Si and C leads to an overestimation of anharmonic effects in 3C-SiC, a fact that motivated us to improve the parameterization of the Si-C pair-potential as explained in Appendix A.
The computational advantage of using the path-integral formulation of statistical mechanics is based on the so-called “quantum-classical” isomorphism. Thus, this method exploits the fact that the partition function of a quantum system is formally equivalent to that of a classical one, obtained by replacing each quantum particle (here, atomic nucleus) by a ring polymer consisting of “beads”, connected by harmonic springs.Gillan (1988); Ceperley (1995); Feynman (1972); Kleinert (1990) In many-body problems, the configuration space of the classical isomorph is usually sampled by Monte Carlo or molecular dynamics (MD) techniques. Here, we have employed the PI MD method, which has been found to require less computer time resources when applied to our problem. Effective algorithms to perform PI MD simulations in the canonical ensemble have been described in detail by Martyna et al.Martyna et al. (1996) and by Tuckerman.Tuckerman (2002b) The extensions for PI MD simulations in the ensemble require the definition of appropriate dynamical equations of motion to include the volume as fluctuating dynamical variable, and multiple time step algorithms to integrate these equations numerically. These extensions are well documented in Refs. Martyna et al., 1999; Tuckerman and Hughes, 1998; Tuckerman et al., 2006. For the simulation of 3C-SiC in the ensemble only isotropic volume fluctuations were allowed. All calculations presented here were carried out using originally developed software, which enables efficient PI MD simulations on parallel supercomputers.
Simulations were performed on a supercell of the 3C-SiC face-centered cubic cell with periodic boundary conditions, containing 64 atoms. Convergence criteria used previously for diamond were proved to apply also for the 3C-SiC simulations. Thus, we used only the point for the sampling of the Brillouin zone (BZ) of the simulation supercell in the electronic structure calculation. A set of 4 points would increase the computer time by a factor of 10 without significant changes of the results presented here. For a given temperature, a typical run consisted of MD steps for system equilibration, followed by steps for the calculation of ensemble average properties. To have a nearly constant precision in the path integral results at different temperatures, we have taken a number of beads, (Trotter number), that scales with K. The atomic masses of C and Si were set to 12.011 and 28.086 amu, respectively. Within the employed formalism, the classical limit of a given nucleus is reached by setting the corresponding nuclear mass tending to infinity. Thus, for comparison with the results of our full PI MD simulations, we have carried out some PI MD simulations were the mass of either C or Si was set to a very large number ( amu). The main effect of setting such a large nuclear mass in the path integral simulation is that the ring polymer associated to the atomic nucleus shrinks and looks just like a point (classical) particle. Moreover, the calculation of thermostatted equations of motion by using chains of Nosé-Hoover thermostats (see below) ensures that the canonical probability distribution of the shrinked classical-like particles is correctly sampled as a function of temperature. Also classical MD simulations were performed with the same interatomic interaction. The classical limit is easily achieved within the PI algorithm by setting the Trotter number = 1.
The quantum simulations were performed using a staging transformation for the bead coordinates. Chains of four Nosé-Hoover thermostats were coupled to each of the staging variables to generate the canonical ensemble. Tuckerman and Hughes (1998) To integrate the equations of motion we have used the reversible reference system propagator algorithm (RESPA), which allows one to define different time steps for the integration of the fast and slow degrees of freedom.Martyna et al. (1996) For the evolution of the fast dynamical variables, that include the thermostats and harmonic bead interactions, we used a time step , where is the time step associated to the calculation of TB forces. A value of = 0.5 fs was found to provide adequate convergence. The thermostat “mass” parameter, , is chosen to evolve in the scale of the harmonic bead forces by being defined asTuckerman and Hughes (1998)
| (1) |
where = represents the inverse temperature. In the case of the ensemble a chain of four barostats was coupled to the volume and the barostat “mass” parameter was set 100 times larger than the thermostat one. By calculating the average pressure in the ensemble we could check the internal consistency between our and simulations. The pressure estimator used in the ensemble is given in Appendix B. The direct electronic gap of 3C-SiC was derived as
| (2) |
where and are the ensemble average of the one-electron states associated with the bottom of the conduction band and the top of the valence band at the () reciprocal lattice point. For details on the calculation of the expectation values and see Ref. Ramírez et al., 2006.
Several sets of simulations were performed in this work. Two sets of 3C-SiC simulations were done at temperatures between 100 and 1200 K. One set corresponds to simulations at constant pressure (=0), and the other to simulations at constant volume ( Å). Another set of simulations was made at room temperature ( K) and pressures in the range between -10 and 60 GPa. Additional constant volume simulations were done for diamond and Si as a function of temperature.
III Results and Discussion
The results derived from our PI MD simulations are presented in the next subsections. Firstly, we focus on the temperature dependence of the cell parameter and the linear expansion coefficient at zero pressure.
III.1 Thermal expansion
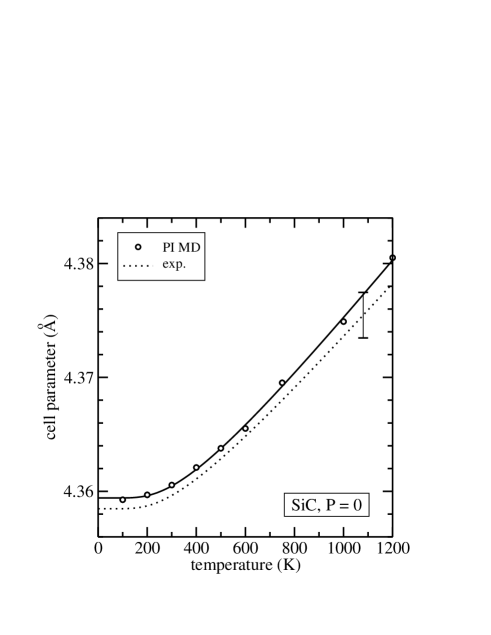
The temperature dependence of the cell parameter, , of 3C-SiC at zero pressure is presented in Fig. 1. The simulation results are plotted as open circles. The dotted line is derived from the recommended experimental values of the linear expansion coefficient of 3C-SiC by a numerical integration.Slack and Bartram (1975) The resulting relative changes in the cell parameter, , were converted to an absolute scale by using the experimental value of Å at 297 K. Madelung (1982) Both simulation and experimental data were fitted with a standard Bose-Einstein expressionCardona (2005)
| (3) |
the values of the fitted parameters are summarized in Table 1. The results in Fig. 1 show that the simulations and experimental data agree within the uncertainty of the experimental values. At temperatures below 600 K the calculated cell parameter shows a rigid shift with respect to experiment of about Å toward larger values. This shift increases slightly at higher temperatures. The most plausible explanation for this high temperature deviation of simulated data from experiment is that the employed TB model overestimates the anharmonicity of the interatomic potential when the amplitude of nuclei vibrations is activated thermally to values significantly larger than low temperature zero-point motions.
| (Å) | (ÅK | (Å) | (K) | |
|---|---|---|---|---|
| PI MD | 4.3463 | - | 0.0131 | 975.7 |
| exp. | 4.3475 | - | 0.0110 | 898.0 |
| PI MD (Si cla.) | 4.3458 | 1.0 10-5 | 0.0097 | 1077.2 |
| PI MD (C cla.) | 4.3451 | 1.1 10-5 | 0.0077 | 921.7 |
| (Å) | (ÅK-1) | (ÅK | (ÅK | |
| classical MD | 4.3483 | 2.1 10-5 | 6.4 10-9 | -2.3 10-12 |
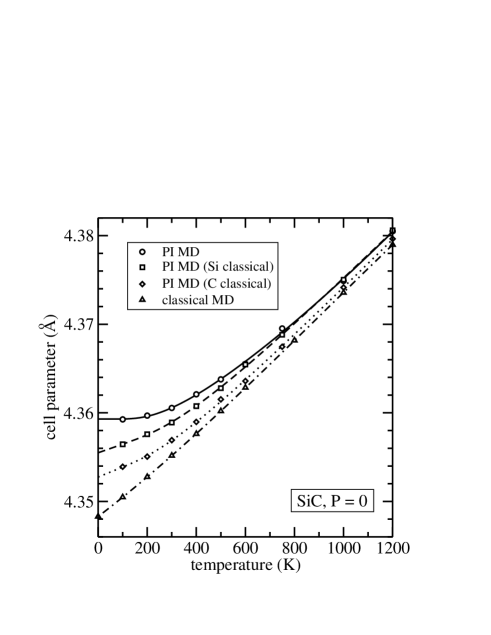
It is interesting to quantify the renormalization of the cell parameter as a consequence of the quantum character of the atomic nuclei by comparison to results of classical simulations. Moreover, the employed formalism allows us to treat the atomic nuclei either quantum mechanically or in the classical limit just by tuning the nuclear mass. Thus, we have also calculated the effect in of considering only one type of nuclei classically. The results of these simulations are presented in Fig. 2. The full PI MD results (circles) are compared to classical MD simulations (triangles). While the classical calculations yield a finite linear expansion for tending to zero, the quantum PI MD calculations yield cell parameters which become independent of at low , in agreement with the experimental results. The quantum PI MD results that selectively treat the Si or the C nuclei as classical particles are shown by squares and diamonds, respectively. The lines represent numerical fits to the simulation results. The classical MD data were fitted with a cubic function,
| (4) |
while the PI MD simulation results treating either the Si or C nuclei classically were fitted to Eq. (3) plus an additional linear term, , to account for the finite slope of the curves at . The values of the fitted coefficients are summarized in Table 1.
The cell parameter amounts to 4.3483 Å while the extrapolated value of the PI MD simulation is = 4.3594 Å. Therefore the zero-point renormalization of the cell parameter of 3C-SiC amounts to (). This value is slightly lower than the average () of the zero-point renormalization of diamond () and Si () derived from experiments on crystals with different isotopic masses.Cardona and Thewalt (2005)
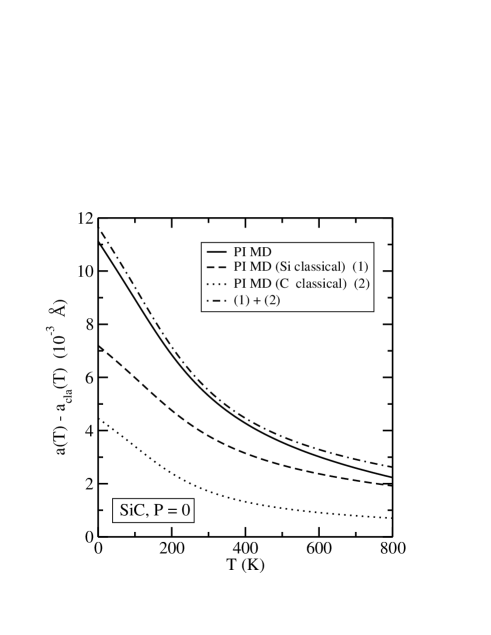
The curves where either the C or Si nuclei are treated classically provide evidence for the linear character of the renormalization of the lattice parameter. This fact is clearly seen in Fig. 3, where the absolute values of the cell parameter renormalization, , are represented up to 800 K. We observe that the sum of the cell parameter renormalizations obtained when either the Si or C nuclei are treated quantum mechanically is nearly identical to the total renormalization obtained in the full PI MD simulations. This linear behavior is probably related to the fact that the cell parameter renormalization is relatively small, so that in terms of perturbation theory it can be realistically described by second-order terms in the atomic displacements.
The recommended experimental values of the linear thermal expansion, , of 3C-SiC are shown in Fig. 4 as closed circles. Error bars represent the uncertainty of the experimental results. The simulation results presented in Fig. 4 were derived from the fits shown in Fig. 2 for . The agreement between our PI MD results for and the experimental data is satisfactory in the whole temperature range. The largest deviation is found at temperatures above 700 K where the thermal expansion of 3C-SiC is overestimated by about 8% by our model. Although the deviation between PI MD simulated results and measured data is well within the experimental error bar, we stress that the TB model seems to overestimate the anharmonicity of the interatomic potential at temperatures above 600 K. The thermal expansion coefficient obtained in the classical MD simulations at a given temperature is always larger than the corresponding PI MD value. This behavior is expected from the fact that the classical thermal expansion is finite in the zero-temperature limit (while it vanishes in the quantum case) and from the consideration that both sets of simulations should converge one to the other at high enough temperatures. Note that the deviation from experiment is always larger for classical than for quantum simulations, while the PI MD results where either the Si or the C nuclei are treated as classical particles lie between both limits. The classical simulation results presented in Fig. 4 have required to add higher-order terms to the cubic fit given by Eq. (4) at temperatures above 800 K.
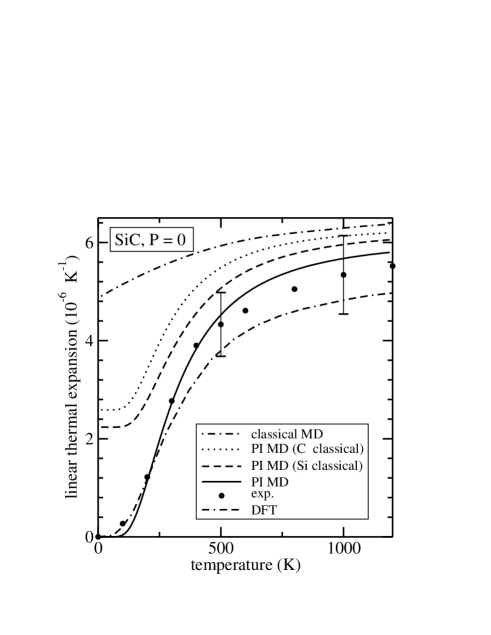
The quality of our results is comparable to previous calculations of by using either ab initio DFT electronic HamiltoniansKarch et al. (1994) or phenomenological modelsTalwar and Sherbondy (1995) to determine harmonic vibrational frequencies and a quasiharmonic approximation to take into account the anharmonicity of the interatomic potential. The DFT result of Ref. Karch et al., 1994 has been plotted in Fig. 4. The deviation from experimental data found at high temperature is probably caused by anharmonic effects not taken into account by the quasiharmonic approximation.
III.2 Direct electronic gap
The one-electron energies derived by the TB model for 3C-SiC at the symmetry point are compared to results of linear muffin-tin-orbital calculationsWillatzen et al. (1995) and empirical pseudopotential methodHemstreet, Jr. and Fong (1972) in Table 2. These energies are obtained with the atoms fixed in their crystallographic positions and thus neglect the effects of lattice vibrations. The employed TB model predicts that the first direct gap, , of 3C-SiC at appears between electronic states with symmetry. This fact is in contradiction with the other electronic Hamiltonians that show that the conduction band bottom is of symmetry at .Willatzen et al. (1995); Hemstreet, Jr. and Fong (1972) In the case of diamond and Si the bottom of the conduction band at is found to be of symmetry by ab initio calculations.Painter et al. (1971); Tejedor and Vergés (1979) The repulsion between the valence band and the conduction band, induced by the asymmetric potential, is probably responsible for the lowering of the conduction band with respect to the counterpart in SiC. Although the employed TB model does not provide an accurate description of the conduction bands, it has demonstrated, by the study of the direct gap of diamond, that is a realistic starting model to study electron-phonon interaction effects.Ramírez et al. (2006)
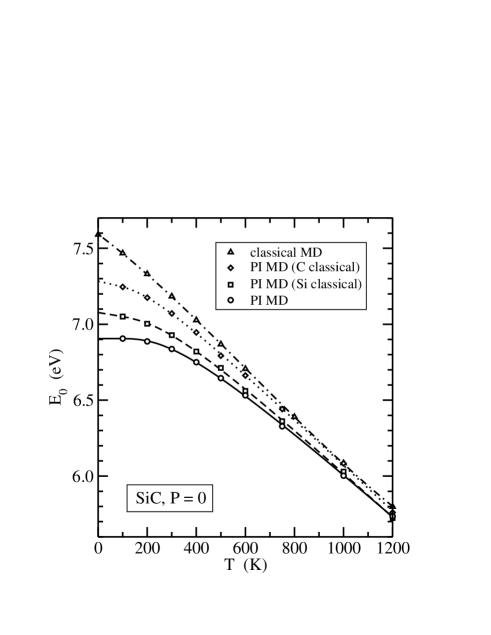
The temperature dependence of the direct gap, , derived by our simulations of 3C-SiC is shown by circles in Fig. 5. The continuous line represents a fit of to the Bose-Einstein expression
| (5) |
The extrapolated value of amounts to 6.9 eV, while at 300 K the gap is reduced to 6.84 eV, and at 1000 K amounts to 6 eV. The decrease of with temperature is an effect of the electron-phonon interaction, and therefore it is expected to depend on the amplitude of the nuclei displacements. To assess this point, the results obtained for by treating either the Si or the C nuclei as classical particles are presented in Fig. 5 as squares and diamonds, respectively. In both cases the results were fitted to Eq. (5) with an additional linear term, , to account for the finite slope at . The fitted parameters are summarized in Table 3. The results of classical MD simulation for are given by triangles in Fig. 5, while the dashed-dotted line is a cubic fit as in Eq. (4). The classical simulation predicts eV, thus the zero-point renormalization of the direct energy gap, , amounts to –0.69 eV, which is roughly 10% of the value of the gap. The zero-point renormalization in 3C-SiC is similar to that found for diamond by either PI MD simulationsRamírez et al. (2006) or by perturbation theory.Zollner et al. (1992)
| (eV) | (eV K | (eV) | (K) | |
|---|---|---|---|---|
| PI MD | 7.548 | - | 0.643 | 887.2 |
| PI MD (Si cla.) | 7.578 | -2.7 10-4 | 0.501 | 817.9 |
| PI MD (C cla.) | 7.646 | -3.6 10-4 | 0.363 | 615.7 |
| (eV) | (eV K-1) | (eV K | (eV K | |
| classical MD | 7.593 | -12.1 10-4 | -6.2 10-7 | 3.2 10-10 |
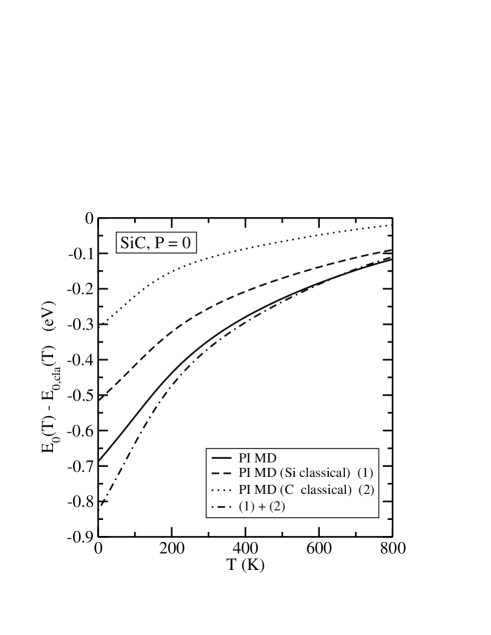
The temperature dependence of the direct gap renormalization, is shown in Fig. 6 by a full line. The separate Si contribution to the gap renormalization is obtained by a simulation where the C nuclei are treated classically. This result is shown by a dotted line in Fig. 6. The dashed line represents the separate C contribution as derived from a simulation with classical Si nuclei. The sum of both Si and C increments (dashed-dotted line) is somewhat larger than the gap renormalization obtained in the full quantum simulation of 3C-SiC, in particular at temperatures below 250 K, where the gap renormalization reaches its largest values. This non-linear behavior of is in contrast to the linear one found for the lattice parameter renormalization, , in Fig. 3. This non-linearity is probably related to the fact that the relative gap renormalizations are found to be much larger than the relative cell parameter renormalizations. In terms of perturbation theory, the fact that the total gap renormalization is lower that the separate Si and C contributions, implies that fourth-order terms in the nuclei displacements are important for , and their contribution is of opposite sign to the leading second-order terms.
| (eV) | (eV K | (eV) | (K) | |
|---|---|---|---|---|
| PI MD | 7.461 | - | 0.555 | 876.4 |
| PI MD (Si cla.) | 7.442 | -2.3 10-4 | 0.379 | 722.6 |
| PI MD (C cla.) | 7.508 | -3.2 10-4 | 0.252 | 517.5 |
| (eV) | (eV K-1) | (eV K | (eV K | |
| classical MD | 7.541 | -11.8 10-4 | -4.2 10-7 | 2.4 10-10 |
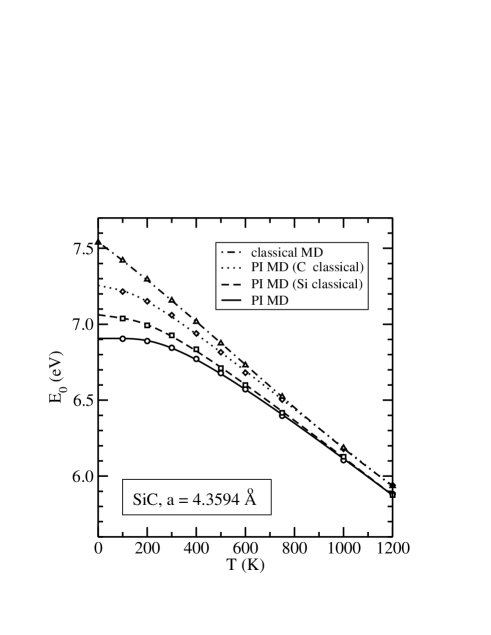
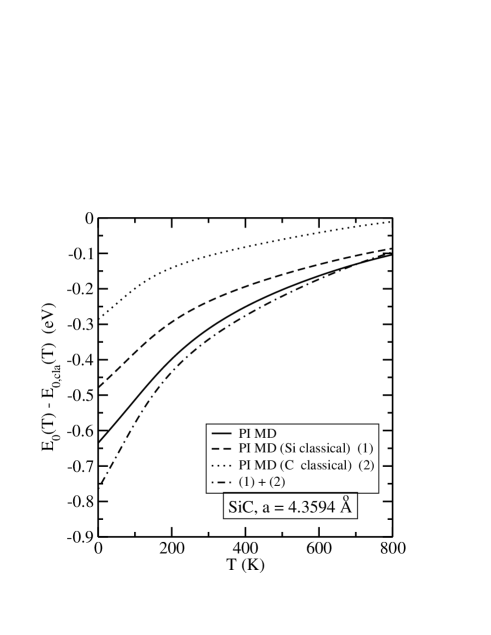
The conclusion that fourth-order terms in the gap renormalization are not related to changes in the cell parameter is further demonstrated by the results shown in Figs. 7 and 8, where we show the values of the direct gap, , and gap renormalizations, , derived at constant volume by simulations. The volume was kept fixed at the equilibrium value of the cell parameter ( Å) extrapolated for from our PI MD simulations (see Fig. 1). The direct gap, , in Fig. 7 is presented for the full PI MD simulation, the classical MD simulation, and PI MD simulations treating either the Si or the C nuclei as classical particles. For each case numerical fits to the simulation results were performed in the same way as explained for the zero-pressure results in Fig. 5. The fitted parameters are summarized in Table 4. The gap renormalizations, , in Fig. 8 show that non-linear effects appear again at temperatures below 250 K in the case of constant volume simulations. Note that the comparison between Figs. 6 and 8 reveals that non-linear effects in the gap renormalization are independent of the volume.
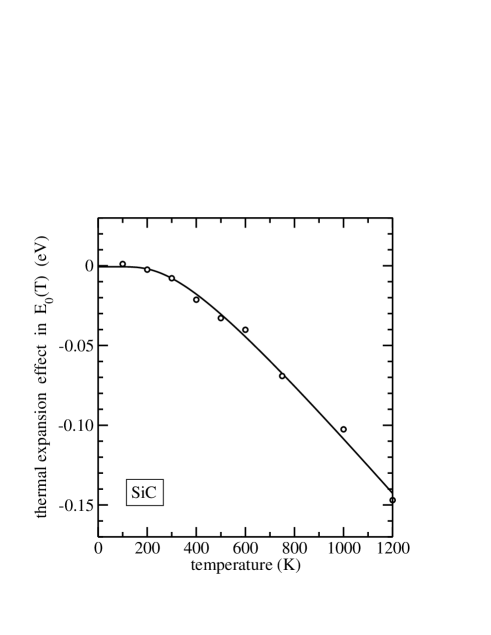
The difference between the values of obtained in our PI MD simulations at (Fig. 5) and at constant volume (Fig. 7) allows us to quantify the thermal expansion effect in the gap. This difference is shown in Fig. 9 as a function of temperature. We note that the thermal expansion produces a decrease in the value of as temperature increases. At 300 K this decrease amounts to only 8 meV, while at 1000 K, the decrease rises to a value slightly less than 110 meV. These values should be compared to the total effect of temperature in the direct gap, , which amounts to 64 meV at 300 K and to 900 meV at 1000 K, as derived from the PI MD results shown in Fig. 5. Thus, the thermal expansion is responsible for about 10 % of the total decrease in the value of at temperatures of 300 and 1000 K.
III.3 Comparison of for diamond, 3C-SiC and Si
It is interesting to compare the simulation results of the direct gap found for 3C-SiC with those corresponding to diamond and Si by using the same tight-binding parameterization. The studied direct gap, , for both diamond and Si corresponds to transitions between one-electron states with symmetry (valence band) and (conduction band). To prevent possible inaccuracies of the TB model in the determination of the thermal expansion of diamond and Si, we have performed constant volume simulations of diamond and Si with the following values of the cell parameters, Å for diamondKaiser and Bond (1959) and Å for Si.Reeber (1975) Our simulation results of in diamond, 3C-SiC, and Si will be also compared to available experimental data. Note that in this comparison the thermal expansion effect in is not included in our constant volume simulations.
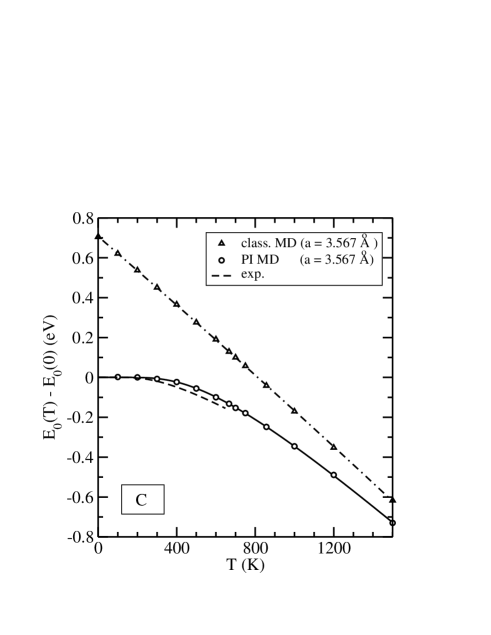
In Fig. 10 we show the results of the PI MD and classical MD simulations for the relative shifts of the direct gap of diamond with temperature. The lines through the points correspond to numerical fits using Eqs. (5) and (4), respectively. The fitted parameters are summarized in Table 5. The zero-point renormalization of amounts to 0.705 eV, a value that agrees well with the result of 0.678 eV derived by Zollner et al. in Ref. Zollner et al., 1992 by a perturbational treatment of the electron-phonon coupling. Unfortunately there is no experimental estimation of the renormalization of the direct gap, , of diamond. However, the zero-point renormalization of the indirect gap of diamond derived from luminescence data amounts to 0.37 eV.Cardona (2005) The broken line shown in Fig. 10 is the experimental result reported in Ref. Logothetidis et al., 1992 for diamond IIa, based on measurements of the complex dielectric function by spectroscopic ellipsometry between 100 to 650 K. The extrapolated experimental value varies from 7.06 to 7.14 eV, depending on the line-shape analysis of the spectra by using a first or a second derivative. The TB model gives a value of eV in good agreement with experiment. The slope of the PI MD results at temperatures above 500 K is larger than that of the experimental data, a fact that indicates that the employed TB model overestimates the electron-phonon interaction at temperatures above 500 K.
| (eV) | (eV) | (K) | |
|---|---|---|---|
| PI MD C (=3.567 Å) | 7.802 | 0.740 | 1665.0 |
| PI MD 3C-SiC (=4.3594 Å) | 7.461 | 0.555 | 876.4 |
| PI MD Si (=5.4296 Å) | 3.511 | 0.204 | 513.6 |
| exp. C111Logothetidis et al., Ref. Logothetidis et al.,1992 | 7.387 | 0.320 | 1060.0 |
| exp. 3C-SiC222Petalas et al., Ref. Petalas et al.,1998 | 7.943 | 0.230 | 668.0 |
| exp. Si333Jellison and Modine, Ref. Jellison Jr. and Modine,1983 | 3.467 | 0.091 | 382.6 |
| exp. Si444Lautenschlager et al., Ref. Lautenschlager et al.,1987 | 3.378 | 0.025 | 267.0 |
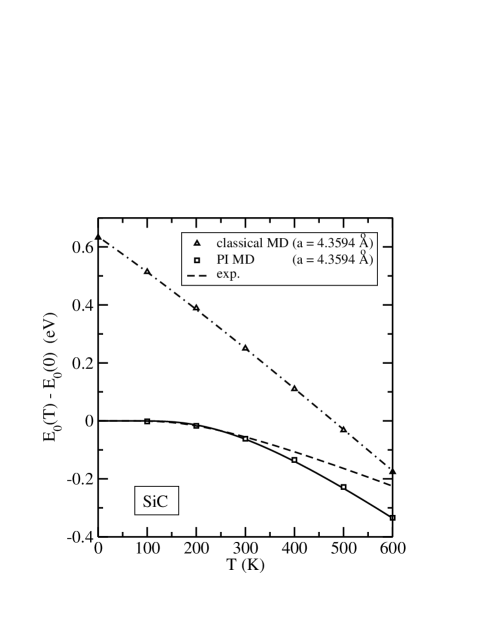
In Fig. 11 we compare the relative shifts of the direct energy gap of 3C-SiC obtained by our PI MD and classical MD simulations (circles and triangles, respectively) to a fit to the experimental data derived between 90 and 550 K by spectroscopic ellipsometry. The experimental data can not discriminate between interband electronic transitions occurring at the points (critical point ), and along (critical point ) in reciprocal space, as they appear in the same energy region. The fitted parameters are summarized in Table 5. The comparison to experiment shows that our computational model tends to overestimate the shift in the energy gap.
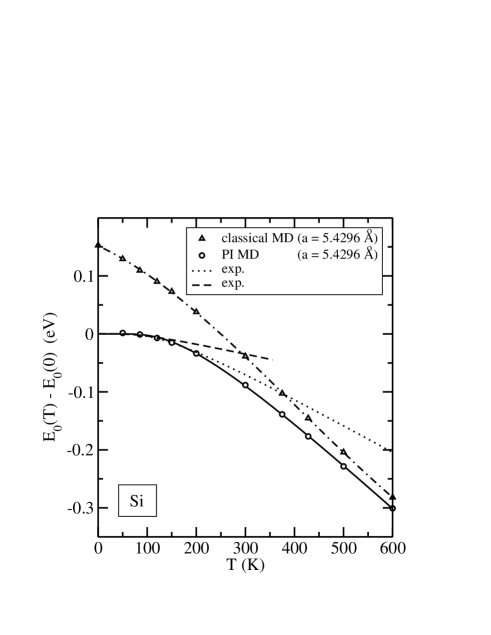
The simulation results for the temperature shift of the direct electronic gap of Si are compared to available experimental data in Fig. 12. The dashed line represents the numerical fit to the spectroscopic ellipsometric data of Lautenschlager et al.,Lautenschlager et al. (1987) while the dotted line is derived by polarization modulation ellipsometry.Jellison Jr. and Modine (1983) The difference between both sets of experimental data might be due to the fact that the measured excitations are a superposition of interband transitions (, ) along the direction that includes both the and points at its boundary. Fitted parameters are collected in Table 5. The extrapolated PI MD value of amounts to 3.31 eV, in reasonable agreement to the experimental extrapolated results of 3.35 eV,Lautenschlager et al. (1987) and 3.38 eV.Jellison Jr. and Modine (1983) The calculated zero-point renormalization of amounts to 0.15 eV. This result is to be compared to the experimental value of 0.120.02 eV derived by Lastras-Martínez et al. from a study of isotopically pure and natural Si.Lastras-Martínez et al. (2000) This experimental value has to be considered as a mixture of and transitions. The temperature shifts in derived from our PI MD simulations appear again to be larger than in the experimental data, pointing toward an overestimation of the electron-phonon interaction by the employed electronic TB Hamiltonian.
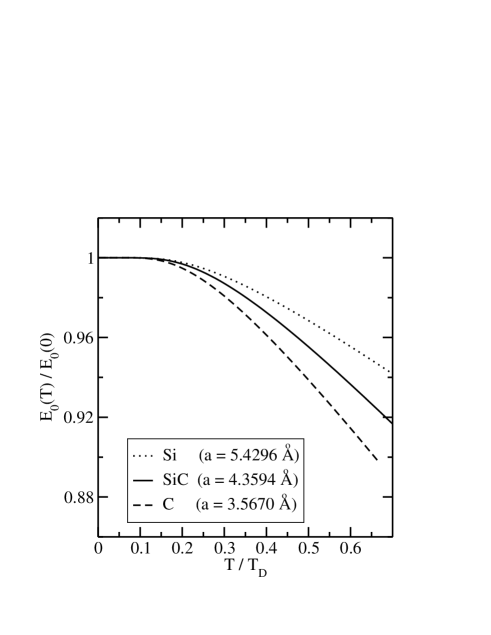
In order to compare the effects of the electron-phonon interaction in the direct gap, , of diamond, 3C-SiC, and Si, we have plotted in Fig. 13 the simulation results of using relative energy and temperature scales. For each crystal the energy was measured in units of its direct gap and the temperature in units of the corresponding Debye temperature. We see that by using reduced units the direct gap of 3C-SiC falls roughly between the values found for diamond and Si in the studied temperature range. It has been recently shown that at very low temperatures (below 10 K for Si) the gap changes with like .Cardona et al. (2004) Our calculations, however, do not have the necessary accuracy to reveal this dependence.
III.4 Pressure dependence of in 3C-SiC
The pressure dependence of the direct gap of 3C-SiC at 300 K was derived from simulations in the ensemble up to 60 GPa. The results of the quantum PI MD and classical simulations are shown in Fig. 14. The main difference between both sets of results is a rigid shift of the values, that reflects the dependence of the electron-phonon coupling on the nuclei displacements around the equilibrium positions. At a given pressure, the vibrational amplitudes are always larger for the quantum simulations. The cell parameter difference, versus , has a relatively smaller effect in the shift of . For example, at the quantum result for the direct gap is 0.35 eV lower than the classical one (see Fig. 14), a value that includes the effect of the volume difference in the quantum and classical simulations. The corresponding result obtained at a constant volume at 300 K is 0.31 eV (see Fig. 7).
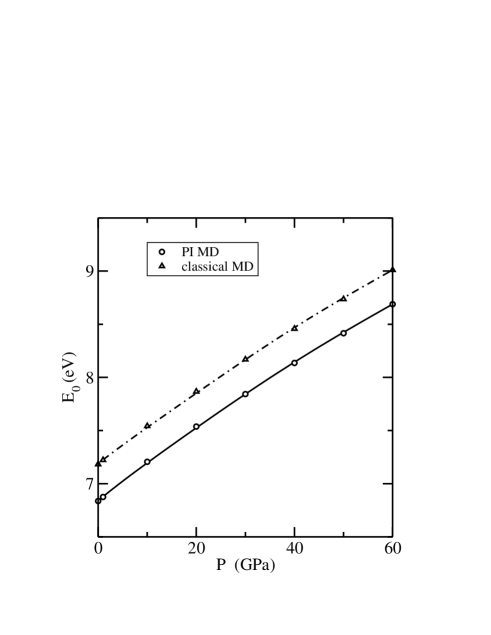
The derivative, , at is readily obtained from the data in Fig. 14, giving a result of 39 meV/GPa in the quantum case versus a value of 41 meV/GPa in the classical limit at 300 K. These values are in reasonable agreement with the calculation of Park et al.,Park et al. (1994) which gives a value of 51 meV/GPa, based on ab initio calculations using a local-density-functional approximation (LDA) without considering any kind of temperature effect.
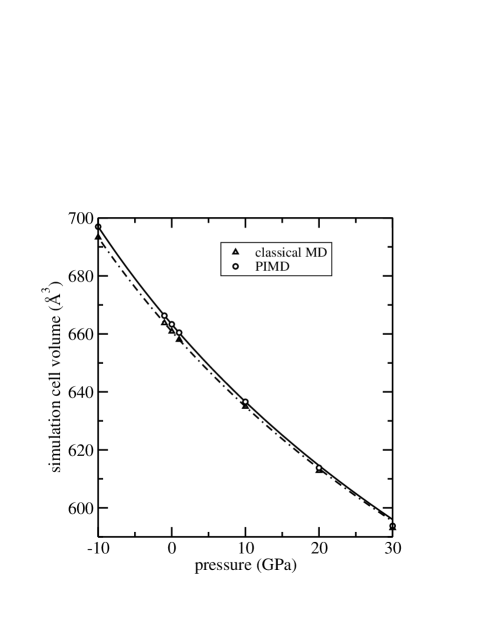
Finally, the set of simulations performed at 300 K allows us to plot curves that can be used to derive the value of the bulk modulus, , and its pressure derivative, , for 3C-SiC. In Fig. 15 we show the curves obtained from simulations of 3C-SiC for several pressures in the range between -10 and 30 GPa. The five points calculated in the pressure interval [-10,10] GPa were used to fit a Murnaghan equation of stateMurnaghan (1944)
| (6) |
where the subindex 0 indicates values at . The continuous line in Fig. 15 shows the fit to the PI MC simulations, that provides the values =225 GPa and . We checked that this value of is consistent with that ( GPa) derived by calculating the volume fluctuations in the ensemble at . The fluctuation relation for a given pressure is
| (7) |
The calculated value of is in excellent agreement with the experimental data,Aguado and Baonza (2006); Lambrecht et al. (1991); Carnahan (1968) and also the calculated value of agrees with experiment ().Strösssner et al. (1987) The values obtained from the Murnaghan fit of the classical simulation results were =230 GPa and .
IV Conclusions
The simulation method employed in this work has demonstrated its capability for the description of anharmonic effects related to the phonon-phonon interaction, as well as for the treatment of the electron-phonon coupling in semiconducting solids as a function of temperature. Thus, this type of simulations is an alternative to perturbational treatments, with the advantage of being also applicable in cases where the convergence of a perturbational series might be slow. A prerequisite to account for phonon-phonon and electron-phonon interactions is a quantum description that includes both electrons and nuclei. In this respect, the Feynman formulation of statistical mechanics allows us to simulate the quantum mechanical properties of the atomic nuclei in the solid at finite temperatures with either Monte Carlo or Molecular Dynamics techniques. A particular advantage of PI MD is that the algorithm can be easily parallelized, as the calculation of total energies and forces for each of the different replicas of the solid, that are generated by the discretization of the path integral (Trotter number), can be run in a different processor. The use of an electronic Hamiltonian to describe the interatomic interactions in the solid allows us to study also electronic properties in the simulations. At present we have limited ourselves to simplified, although accurate, Hamiltonians of the tight-binding type. But in the future, an interesting improvement will be the combination of PI with ab initio parameter-free Hamiltonians.
The PI MD simulation of 3C-SiC has been able to reproduce different experimental properties of the solid. Moreover, the comparison to classical simulations allowed us to evaluate the magnitude of quantum effects as a function of temperature, as well as to determine the separate contribution of each type of nuclei (either C or Si) to several properties. The employed potential model predicts a cell parameter as a function of temperature, , in good agreement with the available experimental data. The correct description of this anharmonic property points toward a realistic treatment of the phonon-phonon interactions by our computational model. The main discrepancy is found at temperatures above 600 K, where the linear expansion coefficient is predicted to be about 8% larger than the experimental one. The zero-point renormalization of the cell parameter of 3C-SiC is calculated to be (). We find that this value is close to the sum of zero-point renormalizations obtained when only one type of atomic nuclei (either Si or C) is treated quantum mechanically. This near linear behavior is probably related to the fact that the cell parameter renormalization depends only on second-order terms in the nuclei displacements, due to the small magnitude of .
The direct electronic gap at of 3C-SiC has a significant temperature dependence as a consequence of the electron-phonon coupling. The effect of the zero-point vibrations of the lattice phonons leads to a gap renormalization of eV (). This effect is so large that any theoretical approach aiming at a quantitative determination of the direct electronic gap can not be based only on an improved solution of the many-body electron problem, but it should also include the treatment of the electron-phonon interaction. The calculated relative value of the zero-point renormalization is . In this case, the sum of the separate Si and C contributions is found to be lower than the total zero-point renormalization. This non-linear behavior suggests that fourth-order terms in the nuclei displacements are important in this case, as a result of the large value of . The ratio of the partial contributions of C and Si to the zero-point gap renormalization is 1.67 at . This is rather close to the inverse square root of the ratio of the corresponding masses . The latter represents the ratio of squares of zero-point vibrational amplitudes, under the assumption of equal force constants, in the harmonic approximation. The calculated pressure coefficient of is 39 meV/GPa at 300 K. An ab initio calculation without considering temperature and electron-phonon interactions gives a value of 51 meV/GPa. Our calculation of the bulk modulus of 3C-SiC at 300 K ( GPa) and its pressure derivative () shows quantitative agreement with experiment.
The calculated zero-point renormalization of the direct gap at of diamond and Si amounts to 0.7 eV and 0.15 eV, respectively. For Si the renormalization derived from spectroscopic ellipsometry of isotopic crystals amounts to 0.120.02 eV.Lastras-Martínez et al. (2000) The experiment can not discriminate between direct transitions at and along , as they appear at similar energies. In the case of diamond, a calculation based on perturbation theory results in a value of the direct gap renormalization of 0.68 eV,Zollner et al. (1992) in good agreement with our non-perturbational result. The experimental value for the renormalization of the indirect gap of diamond amounts to 0.37 eV.Cardona (2005) The comparison of the simulation results of diamond, 3C-SiC and Si with available experimental data shows that the employed model Hamiltonian tends to overestimate the decrease of with temperature, i.e., the electron-phonon coupling in the employed TB model seems to be too strong. This fact is another motivation for improving the electronic model in future work.
Acknowledgements.
The calculations presented here were performed at the Barcelona Supercomputing Center (BSC-CNS). This work was supported by CICYT through Grant No. FIS2006-12117-C04-03 and by CAM through project S-0505/ESP/000237. ERH thanks DURSI (regional government of Catalonia) for funding through project 2005SGR683.Appendix A Pair potential for Si-C
The pair-potential is parameterized by using the following functional formPorezag et al. (1995)
| (8) |
where is the interatomic Si-C distance, =4.4 au, and if . The original coefficients were modified to decrease the anharmonicity of the Si-C potential at distances around 3.55 au, that corresponds to the nearest-neighbors in 3C-SiC. The modified coefficients are (in au): , , , , , , , , . The procedure to fix the coefficients was to calculate curves of internal energy versus volume in the classical limit at , i.e., the atoms occupy fixed equilibrium positions at a given volume. The Taylor expansion of the internal energy around its minimum at can be expressed as
| (9) |
with , and , and being the bulk modulus and its pressure derivative in the classical limit at and . The values used in this expansion were = 245 GPa, = 4, and Å. The original analytic form of was modified to obtain a reasonable approximation to the curve in Eq. (9) for a range of volumes defined by a cell parameter in the interval au.
Appendix B Pressure estimator in the ensemble
The cartesian coordinates of the atomic nuclei in the crystal are denoted as , where the superscript runs from 1 to . The subindex denotes the “bead” associated to a given atomic nucleus and runs from 1 to the Trotter number . The staging coordinates are defined by a linear transformation of that diagonalizes the harmonic energy between neighboring beadsTuckerman and Hughes (1998); Tuckerman (2002b)
| (10) |
| (11) |
The pressure estimator in our PI MD simulation is obtained as
| (12) |
where and represent the dynamic mass and velocity associated to the staging coordinate . These masses are given asTuckerman and Hughes (1998); Tuckerman (2002b)
| (13) |
| (14) |
where is the nuclear mass associated to coordinate . represents the harmonic energy between beads, that in terms of the stagging coordinates is written as
| (15) |
The last summand in Eq. (12) represents the volume derivative of the potential energy of the crystal for the nuclei configuration . We have performed this derivative numerically by considering an expansion of Å in the cell parameter, , of the simulation cell, although it is also possible to calculate this derivative from the stress tensor, obtained through the Hellman-Feynman theorem. The fractional coordinates, , of the nuclei remain constant along this volume expansion, implying that all cartesian coordinates, , must change according to the modified value of .
References
- Matsunami (2006) H. Matsunami, Microelec. Eng. 83, 2 (2006).
- Silicon Carbide and Related Materials 2001 (2002) Silicon Carbide and Related Materials 2001, in Materials Science Forum Vol. 389-393, edited by S. Yoshida, S. Nishino, H. Harima, and T. Kimoto (Trans Tech., Zurich, Switzerland, 2002), and references therein.
- Olego et al. (1982) D. Olego, M. Cardona, and P. Vogl, Phys. Rev. B 25, 3878 (1982).
- Olego and Cardona (1982) D. Olego and M. Cardona, Phys. Rev. B 25, 3889 (1982).
- Debernardi et al. (2001) A. Debernardi, C. Ulrich, M. Cardona, and K. Syassen, phys. stat. sol (b) 223, 213 (2001).
- Karch et al. (1996) K. Karch, F. Bechstedt, P. Pavone, and D. Strauch, J. Phys.: Condens. Matter 8, 2945 (1996).
- Biernacki and Scheffler (1989) S. Biernacki and M. Scheffler, Phys. Rev. Lett. 63, 290 (1989).
- Sato et al. (2002) T. Sato, K. Ohashi, T. Sudoh, K. Haruna, , and H. Maeta, Phys. Rev. B 65, 092102 (2002).
- Slack and Bartram (1975) G. A. Slack and S. F. Bartram, J. Appl. Phys 46, 89 (1975).
- Talwar and Sherbondy (1995) D. N. Talwar and J. C. Sherbondy, Appl. Phys. Lett. 67, 3301 (1995).
- Karch et al. (1994) K. Karch, P. Pavone, W. Windl, O. Schütt, and D. Strauch, Phys. Rev. B 50, 17054 (1994).
- Petalas et al. (1998) J. Petalas, S. Logotheditis, M. Gioti, and C. Janowitz, phys. stat. sol. (b) 209, 499 (1998).
- Cardona (2001) M. Cardona, phys. stat. sol. (a) 188, 1209 (2001).
- Cardona (2005) M. Cardona, Solid State Commun. 133, 3 (2005).
- Cardona and Thewalt (2005) M. Cardona and M. L. W. Thewalt, Rev. Mod. Phys. 77, 1173 (2005).
- Allen and Cardona (1981) P. B. Allen and M. Cardona, Phys. Rev. B 23, 1495 (1981).
- Zollner et al. (1992) S. Zollner, M. Cardona, and S. Gopalan, Phys. Rev. B 45, 3376 (1992).
- King-Smith et al. (1989) R. D. King-Smith, R. J. Needs, V. Heine, and M. J. Hodgson, Europhys. Lett. 100, 569 (1989), in this unusual work the temperature dependence of the energy gap was calculated by evaluating the effect of an electron-hole excitation on the ensemble of phonons.
- Feynman (1972) R. P. Feynman, Statistical Mechanics (Addison-Wesley, New York, 1972).
- Ceperley (1995) D. M. Ceperley, Rev. Mod. Phys. 67, 279 (1995).
- Marx and Parrinello (1996) D. Marx and M. Parrinello, Science 271, 179 (1996).
- Tuckerman et al. (1997) M. E. Tuckerman, D. Marx, M. L. Klein, and M. Parrinello, Science 275, 817 (1997).
- Ramírez et al. (1998) R. Ramírez, E. Hernández, J. Schulte, and M. C. Böhm, Chem. Phys. Lett. 291, 44 (1998).
- Tachikawa and Shiga (2005) M. Tachikawa and M. Shiga, Chem. Phys. Lett. 407, 135 (2005).
- Shiga et al. (2001) M. Shiga, M. Tachikawa, and S. Miura, J. Chem. Phys. 115, 9149 (2001).
- Chen et al. (2003) B. Chen, I. Ivanov, M. L. Klein, and M. Parrinello, Phys. Rev. Lett. 91, 215503 (2003).
- Della Sala et al. (2004) F. Della Sala, R. Rousseau, A. Görling, and D. Marx, Phys. Rev. Lett. 92, 183401 (2004).
- Ohta et al. (2004) Y. Ohta, K. Ohta, and K. Kinugawa, J. Chem. Phys. 121, 10991 (2004).
- Ramírez et al. (2006) R. Ramírez, C. P. Herrero, and E. R. Hernández, Phys. Rev. B 73, 245202 (2006).
- Herrero et al. (2006) C. P. Herrero, R. Ramírez, and E. R. Hernández, Phys. Rev. B 73, 245211 (2006).
- Mark and Hutter (2000) D. Mark and J. Hutter, in Modern Methods and Algorithms of Quantum Chemistry Proceedings, edited by J. Grotendorst (NIC, FZ Jülich, 2000), p. 301.
- Tuckerman (2002a) M. E. Tuckerman, in Quantum Simulations of Complex Many–Body Systems: From Theory to Algorithms, edited by J. Grotendorst, D. Marx, and A. Muramatsu (NIC, FZ Jülich, 2002a), p. 299.
- Porezag et al. (1995) D. Porezag, T. Frauenheim, T. Köhler, G. Seifert, and R. Kaschner, Phys. Rev. B 51, 12947 (1995).
- Gillan (1988) M. J. Gillan, Phil. Mag. A 58, 257 (1988).
- Kleinert (1990) H. Kleinert, Path Integrals in Quantum Mechanics, Statistics and Polymer Physics (World Scientific, Singapore, 1990).
- Martyna et al. (1996) G. J. Martyna, M. E. Tuckerman, D. J. Tobias, and M. L. Klein, Mol. Phys. 87, 1117 (1996).
- Tuckerman (2002b) M. E. Tuckerman, in Quantum Simulations of Complex Many–Body Systems: From Theory to Algorithms, edited by J. Grotendorst, D. Marx, and A. Muramatsu (NIC, FZ Jülich, 2002b), p. 269.
- Martyna et al. (1999) G. J. Martyna, A. Hughes, and M. E. Tuckerman, J. Chem. Phys. 110, 3275 (1999).
- Tuckerman and Hughes (1998) M. E. Tuckerman and A. Hughes, in Classical & Quantum Dynamics in Condensed Phase Simulations, edited by B. J. Berne, G. Ciccotti, and D. F. Coker (Word Scientific, Singapore, 1998), p. 311.
- Tuckerman et al. (2006) M. E. Tuckerman, J. Alejandre, R. López-Rendón, A. L. Jochim, and G. J. Martyna, J. Phys. A: Math. Gen. 39, 5629 (2006).
- Madelung (1982) O. Madelung, ed., Physics of Group IV Elements and III-IV Compounds; Landolt-Börnstein, New Series, Group III, Vol. 17a (Springer-Verlag, Berlin, 1982).
- Willatzen et al. (1995) M. Willatzen, M. Cardona, and N. E. Christensen, Phys. Rev. B 51, 13150 (1995).
- Hemstreet, Jr. and Fong (1972) L. A. Hemstreet, Jr. and C. Y. Fong, Phys. Rev. B 6, 1464 (1972).
- Painter et al. (1971) G. S. Painter, D. E. Ellis, and A. R. Lubinsky, Phys. Rev. B 4, 3610 (1971).
- Tejedor and Vergés (1979) C. Tejedor and J. A. Vergés, Phys. Rev. B 19, 2283 (1979).
- Kaiser and Bond (1959) W. Kaiser and W. L. Bond, Phys. Rev. 115, 857 (1959).
- Reeber (1975) R. R. Reeber, phys. stat. sol. (a) 32, 321 (1975).
- Logothetidis et al. (1992) S. Logothetidis, J. Petalas, H. M. Polatoglou, and D. Fuchs, Phys. Rev. B 46, 4483 (1992).
- Lautenschlager et al. (1987) P. Lautenschlager, M. Garriga, L. Viña, and M. Cardona, Phys. Rev. B 36, 4821 (1987).
- Jellison Jr. and Modine (1983) G. E. Jellison Jr. and F. A. Modine, Phys. Rev. B 27, 7466 (1983).
- Lastras-Martínez et al. (2000) L. F. Lastras-Martínez, T. Ruf, M. Konuma, M. Cardona, and D. E. Aspnes, Phys. Rev. B 61, 12946 (2000).
- Cardona et al. (2004) M. Cardona, T. A. Meyer, and M. L. W. Thewalt, Phys. Rev. Lett. 92, 196403 (2004).
- Park et al. (1994) C. H. Park, B.-H. Cheong, K.-H. Lee, and K. J. Chang, Phys. Rev. B 49, 4485 (1994).
- Murnaghan (1944) F. D. Murnaghan, Proc. Natl. Acad. Sci. U.S.A. 30, 244 (1944).
- Aguado and Baonza (2006) F. Aguado and V. G. Baonza, Phys. Rev. B 73, 024111 (2006).
- Lambrecht et al. (1991) W. R. L. Lambrecht, B. Segall, M. Methfessel, and M. van Schilfgaarde, Phys. Rev. B 44, 3685 (1991).
- Carnahan (1968) R. D. Carnahan, J. Am. Ceram. Soc. 51, 223 (1968).
- Strösssner et al. (1987) K. Strösssner, M. Cardona, and W. J. Choyke, Solid State Commun. 63, 113 (1987).