Low Temperature Transport and Specific Heat Studies of Nd1-xPbxMnO3 Single Crystals
Abstract
Electrical transport and specific heat properties of Nd1-xPbxMnO3 single crystals for have been studied in low temperature regime. The resistivity in the ferromagnetic insulating (FMI) phase for has an activated character. The dependence of the activation gap on doping has been determined and the critical concentration for the zero-temperature metal-insulator transition was determined as 0.33. For a metallic sample with 0.42, a conventional electron-electron (e-e) scattering term is found in the low-temperature electrical resistivity, although the Kadowaki-Woods ratio is found to be much larger for this manganite than for a normal metal. For a metallic sample with 0.5, a resistivity minimum is observed for = 0.5. The effect is attributed to weak localization and can be described by a negative weak-localization contribution to resistivity for a disordered three-dimensional electron system. The specific heat data have been fitted to contributions from free electrons (), spin excitations (), lattice and a Schottky-like anomaly related to the rare-earth magnetism of the Nd ions. The value of is larger than for normal metals, which is ascribed to magnetic ordering effects involving Nd. Also, the Schottky-like anomaly appears broadened and weakened suggesting inhomogeneous molecular fields at the Nd-sites.
pacs:
71.27.+a, 75.47.Gk, 72.10.Di, 65.40.-bI Introduction
Colossal magnetoresistive manganites (R1-xAxMnO3 ) are known for interesting physical properties and complicated electronic phase diagrams coey ; salamon ; tokura1 ; cnr ; tokura2 . In particular, their intrinsic properties in the low-temperature phases are far from trivial. While many of these properties were known for more than 50 years van , an appreciation of the magnitude of these effects is a more recent development jin . Among the different phases in these manganites the occurrence of a ferromagnetic insulating (FMI) phase poses a difficult problem because the double exchange model predicts only metallic ferromagnetism at low temperature Zener ; Anderson ; degennes . The ferromagnetic insulating behaviour is observed in manganites when the divalent dopant concentration is quite low. At higher dopant concentration, crossing the threshold limit, a ferromagnetic metallic phase (FMM) is usually found. The low-temperature transport properties of manganites have been studied in some detail only in recent years salamon . Urushibara et al. described the temperature dependence of the electrical resistivity in La1-xSrxMnO3 in the composition range of metallic conductivity at low temperature as (T)= (0) + Urushibara . Similar data were reported by Schiffer et al. Schiffer and Snyder et al. Snyder . As pointed out by Kadowaki and Woods kadawaki , a general relationship between the coefficient for the contribution to the resistivity and the square electronic heat-capacity coefficient is obeyed in usual metallic systems. However, in manganites very large ratios are found that are an order of magnitude larger than the Kadowaki-Woods ratio for metals with strong electron-electron (e-e) interactions jaime . This casts doubts on the assumption that the usual electron-electron (e-e) scattering underlies the dependence of the resistivity observed in metallic manganites salamon . In particular, manganites are well known examples for bad metallic behaviour Mayr ; Riva .
Some recent reports find that the manganites have resistivity minima and the resistivity at low temperature is higher than Mott’s maximum metallic resistivity of about 10m cm Kumar ; Rana ; Zhang . According to the scaling theory for disordered electronic systems in 3D metals Lee , the weak localization and electron-electron scattering in presence of strong disorder should influence the electrical conduction in manganites. This type of e-e interaction is described by a negative power law contribution to the resistivity. This contribution has been employed to fit the resistivity data of the intrinsically disordered systems like manganites in recent reports Kumar ; Rana ; Zhang . Among other mechanisms ruling the temperature dependence of the transport properties, the contribution of electron-magnon scattering to the resistivity in manganites poses further problems. In the ground-state, one-magnon processes should not take place because of the half-metallic band-structure of the manganites with a fully polarized band of the electrons at the Fermi level Furu . Additionally, the appearance of a Kondo anomaly in this kind of ferromagnetic compounds with spin-disordered clusters has also been discussed Zhang . This also suggests that there is a need of some modification in the dependence (T)= (0) + to describe the low temperature metallic transport property of manganites.
A new theoretical evolution, mainly triggered by a strong-coupling approach to include the electron-lattice coupling, can now describe the transition between the FMI and FMM with varying doping. Pai et al. pai have recently proposed a new effective low-energy Hamiltonian starting from two qualitatively different coexisting vibronic states at each site of the lattice these being labeled as and . Here vibrons describe a localized Jahn-Teller (JT) polaron and the other vibrons form a broad and dispersive band. Within this approach, the insulating gap in the FMI phase at low temperature is identified as the = 0 electrical gap between the occupied levels and the unoccupied band bottom. In principle, the theory is able to make detailed predictions on the electronic structure and transport properties through the whole range of compositions between the FMI and FMM phase in the perovskite manganites.
These theoretical developments and other experimental findings inspired us to explore the low temperature transport and specific heat properties of mixed-valent manganites. The present analysis is based on experimental data obtained on a series of single-crystals from the Pb doped NdMnO3 system, which is a less studied member of the perovskite manganite familykusters ; ng . From our own earlier studies on these crystals, we presented a tentative phase diagram of Nd1-xPbxMnO3 for wide range of temperature and composition ng1 and some of their physical properties ng1 ; ng2 ; sa05 ; ng06 . In the present investigation, we report further properties of these Nd1-xPbxMnO3 single crystals and a detailed analysis of their low temperature resistivity and specific heat data.
II Experiments
Single crystals of Nd1-xPbxMnO3 were grown by a high temperature solution growth method using PbO/PbF2 as flux, as reported earlier ng . The compositional analysis has been carried out by Energy Dispersive X-ray (EDX) and then substantiated by Inductively Coupled Plasma Atomic Emission Spectroscopy (ICPAES). Resistivity measurements were carried out by the standard four probe method in the range 4-300K. The electrical contacts were generally made on the (100) plane of the single crystal samples. The contact material was a Ag-15 weight In alloy. Magnetoresistance (MR) was measured in similar temperature ranges at 7 T magnetic field. The specific heat measurements were carried out in a physical property measurement system (PPMS model 6000, Quantum Design) from 40 K down to 2 K.
III Results
III.1 Transport
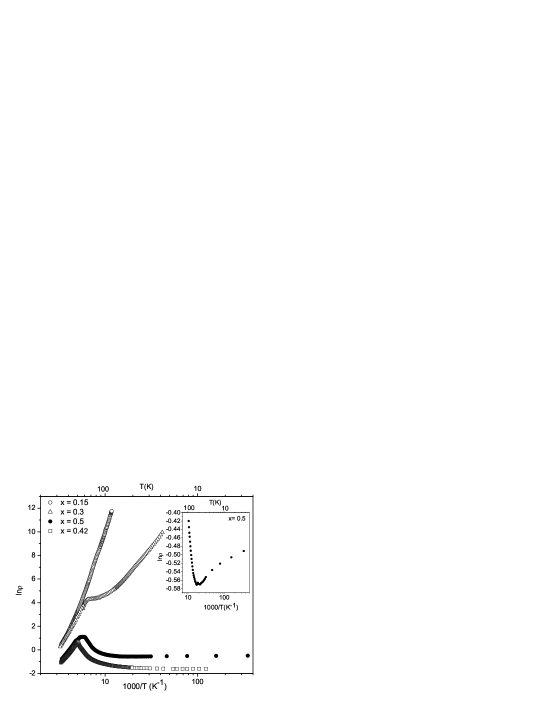
Resistivity data for the Nd1-xPbxMnO3 single crystals were already presented in Ref. ng1 focussing on the metal-insulator (MI) transition at intermediate temperatures around 150 K. The activated behaviour, = , is put into evidence by the logarithmic plot of the resistivity as a function of inverse temperature . This is shown for = 0.15, 0.3, 0.4 and 0.5 in Figure 1. The slopes of the straight sections of the resistivity in this plot measure the activation energy . The crystals with = 0.15 and 0.3 display an activated behaviour in both the paramagnetic and ferromagnetic state, albeit with different activation energies. The activation energy in the high temperature paramagnetic insulating phase can be related to transport through Jahn-Teller(JT) polarons, as discussed in the literature millis . The activation energy depends on and becomes minimum for the most metallic sample close to in our series of crystals ng1 .
For the ferromagnetic insulating samples, the same type of behaviour holds with an activation energy given by a gap energy, , in some temperature range below towards zero temperature. The gap energy , as derived from activated fits, decreases with the dopant concentration . The dependence of the gap energy versus dopant concentration is shown in Figure 2. It can be compared with theoretical predictions. The critical doping for the ferromagnetic insulator to ferromagnetic metal transition is to be determined by the vanishing of . According to the theory of Pai et al. pai a dependence is expected, where is the energy scale for the electron JT-phonon coupling, and is a measure of the electronic band-width of the itinerant electrons of Mn. Fits for the doping dependence of the experimental values of to this square-root behaviour are shown in Figure 2. The values obtained from this fit for and are around 273 () and 493 () meV respectively, when fitting was carried out in = 0.15-0.3 range. On the other hand, the fitting in = 0.2-0.3 range yields and as around 195 () and 339( ) meV respectively. It is observed that the system for dopant concentration = 0.15 is not well fit by the theoretical square-root dependence for . As seen from Figure 2 the experimentally determined value for is appreciably increased. It is probable that at this low doping level further effects increase the apparent activation energy for the electronic transport. The extrapolation of towards a vanishing gap yields a critical doping level for the zero-temperature MI transition. The critical concentration for the zero temperature MI transition in this system has been calculated from the parameters obtained from the fitting excluding the point corresponding to giving a value = = 0.33(). We consider that the fit excluding = 0.15 data provides the more reliable estimate of the critical concentration.
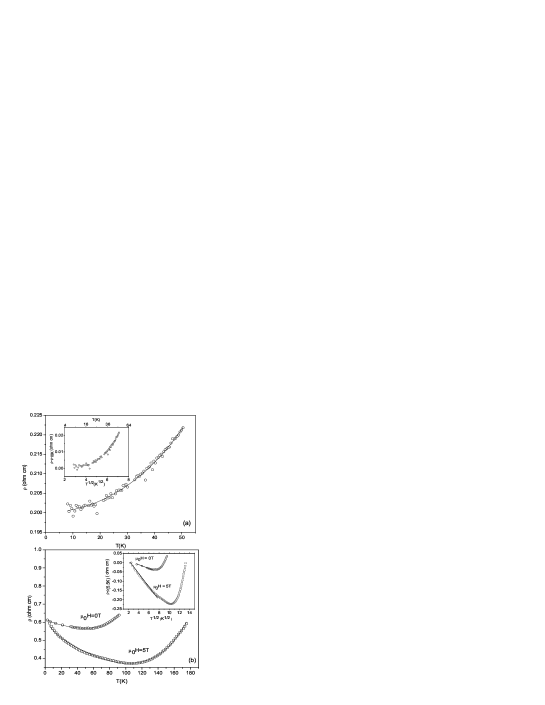
Now, assuming that vanishes for this critical doping level , we can proceed to analyze the transport data for samples with = 0.4, 0.42, 0.5 , which display metallic character at low temperatures. Essentially, = 0.4 and 0.42 show similar behaviour. The resistivity at low temperature can have contributions from residual resistivity due to static defects independent on temperature and from scattering by elementary excitations. The effect of electron-electron scattering can be described by a term proportional to jaime . Taking these two contributions into account the resistivity should follow the relationship as = + . The data for = 0.42 (Figure 3(a)) are expected to follow this conventional behaviour. However, the dependence with = 0.5 sample shows a shallow but distinct minimum in the low-temperature region (see inset in Figure 1) indicating further effects. The resistivity minimum persists in the presence of magnetic fields and even becomes deeper, while shifting to higher temperature of about 110 K in a 5 Tesla field (Figure 3(b)). We assume that this anomaly is related to weak localization and electron-electron interaction in the correlated electron system owing to static disorder and large Coulomb interactions Lee . Additionally, higher order contributions in temperature may play a role. These are two-magnon interactions with a term and an electron -phonon (e-p) term . Because it is difficult to distinguish between these two terms, we do not consider these two possible contributions separately, rather we restrict our fits to the two-magnon term only. Hence, the resistivity for the metallic low-temperature range should be described by
| (1) |
For the resistivity of the = 0.42 sample, no indication of weak localization could be observed. To verify this, we have plotted the resistivity data after subtracting the residual resistivity against (see inset of Figure 3(a) ). The data are not linear as a function of in that temperature range, whereas linearity is supposed to be a prominent signature in support of weak localization and a -term due to e-e interactions ziese ; mich . Hence, resistivity data for = 0.42 have been fitted according to equation (1) without the term. The result is shown in Figure 3(a). The fit parameters for the stable fit in the temperature range K are listed in table 1.
| values | T | ||||
|---|---|---|---|---|---|
| ohm-cm | ohm-cm K-2 | ohm-cm K-4.5 | K | ||
| =0.42 | 0.2001 | 7.4 10-6 | 6.5 10-11 | 50 | 5 10-7 |
| 0.2 10-3 | 4 10-7 | 2 10-11 |
The resistivity data of the 0.5 crystal require inclusion of the term due to weak localization. This is obvious from the linear part of the plots versus in the Inset of figure 3(b) with and without applied magnetic field. However, the presence of the electronic contribution to resistivity is uncertain. As listed in Table 2 we have tried various fits for the data in zero magnetic field: a fit in the low temperature range excluding the term in the temperature range 60 K leads to an insignificantly small or even negative contribution with large errors. Similar results for the term are found for fits by including the term in an extended temperature range K. Therefore, this electronic term appears to be irrelevant for a valid description of the data. However, one can get an upper estimate of the parameter ( 6.3 x 10⁻⁶ ohm cm K-3/2) from the fit in the range 60 K. By putting , we find a satisfactory fit in the same temperature range in zero field. A fit with similar quality is achieved for the resistivity data in a field of 5 Tesla (table 2 and figure 3(b). Here, the magnitude of is slightly increased as compared to the fit to the zero-field resistivity. It is to be noted that the lowest possible temperature, at which we could measure the resistivity is around 5 K for = 0.5. Hence, the value is actually close to . In the fits, there is a trade-off between the negative term and the , which leads to some systematic interrelation between these contributions. Therefore, the shift in is probably not related to a real physical effect due to magnetic field. However, the strong increase in the magnitude of due to the magnetic field is clear, see figure 3(b). The two-magnon term is suppressed in a magnetic field, which suggests that it is dominated by two-magnon scattering contributions that are subdued by the magnetic field.
. , values ohm-cm ohm-cm K-2 ohm-cm K-1/2 ohm-cm K-4.5 K =0.5 0.626 -6.2 10-7 -1 10-2 … 40 3.4 10-7 =0 0.1 10-2 9.34 10-7 0.3 10-3 0.6327 6.3 10-6 -1 10-2 … 60 2.4 10-6 0.1 10-3 7.410-7 0.5 10-3 0.6296 5.26 10-7 -1 10-2 1.610-10 100 2 10-6 0.1 10-3 7.4 10-7 0.4 10-3 6 10-12 0.6287 … -1 10-2 1.6 10 -10 100 2 10-6 0.12 10-2 0.2 10-3 210-12 = 0.5 0.6513 … -3 10-2 2.8 10-11 180 2 10-5 =5T 0.18 10-2 0.2 10-3 2 10-13
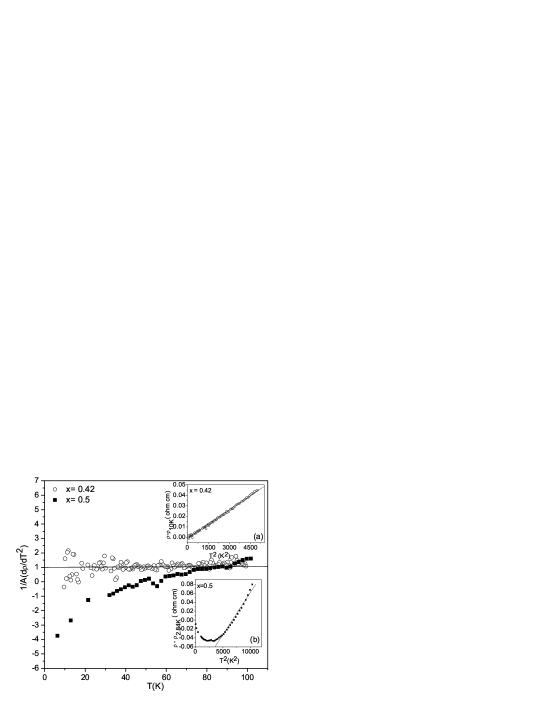
To ascertain the essential absence of the expected electronic contribution to the resistivity , we have additionally used graphical methods. We plot the resistivity against (after subtraction of the residual resistivity). The data for 0.5 do not follow a straight line (inset (b), Figure 4), unlike those for 0.42( inset (a), figure 4). In order to better display the deviations from the contribution, we also have numerically differentiated the data and plotted as / vs in figure 4. Here, we have used the calculated value of from the slopes of the straight line fits (see insets, figure 4). In the plot of figure 4, the data show an upward deviation from 1 at higher temperatures. This should be related to the expected weak two-magnon scattering ( ) and electron-phonon scattering () contributions.
III.2 Specific heat
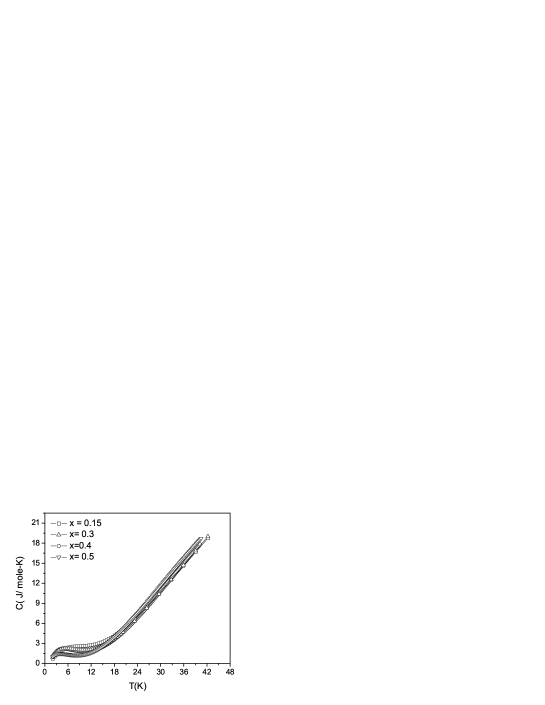
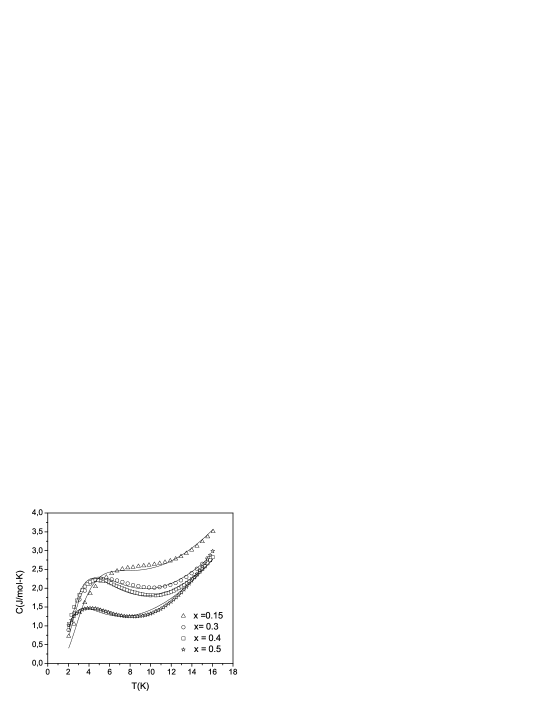
The specific heat vs temperature data for the series of Nd1-xPbxMnO3 crystals are plotted in Figure 5. For manganites the basic contributions to the specific heat in the low temperature range can be described by bf .
| (2) |
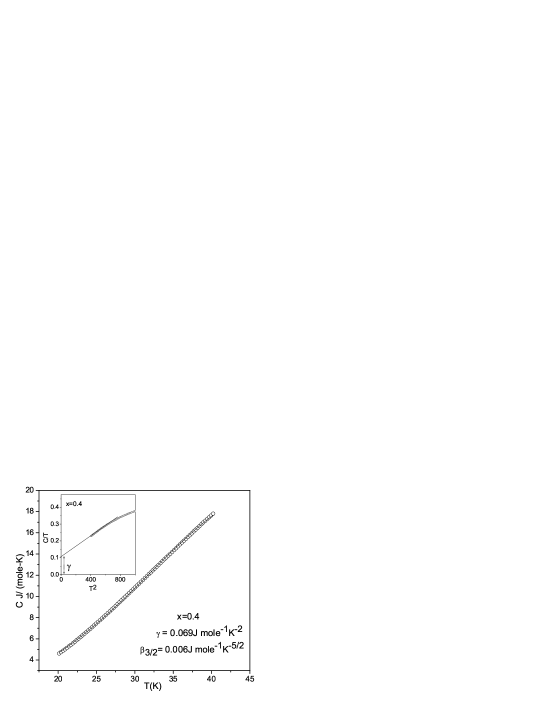
Here, is the coefficient of the contribution from spin wave excitations for ferromagnetic order, is the coefficient of the electronic specific heat, and are coefficients of the contribution from the lattice. In the temperature range 15 K, an additional contribution from a Schottky-like effect strongly influences the behaviour of the specific heat for the Nd-based systems ng2 . The best range for the fitting according to Eq. (2) has been found to be 20 — 40K. For this temperature range nuclear hyperfine effects in the specific heat need not be considered, as they contribute appreciably only at much lower temperature 2 K. The results of the fitting by Eq. (2) is shown for = 0.4 as a representative plot in Figure 6. Similar fits have been achieved for = 0.15 and 0.5 (not shown in the figure). An analysis of the specific heat of the =0.3 crystals has already been reported in Ref. ng2 .
| Composition | ||||||
| mJ mole-1 | mJ mole-1 | mJ mole-1 | mJ mole-1 | meV | ||
| K-5/2 | K-2 | K-4 | K-6 | Å2 | ||
| 10-3 | ||||||
| Nd0.85Pb0.15MnO3 | 19.57 | 71.82 | 0.26 | -0.068 | 17.3 | 4.8 10-3 |
| … | 0.11 | 0.01 | 0.004 | .. | ||
| Nd0.7Pb0.3MnO3 | 6.51 | 71.73 | 0.356 | -0.98 | 34.9 | 1 10-3 |
| … | 0.13 | 0.05 | 0.007 | .. | ||
| Nd0.6Pb0.4MnO3 | 6 | 68.64 | 0.387 | -0.112 | 37.8 | 3.3 10-3 |
| … | 0.01 | 0.004 | 0.002 | .. | ||
| Nd0.5Pb0.5MnO3 | 1 | 111.51 | 0.411 | -0.125 | 125.8 | 6 10-3 |
| … | 0.02 | 0.005 | 0.003 | .. |
The detailed results of fitting are given in Table 3. We have extracted the initial value of from the -axis intercept in the plot of vs (inset of figure 6). To determine the magnon contribution to the specific heat, we extracted the spin stiffness constants from the magnetization data ng2 using Bloch law (see table 3). Subsequently, the corresponding values of are calculated from using the relation = 0.113 ()3/2. Here, = 8.314 J K-1 mole-1 is the universal gas constant and is the lattice parameter of the elementary perovskite cell ng2 . Then the remaining coefficients and have been determined by fitting. The coefficient corresponds to the Debye contribution to the specific heat at low temperature which can be expressed as,
| (3) |
where is number of atoms in the unit cell, i.e. , the universal gas constant, and is the Debye temperatureesr . We have calculated the values of for = 0.15, 0.3, 0.4 and 0.5 and they are 332 K, 292 K, 291 K and 285 K, respectively. Generally, the electronic specific heat term is not expected to be present for samples with = 0.15, 0.3 which are insulators at low temperature. However, it is observed that the magnitude of is unusually large for all these samples. The enhanced values of are most probably not related to the conduction electrons. The corresponding specific energy contribution may be due to magnetic effects related to the Nd ions and the Mn-sublattice ng2 . In particular, the magnitude of is presumably influenced by the tail of the Schottky-like anomaly due to the presence of Nd ions.
As can be seen from Figure 5, the specific heat below 15 K has a strong Schottky-like anomaly for all the samples. This effect is due to the Zeeman-like splitting of crystal-field ground state multiplets in the Nd3+ ions, which was already described for Nd0.67Sr0.33MnO3 by Gordon et al. gor . A similar phenomenon was reported for Pr0.8Sr0.2MnO3 wahl . Nd3+ ions have a ten-fold degeneracy for the ground-state multiplet which is split by the crystal-field into five Kramers Doublets podle . An effective molecular field is assumed to be present at Nd sites. Although this field splits each of the five crystal-field doublets, at low temperature, only the ground state doublet needs to be considered gor . Assuming that the effective moment of Nd3+ ions in the ground state to be and that the splitting of the doublet is , a contribution from a two-level Schottky function should fit the excess specific heat at low temperature (15 K). We have used the Schottky function for a two-level system as esr ; wahl
| (4) |
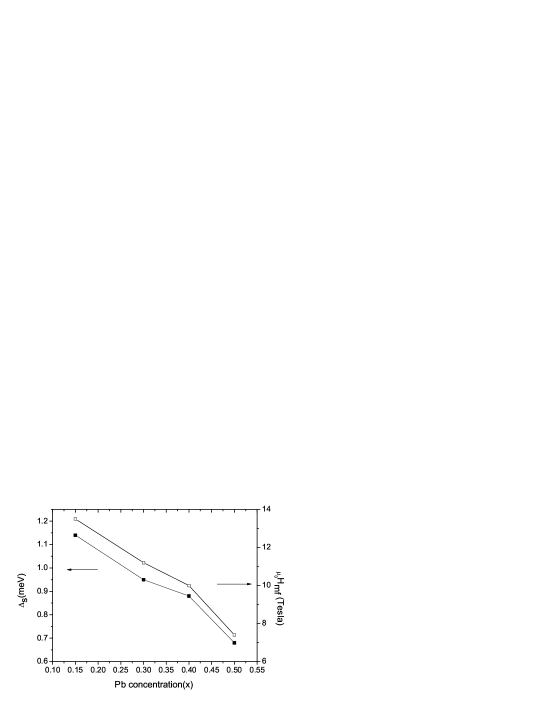
where is the coefficient of the contribution from the Schottky effect, and is the Avogadro number. The fitting is carried out by adding this Schottky term to Equation (3), while keeping the lattice contribution (parameters , ) and the spin-wave contribution () fixed. The result is shown in figure 7. The values of Schottky gaps and Schottky co-efficients for = 0.15, 0.3, 0.4, 0.5 obtained by fitting are 1.14, 0.95, 0.88, 0.68 meV and 0.5, 0.54, 0.56, 0.34 respectively. It has been noticed that this anomaly can be better fitted by a modification of the linear contribution in the temperature range 2 to 15 K . For example, if we relax the value of during fitting, the modified values for = 0.15, 0.3, 0.4 and 0.5 will become 44, 37, 29 and 61 mJ mole-1 K-2 respectively. Thus, the fact that the enhanced linear contribution to the specific heat (as shown in table 2) is affected by magnetic contributions is reflected by these reduced values ng2 . We assume this broad linear specific heat contribution to originate from possible ordering of Nd moments. We observe that the magnitude of the Schottky gap increases with the concentration of Nd3+ (figure 8) ions. Equivalently, the molecular field experienced by Nd ion is the strongest at the lowest and decreases as increases. However, the expected full contribution of the split ground-state Kramers doublet from the Nd3+-ions is not found in this fit, which would require that . Also the fit in the low temperature range is not overall satisfactory as seen in figure 7.
IV Discussion
We have seen that the gap energy in the ferromagnetic insulating phase at low temperature varies with and vanishes at a critical value 0.33. Although the origin of the gap is not clearly understood yet, we can find some explanation in the light of the theory by Pai et al. pai . The theory considers three important on-site interactions in manganites, namely the Jahn-Teller (JT) effect, Hund’s rule coupling (), and Coulomb repulsion . The theory is based on the new idea of co-existing localized JT polaronic () and broad band () itinerant electrons from eg states. The effective bandwidth () of the band decreases significantly as decreases for any sizable . Consequently, the bottom of the band shifts above the Fermi level for small . At = 0 all eg electrons become localized as polarons. Mobile states are occupied only by thermal excitations across the gap. The system is still ferromagnetic because of the Hund’s rule coupling that remains operative also for polarons. This explains the insulating ferromagnetic behaviour at low doping with a thermally activated electronic transport rama04 . Furthermore, with the increasing , increases and beyond a critical concentration , when the band width equals the JT-distortion energy, , the low temperature state becomes a ferromagnetic metal.
We have found the values for and of Nd1-xPbxMnO3 from our analysis. These are of acceptable order of magnitude, but appreciably smaller than the values estimated by Pai et al. . The smaller value for may be related to the decrease of half-bandwidth due to smaller cationic radius in Nd1-xPbxMnO3 which is comparatively smaller than in the wide-band systems like La1-xSrxMnO3 pai . However, the measured activation energy for the composition Nd0.85Pb0.15MnO3 does not fit well with the dependence expected by the theory of Pai . pai . This is possibly related to appreciable antiferromagnetic couplings giving rise to stronger spin-disorder scattering at this low doping close to the insulating antiferromagnetic phase. This could cause an increased apparent activation energy for the crystal with . It is noticed that the metallic phase sets in above = 0.3 and for compositions beyond this level we have found a clear metal-insulator transition at high temperatures.
The empirical relationship between the coefficient for the electronic contribution to resistivity and the coefficient of the electronic specific heat has been found by Kadowaki and Woods with 1 10-5 cm (mole K 2/mJ)2 kadawaki . For the metallic composition we can use the determined values for and to estimate this ratio. We find a Kadowaki-Woods ratio around 850 x 10-5 cm (mole K2/mJ)2. This means that the properties of the metal-like manganites are far from those expected for a normal metal. Since the Kadowaki-Woods empirical relationship is only valid for pure metals, it is not strictly applicable to the present system. However, considering the fact that samples with 0.4 are metallic at low temperature we can assume that there should be a positive contribution from e-e scattering. In fact, we have found that there is still a positive contribution from e-e interaction with conventional exponent in = 0.42. But, this contribution is not prominent in = 0.5 at =0, possibly due to the resistivity minimum found for this composition. We have attributed this resistivity minimum to weak localization in a disordered correlated system Lee . Resistivity minima at low temperature are also a typical characteristic of the Kondo effect Kondo . However, the resistivity minima due to a Kondo effect should disappear in relatively weak applied fields, which is not observed in the present case. Moreover, the manganite system at behaves as a homogeneous ferromagnetic metal and not like a metallic alloy with dilute magnetic impurities. Hence, the resistivity minimum observed here for the single crystal should not be related to a Kondo effect.
On the other hand, the enhanced weak localization contribution term in the presence of magnetic field is an expected effect. According to Ref. Lee , the e-e interaction in the presence of strong disorder is special and the magnetic field enhances this interaction which results in an increased resistivity. From the resistivity in the =0.5 sample, we also find a reduction in the term by a magnetic field, which is consistent with a reduced two-magnon scattering. Here, one should remember that it has not been possible to distinguish the term due to two-magnon scattering from the electron-phonon interaction term.
The weak localization and e-e interaction should be attributed to the static disorder in these manganites caused by the mixed A-site substitution of tri-valent rare-earth Nd3+ by divalent ions (Pb2+), which gives rise to some static electronic effects. The magnitude of disorder can be quantified by the A-site variance where is average cationic radius cnr . The for = 0.3 is 0.0101 ng2 . Taking this value into consideration the disorder for = 0.42 and 0.5 is around 0.0141 and 0.0168 respectively. The difference between the fitting of resistivity data for = 0.42 and 0.5 (see table 1 and 2) is clearly observed. Hence, the disorder may not be large enough to cause a prominent effect of weak localization in = 0.42, whereas its influence is strong in the sample with = 0.5. In addition, it should be mentioned for the specific Nd1-xPbxMnO3 system, that the half-doped system does not show indications of a charge-ordered/orbital-ordered and antiferromagnetic behavior. This is consistent with the proposed phase diagram of Nd1-xPbxMnO3, where no indication of a charge-ordered/orbital-ordered phase was observed around 50:50 compositionng1 .
The analysis of the specific heat data points to some particular effects in the magnetic system across the series of crystals. It is seen in table 3 that the value of increases with , because the average cationic radius () increases with too. Since is directly proportional to the exchange integral, the higher value implies larger exchange coupling resulting in higher ng2 . The fact that the = 0.5 sample has the highest supports the above explanations. The Debye temperature decreases with the increase of here (see table 3). However,the Debye temperatures are smaller than usual values reported for manganites akr . This may be due to the fact that the analysis has not been carried out in the constant region and the value is affected by systematic drifts ng2 ; esr . The electronic contribution to the specific heat is unusually large and present even in the insulating phase at low temperature. We believe that this broad specific heat contribution is related to a magnetic ordering of Nd moments, and/or to frustrated glassy ordering in the coupled Nd-Mn magnetic system owing to the dilution of the rare-earth A-site. Such an effect would be poorly emulated by an enhanced value of over the temperature range up to about 30 K. Hence, an exact evaluation of Kadowaki-Woods ratio is difficult for two specific reasons: (i) Even where the term is clearly present as in =0.42, the from specific heat is overestimated by the magnetic contributions to the low temperature specific heat. Therefore, there is no clear way to estimate the Kadowaki-Woods ratio even in that case. In this respect, the true electronic may be smaller, thus the calculated K-W ratio is a lower estimate. (ii) As our study has suggested for =0.5 the term is not discernible in some cases. Thus, the material does not behave like a metallic system at all, where such a term in resistivity would result from e-e scattering.
The specific heat measurements at low temperature show a strong influence of a Schottky-like anomaly. The peaks due to Schottky-like anomaly are significantly broadened. This may the effect of a distribution of ground-state splittings on the Nd due to an inhomogeneous molecular field, e.g. related to a Nd-Nd magnetic exchange and the dilution on the A-site. In particular, there may be a greater number of Nd-sites with very low molecular field and correspondingly low Schottky-like contribution to specific heat. This can explain why only a part of the expected contribution of the two-level systems to the specific heat is found in our fitting. However, efforts to fit the Schottky-anomaly with more than one doublet energy to mimick a distribution of molecular fields were inconclusive owing to the great number of necessary parameters in such fittings. The molecular field leading to the Zeeman-split levels of the ground state doublet in Nd3+ includes also contributions from the Nd-Mn exchange couplings pattu . A direct coupling with the Mn-O subsystem may require some particular form of superexchange like 4f-3d coupling. If a Nd-Mn exchange mechanisms is to be the most important contribution, then an inhomogeneity of this molecular field would require an inhomogeneous ordering of the Mn-sublattice. On the other hand, the molecular field as measured by the magnitude of the effective single Schottky gap changes with Nd ion concentration. It is not obvious, why and how the interaction between Nd and Mn-O subsystem could yield a decreasing molecular field with increasing doping . In particular, the internal Mn-O exchange becomes stronger with increasing as seen from the increasing Curie-temperature up to . This indicates that the change of the effective molecular field is influenced by the Nd content, which may be due to an exchange interaction between the Nd ions, e.g., by a long-range indirect exchange of the RKKY-type. In the case of Nd-Sr system it has been noticed that Nd-Nd interaction is small compared to Nd-Mn interaction gor . Therefore, the detailed understanding of the magnetic effects involving the diluted Nd3+ sublattice on the A-sites requires further theoretical analysis of possible magnetic exchange mechanisms in manganites.
V Conclusions
The low temperature transport property and specific heat of Nd1-xPbxMnO3 have been analyzed for = 0.15, 0.3 , 0.4, and 0.5. In the considered temperature range, activated behaviour is found in resistivity data for samples, which are ferromagnetic insulators. This activation gap disappears beyond = 0.3, where the true zero-temperature MI transition takes place at an estimated critical concentration x 0.33. A positive e-e scattering term describes the leading resistivity effect in the low temperature transport data for the metallic sample = 0.42. However, the validity of contribution to resistivity from e-e scattering used in earlier fitting formula is questioned here, as it is not discernible for the composition = 0.5, which still shows overall metallic properties. A negative contribution from e-e scattering valid for disordered systems explains a shallow minimum in the resistivity for this = 0.5 crystal. Low temperature specific heat data have been analyzed for these samples. Anomalously large values of the electronic specific heat coefficient probably originate from magnetic effects. They could be related to a glassy magnetic ordering on the diluted Nd-sublattice. Indications of inhomogeneous magnetic properties are also found from a wide and subdued Schottky-like contribution to the specific heat from the Zeeman-split Kramers ground-state doublets in Nd3+-ions.
Acknowledgements
NG thanks SFB 463 project funded by DFG for financial support during his work at IFW Dresden. HLB thanks the CSIR, Government of India for financial support through an extramural research grant.
∗corresponding author, E-mail: ghosh.nilotpal@gmail.com, present address: Institut für Experimentelle Physik II,Universität Leipzig, Linne Str. 3-5, 04103 Leipzig, Germany.
References
- (1) J. M. D. Coey, M. Viret and S. von Molnar 1999 Adv. Phys. 167.
- (2) Myron B. Salamon, Marcelo Jaime 2001 Reviews of Modern Physics 583.
- (3) Y. Tokura 2006 Rep. Prog. Phys. 797.
- (4) C.N.R. Rao, B. Raveau (Eds.) 1998 Colossal Magnetoresistance, Charge Ordering and Related Properties of Manganese Oxides, World Scientific, Singapore.
- (5) Y. Tokura, 2000 Colossal Magnetoresistive Oxides Gordon Breach Science Publishers, New York.
- (6) van Santen, J. H., and G. Jonker 1950 Physica (Amsterdam) 16 599.
- (7) Jin, S., T. Tiefel, M. McCormack, R. Fastnacht, R. Ramesh, and L. Chen 1994 Science 264 413.
- (8) C. Zener 1951 Phys. Rev. 403.
- (9) P.W. Anderson and H. Hesegawa 1955 Phys. Rev. 675 .
- (10) P.D. De Gennes 1960 Phys. Rev. 141 .
- (11) A. Urushibara, Y. Moritomo, T. Arima, A. Asamitsu, G. Kido and Y.Tokura 1995 Phys. Rev. B 14103.
- (12) Schiffer, P., A. Ramirez, W. Bao, and S.-W. Cheong 1995 Phys. Rev. Lett. 75 3336.
- (13) Snyder, G., R. Hiskes, S. Dicarolis, M. Beasley, and T. Geballe 1996 Phys. Rev. B 53 14434.
- (14) Kadowaki, K. and S. Woods 1986 Solid State Commun. 58 507.
- (15) Jaime, M., P. Lin, M. Salamon, and P. Han 1998 Phys. Rev. B 58, R5901.
- (16) M. Mayr, A. Moreo, J. A. Verg s, J. Arispe, A. Feiguin and E. Dagotto 2001 Phys. Rev. Lett.86 136.
- (17) F. Rivadulla, J. Rivas and J. B. Goodenough 2004 Phys. Rev. B 70 172410.
- (18) D. Kumar, J. Sankar,J. Narayan, R.K. SIng, A.K. Majumdar 2002 Phys.Rev. B 65 094407
- (19) D.S. Rana, J.H. Markna, R.N. Parmar, D.G. Kuberkar, P. Raychaudhuri, J. John and S.K. Malik 2005 Phys. Rev. B 71 212404 .
- (20) J. Zhang, Y. Xu, S. Cao, G.Cao, Y. Zhang and C. Jing 2005 Phys. Rev. B 72 054410.
- (21) P.A. Lee and T.V. Ramakrishnan 1985 Rev. Mod. Phys. 57 287.
- (22) N. Furukawa 2000 J. Phys. Soc. Jpn. 69 1954.
- (23) G. V. Pai, S. R. Hassan, H. R. Krishnamurthy and T. V. Ramakrishnan 2003 Europhys. Lett. 64 696.
- (24) R.M. Kusters, J. Singleton,D.A. Keen, R. McGreevy and W. Hayes 1989 Physica B 155 362.
- (25) Nilotpal Ghosh, Suja Elizabeth, H.L. Bhat, G.N.Subanna and M. Sahana 2003 J. Magn. Magn. Mater.256 286.
- (26) Nilotpal Ghosh, Suja Elizabeth, H.L. Bhat and P.L. Paulose 2004 J. Appl. Phys. 96 3343.
- (27) Nilotpal Ghosh, Suja Elizabeth, H.L. Bhat, U.K. Rössler, K. Nenkov, S. Rössler, K. Dörr and K. -H. Müller 2004 Phys. Rev. B 70 184436.
- (28) M. Sahana, U. K. Rössler, Nilotpal Ghosh, Suja Elizabeth, H. L. Bhat, K. Dörr, D. Eckert, M. Wolf and K. -H. Müller 2003 Phys. Rev. B 68 144408.
- (29) Nilotpal Ghosh, U. K. Rössler, K. Nenkov, S. Rössler, Suja Elizabeth, H. L. Bhat, K. Dörr and K. -H. Müller 2006 J. Phys. Condens. Matter 18 557.
- (30) A. J. Millis, P. B. Littlewood and B. I. Shraiman 1995 Phys. Rev. Lett 74 5144.
- (31) M. Ziese 2003 Phys. Rev. B 68 132411.
- (32) A Michalopoulou, E Syskakis and C Papastaikoudis 2001 J. Phys.: Condens. Matter 13 11615.
- (33) B.F. Woodfield, M.L. Wilson and J.M. Byers 1997 Phys. Rev. Lett. 78 3201.
- (34) E.S.R. Gopal, 1966 Specific Heats at Low Temperatures (Plenum Press, New York, )pp.31 and 35.
- (35) J.E. Gordon, R.A. Fisher,Y.X. Zia, N.E. Phillips, S.F. Reklis, D. A. Wright, and A. Zettl 1999 Phys. Rev. B 59, 127.
- (36) A. Wahl, V. Hardy, C. Martin, and Ch. Simon, 2002 Eur. Phys. J. B 26,135.
- (37) A. Podlesnyak, S. Rosenkranz, F. Fauth, W. Marti, A. Furrer, A. Mirmelstein, and H.J. Scheel 1993 J. Phys: Condens Matter 5 8973 .
-
(38)
T. V. Ramakrishnan, H. R. Krishnamurthy, S. R. Hassan and G. Venketeswara Pai
2004 Phys. Rev. Lett. 92, 157203-1;
- (39) J. Kondo 1968 Solid State Phys. 23 183.
- (40) V.B. Shenoy, T.Gupta,H.R. Krishnamurthy and T.V. Ramakrishnan 2007 Phys. Rev. Lett. 98 097201.
- (41) A.K. Raychaudhuri, A. Guha, I. Das, R. Rawat, and C.N.R. Rao, 2001 Phys. Rev. B 64 165111.
- (42) M. Pattabiraman, R. Venkatesh, G. Rangarajan, P. Murugaraj, C. Dimitropoulos, J.Ph. Ansermet and G. Papavassiliou 2006 J. Phys. Condens. Matter 18 11081.
Figures and Figure Captions