11email: rkari@iiap.res.in
Intensity oscillations in coronal XBPs from Hinode/XRT observations
Abstract
Aims. Our aim is to investigate the intensity oscillations in coronal X-ray Bright Points (XBPs).
Methods. We analysed a 7-hours long time sequence of the soft X-ray images obtained on April 14, 2007 with 2-min cadence using X-Ray Telescope (XRT) on-board the Hinode mission. We use SSW in IDL to derive the time series of 14 XBPs and 2 background regions. For the first time, we have tried to use power spectrum analysis on XBPs data to determine the periods of intensity oscillations.
Results. The power spectra of XBPs show several significant peaks at different frequencies corresponding to a wide variety of time scales which range from a few minutes to hours. The light curves of all the XBPs give the impression that the XBPs can be grouped into three classes depending on emission levels: (i) weak XBPs; (ii) bright XBPs; and (iii) very strong XBPs. The periods of intensity oscillation are consistent in all the XBPs and are independent of their brightness level, suggesting that the heating mechanisms in all the three groups of XBPs are similar. The different classes of XBPs may be related to the different strengths of the magnetic field with which they have been associated.
Key Words.:
Sun: corona – Sun: magnetic fields – Sun: oscillations – Sun: X-rays, gamma-rays – Sun: atmosphere1 Introduction
Solar coronal X-ray bright points (XBPs) have been an enigma since their discovery in late 1960’s (Vaiana et al. 1970). XBPs have subsequently been studied in great detail using Skylab and Yohkoh X-ray images (Golub et al. 1974; Harvey 1996; Nakakubo & Hara 1999; Longcope et al. 2001; Hara & Nakakubo 2003). Their correspondence with small bipolar magnetic regions was discovered by combining ground-based magnetic field measurements with simultaneous space-born X-ray imaging observations (Krieger et al. 1971; Golub et al. 1977). The number of XBPs (daily) found on the Sun varies from several hundreds up to a few thousands (Golub et al. 1974). Zhang et al. (2001) found a density of 800 XBPs for the entire solar surface at any given time. It is known that the observed XBP number is anti-correlated with the solar cycle, but this is an observational bias and the number density of XBPs is nearly independent of the 11-yr solar activity cycle (Nakakubo & Hara 1999; Sattarov et al. 2002; Hara & Nakakubo 2003). Golub et al. (1974) found that the diameters of the XBPs are around 10-20 arc sec and their life times range from 2 hours to 2 days (Zhang et al. 2001). Studies have indicated the temperatures to be fairly low, K, and the electron densities = 5 (Golub & Pasachoff 1997), although cooler XBPs exist (Habbal 1990). XBPs are also useful as tracers of coronal rotation (Kariyappa 2008) and contribute to the Solar X-ray irradiance variability (DeLuca and Saar 2008; Kariyappa & DeLuca 2008). Assuming that almost all XBPs represent new magnetic flux emerging at the solar surface, their overall contribution to the solar magnetic flux would exceed that of the active regions (Golub & Pasachoff 1997). Since a statistical interaction of the magnetic field is associated with the production of XBPs, the variation of the XBP number on the Sun will be a measure of the magnetic activity of its origin.
Bright points are also observed in the chromosphere using high resolution CaII H and K spectroheliograms and filtergrams. Extensive studies have been conducted to determine their dynamical evolution, the contribution to chromospheric oscillations and heating, and to UV irradiance variability (e.g. Liu 1974; Cram and Damé 1983; Kariyappa et al. 1994; Kariyappa 1994 & 1996; Kariyappa & Pap 1996; Kariyappa 1999; Kariyappa et al. 2005). The oscillations of the bright points at the higher chromosphere have been investigated using SOHO/SUMER Lyman series observations (Curdt & Heinzel 1998; Kariyappa et al. 2001). It is known from these studies that the chromospheric bright points are associated with 3-min period in their intensity variations using power spectra analysis.
Oscillations have been investigated in XBPs using Yohkoh/SXT (Strong et al. 1992) and found intensity variations on time scales of a few minutes to hours. In 2002, we (Kariyappa and Watanabe) made an attempt to investigate the intensity oscillations at the sites of XBPs using Yohkoh/SXT observations. We found that there were several and long gaps in the time sequence data and hence it was difficult to derive the power spectra precisely. The studies related to intensity oscillations of the XBPs and their contribution to coronal heating were not well discussed with Yohkoh/SXT observations. The X-ray Telescope on Hinode, XRT, has made such long and continuous high temporal and spatial resolution time sequence observations of XBPs. In addition the angular resolution of XRT is 1”, which is almost three times better than that of Yohkoh/SXT instrument. Due to a wide coronal temperature coverage achieved with XRT observations, for the first time the XRT can provide a complete dynamical evolution of the XBPs. The study of the spatial and temporal relationship between the solar coronal XBPs and the photospheric and chromospheric magnetic features is an important issue in physics of the Sun. The Hinode/XRT observations provide an opportunity to investigate and understand more deeply into the dynamical evolution and nature of the XBP than has been possible to date and to determine their connection to the large-scale magnetic features. Such a high resolution observations and investigations would certainly be helpful in understanding the role of oscillations and nature of the waves associated with XBPs to heat the corona.
In this paper, we report the analysis of 14 XBPs and 2 background coronal regions showing different emission levels selected from 7-hour time sequence observations of soft X-ray images obtained on April 14, 2007. We discuss the results of the periods of intensity oscillations associated with XBPs of different emission levels.
2 Methods and results
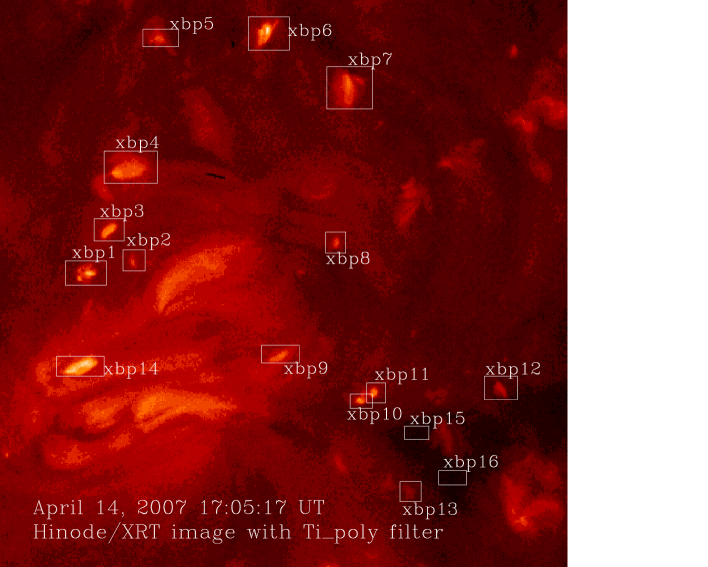
We use a 7-hour (from 17:00 UT to 24:00 UT) time sequence of soft X-ray images obtained on April 14, 2007 from X-Ray Telescope (XRT) on-board the Hinode mission. Images were obtained at time cadence of 2 min, but with a short data gap around 18:00 UT. The images have been observed through a single X-ray Ti_poly filter in a quiet region near to the center of the solar disk and the image size is 512”x512” with a spatial resolution of 1.032”/pixel. Figure 1, shows a sample of an X-ray image from the time sequence illustrating all the XBPs, which we will be discussing in more detail below. We have identified and selected 14 XBPs and 2 background coronal regions of the images around 17:00 UT for the analysis. We have marked all the 14 XBPs on the image in Fig. 1 as xbp1, xbp2,…………, xbp14 and 2 background coronal regions as xbp15 and xbp16.
We have used the routine xrt_prep.pro in IDL under SSW tree to calibrate the images and this routine does many corrections such as : (i) removal of cosmic-ray hits and streaks (using the subroutine xrt_clean_ro.pro), (ii) calibration of read-out signals, (iii) removal of CCD bias, (iv) calibration for dark current, and (v) normalization of each image for exposure time. On the calibrated images we have put the rectangular boxes covering the selected XBPs and derived the cumulative intensity values of the XBPs by adding up all the pixel intensity values. The light curves of all the XBPs and background regions have been derived. The light curves of the background coronal emission show that the fluctuations due to the background coronal emission is very small compared to the intensity variations at the sites of XBPs. However, we assumed that the background coronal emission is more or less constant and subtracted the intensity values of XBPs, point-by-point, from the background coronal intensity values (xbp15 and xbp16) in all the images.

The light curves of 5 XBPs (xbp2, xbp3, xbp4, xbp5, & xbp12) and one background coronal region (xbp15) are shown in Fig.2 for comparitive study among the selected XBPs. The intensity oscillation is seen in all the light curves of the XBPs. There is a short data gap in all the time series around 18:00 UT due to lack of observations. The light curve of xbp3 is shown in Fig.2(a) which indicates a steady increase in brightness with intensity oscillation. While Fig.2(b) shows the brightness variation of xbp4 and it is similar to xbp3 in the intensity variations. Figure 2(c) illustrates the light curve of xbp2 exhibiting oscillation with a strong intensity enhancement in the time period from 18:30 UT to 20:30 UT. The light curve of xbp5 is shown in Fig.2(d) and shows the intensity oscillations similar to other XBPs but with a strong intensity enhancement at two locations between 18:00 - 19:00 UT and 21:00 - 22:00 UT. Similarly the light curve of xbp12 is presented in Fig.2(e) and the intensity oscillations are clearly seen. The light curve of the background coronal region, xbp15, is also shown in Fig.2(f) which does not show much intensity fluctuations compared to XBPs, except for sharp intensity brightenings about every 80-100 mins.
In order to determine the periods of intensity oscillations, we have done a power spectrum analysis of all the XBPs and coronal background regions. The power spectra of 5 XBPs and one background coronal region are shown in Fig.3. Figure 3(a) shows the power spectrum of xbp3 with three significant peaks at the beginning from low frequency values which correspond to the periods of 139 min, 37 min & 24 min. Figure 3(b) illustrates the power spectrum taken for the time series of xbp4 indicating many significant peaks at various frequency values which correspond to the periods of 111 min, 37 min, 23 min, 17 min etc. The power spectrum of xbp2 is shown in Fig.3(c) and represents two prominent peaks corresponding to the periods of 69 min and 28 min. The power spectrum of xbp5 is demonstrated in Fig.3(d) representing several periods of oscillation, namely 133 min, 33 min and 13 min. Similarly, in Fig.3(e) the power spectrum of xbp12 is plotted which shows a variety of periods of 133 min, 33 min, 17 min and 9 min. The power spectrum of one of the background regions (xbp15) is also shown in Fig.3(f) and has several prominent peaks corresponding to the periods of intensity oscillation as 81 min, 31 min, 19 min, and 8 min. The power spectra of all the XBPs reveal a wide variety of time scales right from a few minutes to hours and some periods of oscillation are similar.
| XBPs Class | XBPs | XBPs mean brightness | XBPs brightness/Background brightness | Mean Ratio |
|---|---|---|---|---|
| (DN/s) | (where background brightness=4440 DN/s) | |||
| Class I | xbp3 | 157389 | 35.45 | |
| xbp4 | 288013 | 64.87 | ||
| xbp6 | 145266 | 32.72 | 42.33 | |
| xbp7 | 162340 | 36.56 | ||
| xbp14 | 186745 | 42.06 | ||
| Class II | xbp2 | 53573 | 12.07 | |
| xbp5 | 58236 | 13.12 | 13.39 | |
| xbp1 | 65445 | 14.74 | ||
| xbp13 | 60567 | 13.64 | ||
| Class III | xbp12 | 36978 | 8.33 | |
| xbp10 | 26789 | 6.04 | 7.39 | |
| xbp8 | 34676 | 7.81 | ||
| xbp11 | 37873 | 8.53 |

3 Discussions and conclusions
The XRT data shows that XBPs tend to produce small and large time scale fluctuations in their intensity and some periods of intensity oscillation are similar in all the XBPs. The periods observed with XRT data ranges from a few minutes to hours and these findings will have good agreement with the results of Strong et al. (1992) derived from the analysis of full-disk images obtained by Yohkoh/SXT experiment.
Although at first sight the light curves of 14 XBPs seem to be amazingly diverse in their pattern during evolution, we find that they can broadly be grouped into three classes depending on their emission level. The Class I XBPs show a very large intensity enhancement, whereas the Class II XBPs show moderate brightness enhancement and the Class III XBPs show only a marginal intensity enhancement during their dynamical evolution. We have calculated the mean intensity of XBPs from their time series belong to Class I, Class II and Class III and the background coronal regions and tabulated in Table 1. We determined the mean intensity ratio between the different classes of XBPs and the background coronal emission and the ratios have been listed in Table 1. The mean background intensity value of xbp15 and xbp16 derived over the time sequence is 4440 DN/s. It is seen from the light curves (Fig.2) and Table 1 that the XBPs will fall into 3 classes depending on the brightness level during their dynamical evolution. Class I XBPs are almost 42 times brighter than the background coronal emission, whereas the Class II and III XBPs are 13 and 7 times brighter than background coronal emission respectively.
We conclude that the analysis of long time series observational data of the XBPs is thus promising and future work will tell more about the dynamical nature and the physical properties of different oscillations and waves associated with the XBPs. Since the periods of intensity oscillation in all the three cases of XBPs seem to be similar and this can be taken as an evidence that heating mechanisms in all the three cases of XBPs are similar. XBPs exhibit a wide variety of time scales ranges from a few minutes to hours in their intensity variations and the periods are almost similar in all the cases of XBPs and thus seems to be independent of the differences in the brightness enhancement. The XBPs are the sites where intense brightness enhancement is seen, and the brightness oscillates with different periods. It suggests that the regions of intense vertical magnetic field strength coincide with regions that are bright indicating non-radiative heating, irrespective of the sizes of these structures. A comparison study between the XBPs and underlying photospheric magnetic features has suggested that the horizontal component of the magnetic field may be playing an important role in driving the brightening of an XBP (Kotoku et al. 2007). Therefore the possible reason for the existence of different classes of XBPs with similar periods among all the XBPs may be related to the different strengths of the magnetic field with which they have been associated.
Acknowledgements.
Hinode is a Japanese mission developed and launched by ISAS/JAXA, collaborating with NAOJ as a domestic partner, NASA and STFC (UK) as international partners. Scientific operation of the Hinode mission is conducted by the Hinode science team organized at ISAS/JAXA. This team mainly consists of scientists from institutes in the partner countries. Support for the post-launch operation is provided by JAXA and NAOJ (Japan), STFC (U.K.), NASA (U.S.A.), ESA, and NSC (Norway). One of us (RK) wishes to thank Tetsuya Watanabe for discussion on several occasions on the topic of XBPs and for his valuable information at the beginning in using the Hinode data. Many thanks to Katharine Reeves who clarified and helped in solving many problems to access to the XRT images and in their analysis. In addition she had taken pain to read through the draft manuscript and given valuable suggestions. RK wish to express sincere thanks to Ed DeLuca for his valuable suggestions and discussion on the XRT observations. The authors are grateful to the unknown referee and to Hardi Peter (Editor, A & A) for many useful comments, suggestions, and constructive remarks which helped considerably in improving the manuscript.References
- (1) Cram, L. E., & Damé, L. 1983, ApJ, 272, 355
- (2) Curdt, W., & Heinzel, P. 1998, ApJ, 503, L95
- (3) DeLuca, E. E. & Saar, S.H. 2008, in preparation
- (4) Golub, L., Krieger, A.S., Silk, J.K., Timothy, A.F., & Vaiana, G.S. 1974, ApJL, 189, L93
- (5) Golub, L., Krieger, A.S., Harvey, J.W., & Vaiana, G.S. 1977, Sol. Phys., 53, 311
- (6) Golub, l.,& Pasachoff, J.M. 1997, The Solar Corona, Cambridge University Press, Cambridge, United Kingdom.
- (7) Habbal, S.R. 1990, in Mechanisms of Chromospheric and Coronal Heating , eds. P. Ulmschneider, E.R. Priest, and R. Rosner, Springer Verlag 127
- (8) Hara, H., & Nakakubo-Morimoto, K. 2003, ApJ, 589, 1062
- (9) Harvey, K.L. 1996, in Magnetic Reconnection in the Solar Atmosphere, eds. R. D. Bentley and J.T. Mariska, ASP Conf, Ser., 111, 9
- (10) Kariyappa, R. 1994, Sol. Phys., 154, 19
- (11) Kariyappa, R. 1996, Sol. Phys., 165, 211
- (12) Kariyappa, R. 1999, in 19th NSO/Sac Peak Summer Workshop on High Resolution Solar Physics: Theory, Observations, and Techniques, ASP Conf. Ser., 183, 420
- (13) Kariyappa, R., & Pap, J. M. 1996, Sol. Phys., 167, 115
- (14) Kariyappa, R., Sivaraman, K. R., & Anandaram, M. N. 1994, Sol. Phys., 151, 243
- (15) Kariyappa, R., Varghese, B.A., & Curdt, W. 2001, A & A., 374, 691
- (16) Kariyappa, R., Satyanarayanan, A., & Damé, L. 2005, Bull. Astron. Soc. India, 33, 19
- (17) Kariyappa, R. 2008, A & A., under revision
- (18) Kariyappa, R., & DeLuca, E. E. 2008, in preparation
- (19) Kotoku, J., Kano, R., Tsuneta, S., et al. 2007, PASJ, 59, S735
- (20) Krieger, A.S., Vaiana, G.S., & Van Speybroeck, L. P. 1971, in Solar Magnetic Fields, ed. R. Howard, IAU Symp. 43, 397
- (21) Liu, S. Y. 1974, ApJ, 189, 359
- (22) Longcope, D.W., Kankelberg, C.C., Nelson, J. L., & Pevtsov, A. A. 2001, ApJ, 553, 429
- (23) Nakakubo, K., & Hara, H. 1999, Adv. Space Res, 25(9), 1905
- (24) Sattarov, I., Pevtsov, A.A., Hojaev, A.S., & Sherdonov, C.T. 2002, ApJ, 564, 1042
- (25) Strong, K.T., Harvey, K., Hirayama, T., Nitta, N., Shimizu, T., & Tsuneta, S. 1992, PASJ, 44, L161
- (26) Vaiana, G.S., Krieger, A.S., Van Speybroeck, L.P., & Zehnfennig, T. 1970, Bull. Am. Phys. Soc., 15, 611
- (27) Zhang, J., Kundu, M., & White, S. M. 2001, Solar Phys., 88, 337