Visit: ]http://www.nanomat.unina.it
Density functional study of oxygen vacancies at the SnO2 surface and subsurface sites
Abstract
Oxygen vacancies at the SnO and surface and subsurface sites have been studied in the framework of density functional theory by using both all-electron Gaussian and pseudopotential plane-wave methods. The all-electron calculations have been performed using the B3LYP exchange-correlation functional with accurate estimations of energy gaps and density of states. We show that bulk oxygen vacancies are responsible for the appearance of a fully occupied flat energy level lying at about 1 eV above the top valence band, and an empty level resonant with the conduction band. Surface oxygen vacancies strongly modify the surface band structures with the appearance of intragap states covering most of the forbidden energy window, or only a small part of it, depending on the vacancy depth from the surface. Oxygen vacancies can account for electron affinity variations with respect to the stoichiometric surfaces as well. A significant support to the present results is found by comparing them to the available experimental data.
pacs:
61.72.jd, 73.20.At, 73.20.Hb, 71.55.HtI Introduction
Tin dioxide (SnO2) is one of the most used and interesting materials for the development of solid state gas sensors, transparent conductors, and catalysts.Batzill and Diebold (2005) Many physical properties of this and other oxides are driven by defects which are mostly due to the ease with which the oxygen content can be varied. In this respect, SnO2 surfaces are even more interesting because the presence of two possible oxidation states of tin (+2 and +4), which are combined with the reduced atomic coordination, favors compositional changes and reconstructions. Although the SnO surface is one of the most studied both theoretically Oviedo and Gillan (2000a, b); Mäki-Jaskari and Rantala (2002); Bouzoubaa et al. (2005) and experimentally,Batzill and Diebold (2005); Cox et al. (1988); Themlin et al. (1990) its actual structure is still a matter of debateBatzill and Diebold (2005) because of the controversial aspects concerning defects and oxygen adsorption.Gurlo (2006) Several reconstructions are possible depending on both the preparation conditions and the sample history. Nevertheless, in a faceted sample, the lowest indices and stoichiometric surfaces seem to be the most likely, to be favored from the thermodynamic point of view.Bergermayer and Tanaka (2004)
Bulk and surface oxygen vacancies are extremely important for determining the electrical conductivity of tin dioxide.Cox et al. (1988) Moreover, they are also responsible for a very efficient luminescence activity of SnO2 nanobelts. First-principles calculations have revealed that bulk oxygen vacancies and tin interstitials have a low formation energy.Kiliç and Zunger (2002) However, few theoretical calculations of the energy levels associated to these types of defects have been published,Mäki-Jaskari and Rantala (2002); Sensato et al. (2002) probably because standard functionals used in Density Functional Theory (DFT) fail in giving the correct energy gaps.Parr and Yang (1989); Becke (1988, 1993); Lee et al. (1988); Pople et al. (1992) In this paper, we report on a first-principles study of the electronic and structural properties of SnO2 in the presence of oxygen vacancies both in the bulk crystal and at surface and subsurface sites, focusing on the effects on the energy levels close to the Fermi energy. Accurate calculations of the electronic band structure have been done within an all-electron approach, which employs the hybrid B3LYP exchange-correlation functional. Electron affinities have been studied with pseudopotential plane-wave calculations.
In Sec. II, we outline the computational approaches used in this work. The structural and electronic properties of defected bulk SnO2 are presented in Sec. III. The role of the oxygen vacancies on the surface properties are reported and discussed in the case of the and surfaces in Secs. IV and V, respectively. In particular, we consider several defect sites which are both at surface and in subsurface positions, and analyze their formation energy. Electron affinity variations driven by defects are studied in Sec. VI. Finally, in Sec. VII, we outline some conclusions.
II Computational methods
The structural and electronic properties of tin dioxide crystal and surfaces have been studied, from first-principles, in the framework of DFT. The first approach is based on an all-electron, Gaussian basis set and is implemented in the crystal06 (Ref. Dovesi et al., 2006) package. The hybrid B3LYPParr and Yang (1989); Becke (1988, 1993); Lee et al. (1988); Pople et al. (1992) approximation for the exchange-correlation functional has been adopted. This has been shown Muscat et al. (2001); Sensato et al. (2002) to be extremely valid for band structure calculations, giving reliable estimations of the energy gaps which are in excellent agreement with experimental data. We have verified that this approach works well for cassiterite (bulk rutile SnO2), as it will be shown below. The all-electron basis set adopted for tin atoms corresponds to a 3-21G basis set,Dobbs and Hehre (1987) with the external shell being modified with an exponent . The basis set adopted for oxygen atoms is the same as that used in Ref. Causà et al., 1986, where it was applied to magnesium oxide. For the study of the defected structures, the basis set was enriched by three single Gaussian functions (exponents , , and ) centered at the location of the missing oxygen, in order to allow the description of trapped electrons.Scorza et al. (1997)
The second approach, which is based on atomic pseudopotentials and a plane-wave basis set as implemented in the quantum-espressoBaroni et al. package, was employed due to its being very efficient for treating extended, periodic systems. In this case, the calculations were performed using the local density approximation (LDA) with the Perdew-Wang parametrization for the exchange-correlation functional and Bachelet-Hamann-Schlüter (for tin) and Vanderbilt ultrasoft (for oxygen) pseudopotentials to represent the ionic cores. We used an energy cutoff of 30 Ry for the wave functions and 180 Ry for the charge density. The need of using a higher value of the charge density cutoff is due to the fact that we need an accurate estimation of the electrostatic potentials for the calculation of the electron affinities (see below).
On the basis of our experience,Cantele et al. (2006); Buonocore et al. (2008) different computational schemes converge to comparable results when all the main parameters are carefully set. In the present case, we checked the charge density cutoff energy and the vacuum width parameters, for the plane-wave calculations, while we carefully set the Gaussian basis set by adding ghost orbitals (see below) for the all-electron approach. Once verified that both methods give reliable results, we used them for different types of calculations. The crystal06 package was used to perform calculations of band structures and density of states, thus taking advantage of the accuracy of B3LYP exchange-correlation functional in the single particle energy calculations. On the other hand, the quantum-espresso package was used to perform spatial averages [of potential energy and charge density (see below)] over surface planes, align the surface electrostatic potential with the bulk one, and, therefore, perform calculations of electron affinity variations induced by defects.
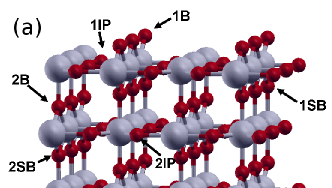
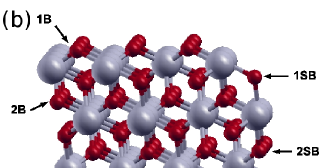
The rutile SnO and stoichiometric surfaces, which are shown in Figs. 1(a) and 1(b), respectively, have been modeled with a five layer (seven layer) slab in the case of crystal06 (quantum-espresso) calculations. The slab has been studied as an isolated structure (two-dimensional periodic structure) with the all-electron crystal06 code, whereas a three-dimensional supercell has been considered in using quantum-espresso. In the latter case, we have checked that a vacuum width of 6 Å between the slab replicas is large enough for obtaining converged results. For the sampling of the Brillouin zone, we used a 3x3 Monkhorst mesh (and a 6x6 secondary mesh for evaluating the density matrixDovesi et al. (2006)) for the geometrical optimization of the defected structures. Instead, we used a 6x6 Monkhorst mesh (12x12 secondary mesh) for the band structure and density of states calculations. We checked that finer meshes do not change the results.
Defected surfaces have been obtained by removing the oxygen atoms in the positions labeled in Fig. 1. The outermost atomic plane of the stoichiometric SnO surface [panel (a)] of Fig. 1 is characterized by rows of oxygen in bridging sites between pairs of tin atoms. The atomic plane lying just below is made of alternating rows of oxygen and tin atoms. The next plane is again made of only oxygen, which is again arranged along rows.Manassidis et al. (1995) The O atoms belonging to the three atomic planes just mentioned will be referred to as bridging, in-plane, and sub-bridging, respectively. Bridging, in-plane, and sub-bridging O atoms form a primitive structural unit along the direction perpendicular to the surface, which will be referred to in the following as a surface layer.Hameeuw et al. (2006) To label these atoms, we use a number for the layer depth (1 is the outermost layer) and a symbol for the position within the layer: bridging (B), in-plane (IP), and sub-bridging (SB). In the same way, the stoichiometric SnO surface shown in panel (b) of Fig. 1 is characterized by rows of bridging (sub-bridging) oxygen atoms, located above (below) planes of tin atoms. The stoichiometric surfaces are always favored over other kinds of reconstructions when samples are treated in oxygen-rich atmosphere.Batzill and Diebold (2005); Bergermayer and Tanaka (2004) In the present paper, we are interested in analyzing how oxygen vacancies modify the properties of a stoichiometric surface. We calculate the vacancy formation energy as , where , , and are, respectively, the total energy of the slab containing the vacancy, that of an isolated spin polarized O2 molecule, and that of the stoichiometric slab. The present expression is equivalent to Eq. (2) of Ref. Kiliç and Zunger, 2002, when the particular case of a neutral oxygen vacancy is considered.
The geometries of all the systems considered in this work have been optimized by fully relaxing the atomic positions until the residual forces were less than Ry / Bohr. We conclude this section by pointing out that the inclusion of the spin polarization does not modify our results. Indeed, we checked that, at variance with titanium dioxide (where in the presence of oxygen vacancies, a triplet ground state may arise), tin dioxide surfaces always show a spin singlet ground state which is fully justifying the use of spin unpolarized calculations.
III Bulk phase
In Table 1, the calculated lattice parameters, energy gap, and conduction band effective masses of bulk rutile SnO2 are compared to the experimental data, and show good agreement. The theoretical results, which are obtained with the all-electron B3LYP calculations, show deviations from the experimental data of only about 1.5% for the structural properties and less than 3% for the energy gap.
| B3LYP | 4.74 | 3.24 | 0.306 | 3.5 | 0.22 | 0.26 |
|---|---|---|---|---|---|---|
| EXP | 4.74111Reference Baur and Khan, 1971. | 3.19111Reference Baur and Khan, 1971. | 0.307111Reference Baur and Khan, 1971. | 3.6222Reference Batzill and Diebold, 2005. | 0.23333Reference Button et al., 1971. | 0.3333Reference Button et al., 1971. |
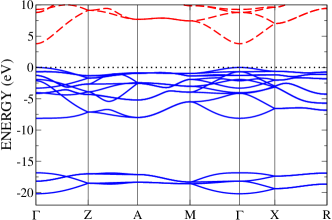
In Fig. 2, we show the band structure of bulk SnO2. As already known, SnO2 is a direct band gap semiconductor, with the lowest energy electron-hole transition occurring at the point. It is interesting to compare the present results with previous band structure calculations. Former tight binding calculationsGodin and LaFemina (1993) fairly reproduced the lowest bands (located at 15-20 eV under the top valence band) and the overall shape of the conduction band. Yet, they fail in the calculation of the top valence band, due to a wrong estimation of the charge transfer toward the oxygen atoms. This failure is critical in the presence of an oxygen vacancy, mostly if any geometrical reconstruction at the vacancy site is neglected.Themlin et al. (1990); Manassidis et al. (1995) Other interesting results emerge from a comparison with the GGA density-functional calculations of Ref. Mäki-Jaskari and Rantala, 2001. In that paper, Mäki-Jaskari and RantalaMäki-Jaskari and Rantala (2001) showed that ultrasoft pseudopotentials (USP) provide more accurate results than their norm-conserving (PSP) counterparts, in the energy range close to the top valence band. We confirm their conclusion since the shape of the present B3LYP band structure (see Fig. 2) is in good agreement with the USP calculation within the full valence band spectrum.

In Fig. 3, we show the calculated and measured density of states (DOS) of bulk SnO2. The theoretical result [curve (a)] has also been broadened using a Gaussian distribution with a half width at half maximum of 0.3 eV [curve (b)] to facilitate the comparison with the experimentalThemlin et al. (1990) data [curve (c)]. Figure 3 shows good agreement between theory and experiment. In particular, we find a valence band width of 8.1 eV in good agreement with both experimental data (7.5 eV reported in Ref. Themlin et al., 1990) and previous first-principles calculations (7.9 eV and 8.8 eV reported in Ref. Mäki-Jaskari and Rantala, 2001 using PSP and USP, respectively).
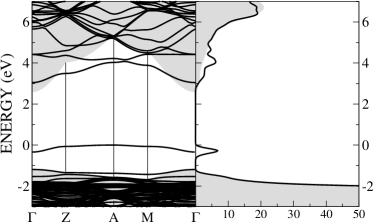
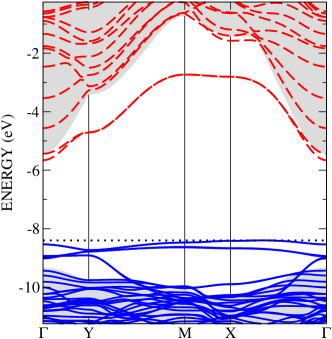
Before discussing the results concerning the surface band structures with and without oxygen vacancies, it is worth addressing their role in bulk SnO2. Isolated vacancies have been modeled using a 2x2x3 (almost cubic) supercell, which contains 12 primitive unit cells. From each supercell, we remove a bridging oxygen atom, so that the final structure results in a vacancy-vacancy distance of about 9.5 Å. We computed a vacancy formation energy of 3.42 eV for this configuration. Figure 4 shows the band structure (left panel) and the DOS (right panel) in the near-gap region for the defected structure (lines). The shaded regions represent the projected band structure and the DOS of the ideal crystal, respectively. All the energy levels located at negative (positive) energies are occupied (unoccupied) at a temperature of 0 ∘K. The uppermost occupied state of the defected structure is taken as reference energy. The comparison between the pure and the defected crystals leads to important conclusions. First, vacancies are responsible for the appearance of an almost flat occupied band which is located about 1 eV above the top valence band of the ideal crystal. The corresponding peak in the DOS is well visible in the right panel of Fig. 4, which shows a narrow well-defined distribution. Interesting results also emerge for the unoccupied states. Indeed, Fig. 4 evidences the appearance of states related to the oxygen vacancy and resonating with the conduction band. The coupling between the conduction band and the resonance level localized at the vacancy site pushes the bottom of the conduction band at a higher energy. A clear evidence of the effects of the vacancy on the energy levels emerges from the DOS. The vacancy is responsible for both the blue-shift of the density of unoccupied states threshold and the appearance of a strong peak at about 1.1 eV above this threshold.
IV SnO surface
As outlined in sec. II, different vacancy sites (bridging, in-plane, and sub-bridging) are possible for the SnO surface. We have considered all these vacancy positions, at several depths inside the slab. In all cases, a surface reconstruction (the and axes have been chosen along the and crystallographic axes, respectively) is considered.
The band structure of the stoichiometric (undefected) tin dioxide surface is reported in Fig. 5. The reference energy is the vacuum level.
The comparison with the bulk SnO2 band structure evidences that surface bands show up inside the forbidden band gap. The projected DOS (PDOS) onto atomic orbitals shows that the top valence band mostly consists of states localized on the external bridging (1B) oxygen atoms. The bottom of the conduction band mainly consists of orbitals localized on the in-plane tin atoms. The formation of the intragap surface states leads to a surface band gap much smaller than the bulk one. We find that the stoichiometric surface has a band gap at the point of eV. Figure 5 is in qualitative agreement with previous theoretical calculations,Mäki-Jaskari and Rantala (2001) with the difference that the present approach gives reliable results for the conduction band energies. An indication of the good quality of the present calculation can be found in the position of the lowest conduction band with respect to the vacuum level. We find a value of eV [ eV for the SnO surface], whereas, secondary electron cutoff measurements in photoemission gave a work function value (defined as the difference between the vacuum and the Fermi level energies) of eV for the stoichiometric SnO surface.Batzill et al. (2004) According to the literature, the Fermi level lies just below the lowest conduction level,Batzill and Diebold (2005) (tin dioxide behaves as a -type material), and thus, the agreement with the present calculation is good.
In Fig. 6, we show the band structures of a defected SnO surface, where either a bridging (1B, left panel) or an in-plane (1IP, right panel) oxygen atom has been removed. There are substantial differences with respect to the stoichiometric surface, especially concerning the intragap states. As a result of the removal of the most exposed (1B) bridging oxygen atoms, a dispersed band arises within the forbidden gap. The trend found here is in agreement with the experimental literature, reporting that, upon reducing a stoichiometric surface, energy levels extend from the top bulk valence band up to about 0.5 eV below the conduction band minimum.Cox et al. (1988) We found a different picture when the vacancy lies in the subsurface positions. In this case, the levels within the gap more closely resemble those of bulk SnO2, with a little dispersed band placed at about 1 eV above the top bulk valence band, as shown in the right panel of Fig. 6.
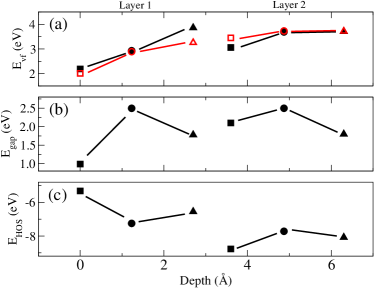
In Fig. 7, we report the vacancy formation energy [panel (a)], the energy gap [panel (b)], and the highest occupied state (HOS) binding energy calculated with respect to the vacuum level [panel (c)], upon changing the depth of the oxygen vacancy inside the slab. Squares, circles, and triangles correspond to the bridging, in-plane and sub-bridging oxygen vacancies, respectively. The black full symbols show calculations performed using the all-electron Gaussian based crystal06 package, with the B3LYP exchange correlation functional. As a comparison, the red empty symbols represent calculations performed using the plane-wave pseudopotential quantum-espresso package, with a LDA for the exchange correlation functional. Interesting results can be inferred from this figure. First, the vacancy formation energy [Fig. 7(a)] changes with the depth going toward the bulk limit of 3.42 eV for sufficiently deep vacancy sites. Although there is some scattering in the data, there is always a monotonic increasing behavior of the curve at a fixed vacancy position [compare 1B-2B, 1IP-2IP, and 1SB-2SB in Fig. 7(a)]. In other words, for a given position, the vacancy formation energy either increases or remains constant. This result is at variance with that found in the case of titanium dioxide, where a more oscillating behavior comes out.Hameeuw et al. (2006b)
The results on tin dioxide vacancy formation energies already available in the literature span a wide range of values. There is a strong dependence on the vacancy type, depth, and concentration, but also on the computational method used for the calculations. For the outermost bridging oxygen vacancy (1B in Fig. 1), the plane-wave calculations of Oviedo and GillanOviedo and Gillan (2000b) and Mäki-Jaskari and RantalaMäki-Jaskari and Rantala (2002) gave values of 2.6 eV and 3.0 eV, respectively. On the other hand, the localized orbital calculations of Sensato et al.Sensato et al. (2002) lead to a value of 4 eV for the formation energy of a fully reduced surface, in which all bridging atoms had been removed. A possible source of discrepancy among the methods can be found in the erroneous evaluation, within a Gaussian basis set, of the charge density in the space region of the missing oxygen,Scorza et al. (1997) due to the non negligible ionicity of tin dioxide. In order to fix this error, we added three Gaussian type functions to the original basis set centered at the vacancy site (ghost orbitals).Scorza et al. (1997) We verified that the addition of ghost orbitals reduces the vacancy formation energy (it is eV for the 1B vacancy), which leads to a better agreement with the plane-wave results. Another important source of discrepancy lies in the use of either PSPs or USPs in the plane-wave approach, which causes strong variations of the vacancy formation energies.Mäki-Jaskari and Rantala (2001) The data reported in Fig. 7 show the overall fair agreement that we obtained for the vacancy formation energy using either the all-electron B3LYP Gaussian basis set or the pseudopotential plane-wave LDA calculations.
Figure 7(b) shows the energy gap as a function of the vacancy depth. strongly depends on the hybridization of atomic orbitals surrounding the vacancy, which explains the dependence on the vacancy site. An interesting point is that, with the exception of the more exposed (1B) oxygen whose removal leads to the lowest value of the energy gap (due to the formation of many states within the gap), for each vacancy type there is a negligible dependence on the depth. There is a gap for bridging, in-plane, and sub-bridging vacancies. Since such a behavior seems very promising for technological applications, further calculations are being performed on deeper vacancy sites. Figure 7(c) shows the HOS binding energy with respect to the vacuum level. There is an overall reduction of the HOS energy upon increasing the depth at which the vacancy is formed. This reduction of the HOS is in line with the electron affinity increase (see below). Unfortunately, in the literature, there is a lack of experimental measurements of the HOS energy versus the vacancy depth.
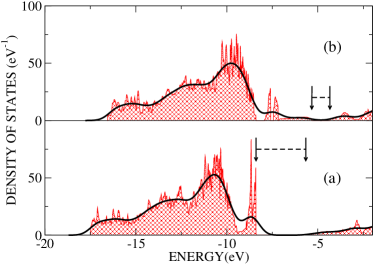
In Fig. 8, we show the DOS of both the stoichiometric surface [panel (a)] and of the surface with a bridging (1B) oxygen vacancy [panel (b)]. The reference energy is the vacuum level. As already mentioned, the surface reduction (e.g., after sputtering) leads to the formation of intragap surface states,Cox et al. (1988); Themlin et al. (1990) but the oxidized (stoichiometric) surface shows surface states as well (see Fig. 5). This explains the experimental finding that the annealing process in air does not fully remove the intragap states. We find that the stoichiometric surface is featured by occupied intragap states at about 1 eV above the top bulk valence band. This is in agreement with previous calculationsMäki-Jaskari and Rantala (2001); Manassidis et al. (1995) and experiments.Themlin et al. (1990) Upon reduction of the surface, a continuum of occupied states which covers a wide energy range within the bulk band gap is experimentally reported.Cox et al. (1988) This clearly emerges from Fig. 8(b). The main peak above the bulk valence band is lower in value than the corresponding peak of the stoichiometric surface. At the same time, a wider energy range within the bulk gap is spanned by the occupied states. In the figure, the highest occupied and lowest unoccupied states are indicated with arrows and the forbidden energy window between those states is reported using a dashed line. The reduction in the energy gap due to the presence of the vacancy is clearly seen. From Fig. 8, we also observe the shift to higher energies of the whole bulk spectrum of the defected with respect to the stoichiometric surface. This is in agreement with the decrease in work function by about 1 eV reported in the experimental literature.Batzill et al. (2004, 2006)
V SnO surface
For the study of oxygen vacancies at the SnO surface, we have considered a reconstruction (double cell, i.e., the area is doubled with respect to the unit cell of the bulk geometry). We studied the vacancy formed by removing a top bridging oxygen atom from each unit cell with a vacancy-vacancy distance of 7.4 Å.
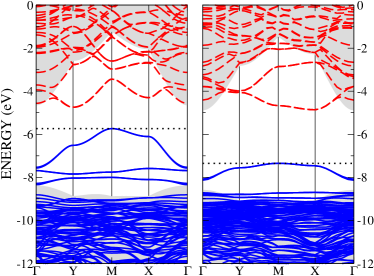
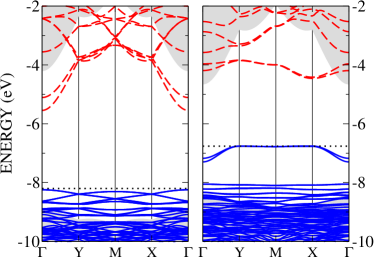
In Fig. 9, the band structures of the stoichiometric (left panel) and the defected (right panel) surfaces are shown. In order to compare both band structures, a reconstruction is considered for the stoichiometric surface as well. Similarly to what is discussed in the case of the SnO surface, the presence of the surface leads to the formation of surface bands within the bulk band gap. The stoichiometric surface has a direct gap at , with an energy gap of 2.7 eV. The presence of the oxygen vacancy leads to the formation of a doubly degenerate occupied energy level, which is well separated from all the other bands. This level shows a parabolic dispersion near , but it is almost flat elsewhere inside the first Brillouin zone.. From the PDOS analysis, we found that the corresponding states are well localized around the vacancy site, which explains in this way the lack of dispersion. The oxygen vacancy is also responsible for a level resonant with the conduction band. At variance with the stoichiometric surface, the bottom of the conduction band for the defected surface lies at the point.
The first allowed transition for the SnO surface when a top bridging oxygen vacancy is formed is at the point. Interestingly, the electron and hole states involved in this direct-gap recombination are quite localized around the vacancy site. This localization leads to a strong oscillator strength and may explain the photoluminescence activity of tin dioxide nanowires.Luo et al. (2006); Lettieri et al. (2006)
VI Electron affinity
Electron affinity (EA) variations induced by the presence of vacancies have been studied for oxygen vacancies located on the first two layers of the SnO surface [see Fig. 1(a)]. This part of the work has been done using the quantum-espresso code. The EA can be easily calculated once the vacuum level has been determined from the self-consistent electrostatic potential.Borriello et al. (2007) The results are collected in Table 2. In this table, we give, for each vacancy type, the depth of the removed oxygen calculated from the top bridging oxygen. It is of interest to see how the different vacancies contribute to the EA.
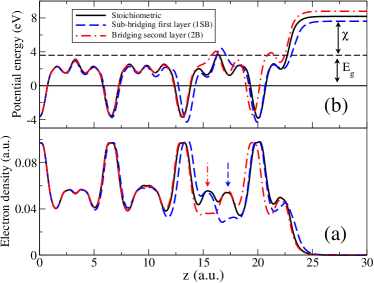
The top panel of Fig. 10 shows the planar average of the electrostatic potential. The averages are taken on planes parallel to the surface (the coordinate lies along the surface normal and =0 corresponds to the slab center). The potential is shown for the stoichiometric case and for the 1SB and 2B vacancies. If we take the stoichiometric surface as a reference, it is seen that the 2B vacancy induces an EA variation of 0.62 eV, whereas the variation due to the 1SB vacancy is of -0.57 eV. This difference in both the amplitude and sign arises from the different electron charge density and atomic relaxations following the oxygen removal. To better illustrate this point, we plot in the bottom panel of Fig. 10 the planar averaged electron charge density. An electron density depletion occurs in correspondence of the vacancy site, as indicated by the vertical arrows in the figure. Moreover, the atomic relaxation can be inferred from the shift of the charge density peaks. The combination of both the charge depletion and the atomic relaxation gives rise to an electric dipole variation (that we have calculated as in Ref. Borriello et al., 2007) a.u. for 1SB and a.u. for 2B. The change in the electron affinity due to a change in the surface dipole is , where is the surface unit cell area (all quantities measured in atomic units).Luth (1995); Borriello et al. (2007) Within the surface dipole model, we therefore obtain eV for the 1SB vacancy and eV for the 2B vacancy with remarkable agreement with the data of Table 2.
| Vacancy type | Depth | EA | EA |
|---|---|---|---|
| 1B | 0.0 | 3.69 | -0.90 |
| 1IP | 1.23 | 4.00 | -0.59 |
| 1SB | 2.70 | 4.02 | -0.57 |
| 2B | 3.60 | 5.20 | 0.62 |
| 2IP | 4.87 | 4.54 | -0.05 |
| 2SB | 6.30 | 4.91 | 0.33 |
| Stoichiometric | 4.59 | 0.0 |
Few experimental works have been published on the dependence of electron affinity and work function on the surface oxidation.Cox et al. (1988); Szuber et al. (2000) In particular, in Ref. Cox et al., 1988, a careful study was done on the effects of the annealing temperature on the electron affinity and conductivity of an oxidized (presumably stoichiometric) SnO surface. Cox et al.Cox et al. (1988) found that upon increasing the annealing temperature, the amount of oxygen lost by the surface increases. They concluded that for temperatures up to about 700 ∘K, only the bridging oxygen (1B in Fig. 1) is removed from the surface followed, at higher temperatures, by the in-plane oxygen. This trend is in qualitative agreement with the vacancy formation energies shown in Fig. 7(a). The results of Ref. Cox et al., 1988 show that the variation of electron affinity with respect to the stoichiometric surface is negative, with a maximum variation of about eV upon increasing the annealing temperature. This is compatible with our results in Table 2. However, it should be stressed that a strict comparison between our results and the experimental data is made difficult by both the uncertainties in the actual surface structure and the computational difficulties in analyzing a large number of different vacancy configurations.
Finally, we conclude by noticing that the recently reported decrease in the work function of about eV upon reducing the surfaceBatzill et al. (2004, 2006) is in agreement with the results shown in Table 2, where the electron affinity decreases by eV when an outermost oxygen atom is removed from the stoichiometric surface.
VII Conclusions
By using ab initio computational methods, we have studied the formation of oxygen vacancies at the SnO and surfaces and their role on the surface electronic properties. As expected, the formation energy tends to increase, when the vacancy moves from the surface to subsurface layers. The energy gap, instead, is very sensitive to the vacancy geometry (and reconstruction), but it only weakly depends on the layer depth inside the material. Interesting results on the alignment of energy levels and the appearance of intragap states have been discussed in connection with the presence of oxygen vacancies.
Some results have also been obtained concerning the role of oxygen vacancies in bulk tin dioxide. We have found that oxygen vacancies do not lead to the formation of occupied donor levels which are just below the conduction band. Instead, the present calculations have shown that occupied levels associated to the vacancy appear at about 1 eV above the top valence band.
Another important conclusion of the present work is that the process of surface reduction, which leads to the removal of the most external oxygen atoms, pushes the density of states spectra to higher energies, as already known from experimental results.
Finally, our calculations have shown that oxygen vacancies may significantly modify the material electron affinity. Interestingly, subsurface vacancies can either increase or decrease the electron affinity and this effect can be described in terms of a surface dipole layer that takes contributions from both the atomic relaxation and electron charge depletion around the missing oxygen. These findings could help in understanding the basic physics of the SnO2 surfaces.
Acknowledgements.
Financial support from the projects PON S.Co.P.E. and PON STSS-500 is acknowledged. Calculations were performed at CINECA-Bologna (“Progetti Supercalcolo 2007”) advanced computing facilities.References
- Batzill and Diebold (2005) M. Batzill and U. Diebold, Prog. Surf. Sci. 79, 47 (2005).
- Oviedo and Gillan (2000a) J. Oviedo and M. J. Gillan, Surf. Sci. 463, 93 (2000).
- Oviedo and Gillan (2000b) J. Oviedo and M. J. Gillan, Surf. Sci. 467, 35 (2000).
- Bouzoubaa et al. (2005) A. Bouzoubaa, A. Markovits, M. O. Calatayud, and C. Minot, Surf. Sci. 583, 107(2005).
- Mäki-Jaskari and Rantala (2002) M. A. Mäki-Jaskari and T. T. Rantala, Phys. Rev. B 65, 245428 (2002).
- Cox et al. (1988) D. F. Cox, T. B. Fryberger, and S. Semancik, Phys. Rev. B 38, 2072 (1988).
- Themlin et al. (1990) J. M. Themlin, R. Sporken, J. Darville, R. Caudano, J. M. Gilles, and R. L. Johnson, Phys. Rev. B 42, 11914 (1990).
- Gurlo (2006) A. Gurlo, ChemPhysChem 7, 2041 (2006).
- Bergermayer and Tanaka (2004) W. Bergermayer and I. Tanaka, Appl. Phys. Lett. 84, 909 (2004).
- Kiliç and Zunger (2002) C. Kiliç and A. Zunger, Phys. Rev. Lett. 88, 095501 (2002).
- Sensato et al. (2002) F. R. Sensato, R. Custódio, M. Calatayud, A. Beltrán, J. Andrés, J. R. Sambrano, and E. Longo, Surf. Sci. 511, 408 (2002).
- Parr and Yang (1989) R. G. Parr and W. Yang, Density-Functional Theory of Atoms and Molecules (Oxford University Press, New York, 1989).
- Becke (1988) A. D. Becke, Phys. Rev. A 38, 3098 (1988).
- Becke (1993) A. D. Becke, J. Chem. Phys. 98, 5648 (1993).
- Lee et al. (1988) C. Lee, W. Yang, and R. G. Parr, Phys. Rev. B 37, 785 (1988).
- Pople et al. (1992) J. A. Pople, P. M. W. Gill, and B. G. Johnson, Chem. Phys. Lett. 199, 557 (1992).
- Dovesi et al. (2006) R. Dovesi et al., CRYSTAL06 User’s Manual (Università di Torino, Torino, 2006).
- Muscat et al. (2001) J. Muscat, A. Wander, and N. M. Harrison, Chem. Phys. Lett. 342, 397 (2001).
- Dobbs and Hehre (1987) K. D. Dobbs and W. J. Hehre, J. Comput. Chem. 8, 880 (1987).
- Causà et al. (1986) M. Causà, R. Dovesi, C. Pisani, and C. Roetti, Phys. Rev. B 33, 1308 (1986).
- Scorza et al. (1997) E. Scorza, U. Birkenheuer, and C. Pisani, J. Chem. Phys. 107, 9645 (1997).
- (22) S. Baroni et al., http://www.pwscf.org
- Cantele et al. (2006) G. Cantele, F. Trani, D. Ninno, M. Cossi, and V. Barone, J. Phys.: Condens. Matter 18, 2349 (2006).
- Buonocore et al. (2008) F. Buonocore, F. Trani, D. Ninno, A. D. Matteo, G. Cantele, and G. Iadonisi, Nanotechnology 19, 025711 (2008).
- Manassidis et al. (1995) I. Manassidis, J. Goniakowski, L. N. Kantorovich, and M. J. Gillan, Surf. Sci. 339, 258 (1995).
- Hameeuw et al. (2006) K. J. Hameeuw, G. Cantele, D. Ninno, F. Trani, and G. Iadonisi, J. Chem. Phys. 124, 024708 (2006).
- Baur and Khan (1971) W. H. Baur and A. A. Khan, Acta Crystallogr., Sect. B: Struct. Crystallogr. Cryst. Chem. 27, 2133 (1971).
- Button et al. (1971) K. J. Button, C. G. Fonstad, and W. Dreybrodt, Phys. Rev. B 4, 4539 (1971).
- Godin and LaFemina (1993) T. J. Godin and J. P. LaFemina, Phys. Rev. B 47, 6518 (1993).
- Mäki-Jaskari and Rantala (2001) M. A. Mäki-Jaskari and T. T. Rantala, Phys. Rev. B 64, 075407 (2001).
- Batzill et al. (2004) M. Batzill, K. Katsiev, and U. Diebold, Appl. Phys. Lett. 85, 5766 (2004).
- Hameeuw et al. (2006b) K. Hameeuw, G. Cantele, D. Ninno, F. Trani, and G. Iadonisi, Phys. Status Solidi A 203, 2219 (2006).
- Batzill et al. (2006) M. Batzill, K. Katsiev, J. M. Burst, Y. Losovyj, W. Bergermayer, I. Tanaka, and U. Diebold, J. Phys. Chem. Solids 67, 1923 (2006).
- Luo et al. (2006) S. Luo, P. K. Chu, W. Liu, M. Zhang, and C. Lin, Appl. Phys. Lett. 88, 183112 (2006).
- Lettieri et al. (2006) S. Lettieri, A. Bismuto, P. Maddalena, C. Baratto, E. Comini, G. Faglia, G. Sberveglieri, and L. Zanotti, J. Non-Cryst. Solids 352, 1457 (2006).
- Borriello et al. (2007) I. Borriello, G. Cantele, D. Ninno, G. Iadonisi, M. Cossi, and V. Barone, Phys. Rev. B 76, 035430 (2007).
- Luth (1995) H. Luth, Surfaces and Interfaces of Solid Materials (Springer-Verlag, Berlin, , 1995).
- Szuber et al. (2000) J. Szuber, G. Czempik, R. Larciprete, and B. Adamowicz, Sens. Actuators B 70, 177 (2000).