Spitzer–MIPS Observations of the Cha Young Association
Abstract
We have mapped the Chamaeleontis young stellar association in the far-infrared with the Multiband Imaging Photometer for Spitzer (MIPS) on the Spitzer Space Telescope. All sixteen members within the map region were detected at 24 m, along with five members at 70 m and two at 160 m. Ten stars show far-infrared excess emission indicating the presence of circumstellar disks; six of these have central clearings as evidenced by the onset of excess emission at 5 m. No new infrared excess sources are identified among the 113 2MASS field stars with 24 m photometry but not seen as X-ray sources, indicating that membership lists derived from X-ray surveys are reasonably complete. Circumstellar disks in the Cha association span the range from 10-1 to 10-4 in their fractional infrared luminosity, with a median Ld/L∗ of 0.04. The presence of optically thick, optically thin, and intermediate optical depth disks within the same stellar group, in combination with the large fraction of disks with inner holes, indicates that the Cha association represents a crucial stage in circumstellar disk evolution.
1 Introduction
The young stellar association around the B8V star Chamaeleontis (HD 75416; IRAS F08430-7846) presents an excellent opportunity to study the early evolution of circumstellar disks which may form planetary systems. The association was discovered by Mamajek et al. (1999), and lies at a distance of 97 pc. Age estimates from comparison with stellar evolution models range from 4 to 15 Myr with more recent values averaging about 8 Myr (Mamajek et al. (1999); Luhman & Steeghs (2004); Lyo et al. (2004)). Luhman & Steeghs (2004) lists 18 association members, including a late-age classical T Tauri star (Lawson et al., 2002). Other members show weak H emission, some with evidence for continuing accretion (Lawson et al., 2004). A deficit of wide binaries was noted in the association by Brandeker et al. (2006). Three members (including Cha itself) have 25 m excess indicated by the IRAS Faint Source Survey (Moshir 1992); two of these were found to have band excess by Haisch et al. (2005). The Cha association has already been the target of two studies with the Spitzer Space Telescope. Megeath et al. (2005) targeted 17 members with the Infrared Arrary Camera (IRAC), and found six members with 8 m excess. Bouwman et al. (2006) used the Infrared Spectrograph (IRS) to measure the 15 late type members from 8-33 m, reporting excess in 8 objects.
In order to probe the outer regions of these disks beyond the “snow line” where giant planets might potentially form, observations at longer infrared wavelengths are needed. Far-infrared observations are also crucial to inform comparisons between disk properties in Cha and the debris disks of older field stars (which are primarily manifest at 60 m.) Spitzer’s far infrared camera MIPS (Multiband Imaging Photometer for Spitzer; Rieke et al. (2004)) provides unprecedented sensitivity in this wavelength region. In this contribution, we report the MIPS results for Cha.
2 Observations
Spitzer/MIPS was was used to map a region covering most of the known members of the Cha association. A “medium scan” map with half-array cross-scan offsets provided total integration times of 80 sec, 40 sec, and 8 sec throughout the mapped area at 24, 70, and 160 m, respectively. The observations were carried out on 2005 April 08 (2.6 hr duration starting at JD2453469.11412) under Spitzer program #100, Spitzer AORKEY 4938752. Our complete 24 m map appears in Figure 1.
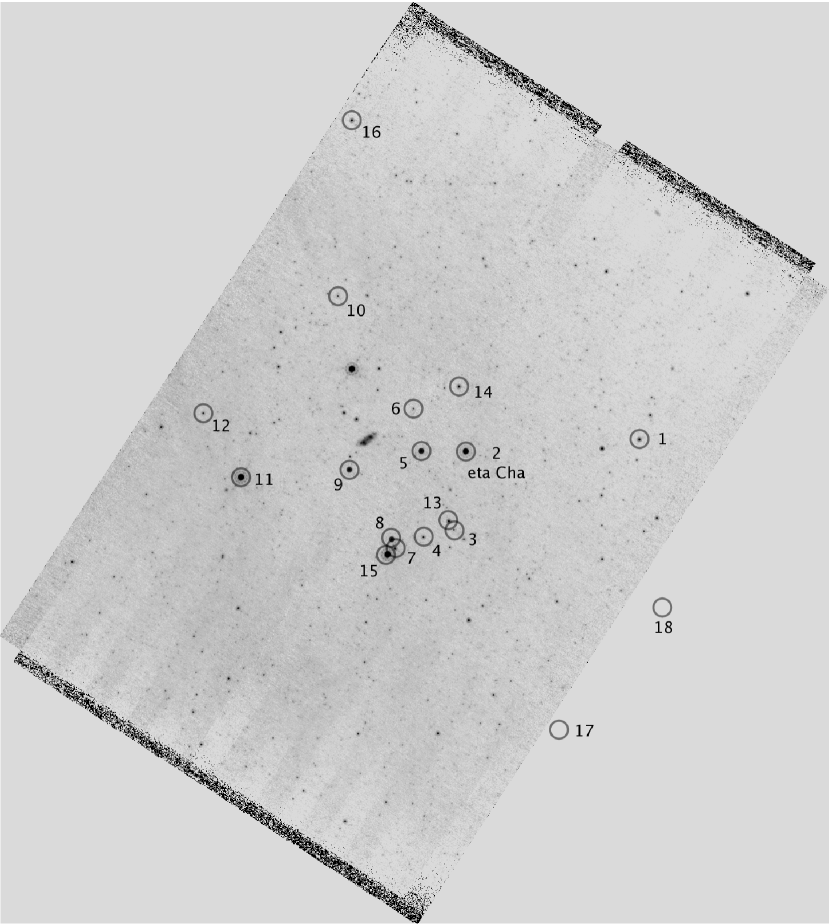
Table 1 presents photometry of the Cha association members as well as upper limits for undetected sources. Note that the ECHA source numbers correspond to the source ID numbers given in Luhman & Steeghs (2004). ROSAT Eta Cha X-ray (RECX) numbers also correspond for objects 1-12. The objects known by ECHA numbers 17 and 18 were not measured as they are off the edge of our map.
The 24 m data were reduced starting from the standard Spitzer Science Center (SSC) pipeline-produced basic calibrated data (BCD), version S13.2. (See Gordon et al., 2005, for a description of the pipeline.) The BCDs suffered from low-level cosmetic defects which were removed by self-flattening the data as described in the MIPS Data Handbook. The MOPEX software package (Makovoz & Marleau, 2005) was used to re-mosaic the BCDs at a pixel scale of 2.5″ per pixel, very close to the native pixel scale, and to obtain PSF-fitted source extractions. Seven hundred fifteen sources with SNR were extracted from the 24 m scan map. Of the 715 sources, 129 have 2MASS counterparts. All 16 known association members that fell within our map were detected. The systematic uncertainty in the 24 m zero-point is estimated to be 4% (Engelbracht et al., 2007). The formal statistical uncertainties are reported in Table 1. An additional assessment of our measurement uncertainty appears in §3.1.
For 70 m, we started with the filtered BCDs for which an automated attempt has been made to remove instrumental signatures. MOPEX was used to mosaic the BCDs at a pixel scale of 4″, about half of the native scale, and to do PSF-fitted source extraction. Here again, the statistical uncertainties are reported in Table 1. The estimated systematic uncertainty is 10% (Gordon et al., 2007). About 40 sources with SNR were extracted at 70 m, 21 with 2MASS counterparts. Five of the known association members were detected; upper limits for the remaining observed association members were obtained via an examination of the scatter in the background at the expected location of the source (following Rebull et al., 2007b). Those 3- upper limits appear in Table 1. ECHA 16, which was observed in the 24 m map, was just off the edge of the 70 m map, so no measurement was obtained for this object.
For 160 m we followed Rebull et al. (2007b) starting with the raw BCDs, but using the MIPS Data Analysis Tool (DAT) software (version 3.06; Gordon et al. 2005) for the final data reduction. At 160 m the map was measured only at the locations of known association members. Two members were detected. The MIPS 160 m array suffers from a spectral leak that allows near-IR radiation to produce a ghost image adjacent to the true 160 micron source image for stellar temperature, roughly Rayleigh-Jeans, sources brighter than . None of the Cha members are as bright as this limit, so no correction for leak images was needed. Three- upper limits for undetected members were obtained as in Rebull et al. (2007b) and are given in Table 1.
We compiled optical and NIR photometry for the known members from the literature, primarily 2MASS (Skrutskie et al., 2006) and Luhman & Steeghs (2004) for shorter wavelengths. For longer wavelengths we used the IRAC photometry as reported by Megeath et al. (2005) for the known members and IRS photometry reported by Bouwman et al. (2006) at 13 and 33 m. For the known cluster members, spectral types are available in the literature. These spectral types were used to select a stellar photosphere model spectrum from the closest corresponding Kurucz-Lejeune model (Lejeune et al., 1997), which was then normalized to each object’s flux density at , except for ECHA 11 which was normalized at J (see section 3.3). No further manipulation of the spectral fit was made. In particular no redding corrections were required, consistent with the results of Luhman & Steeghs (2004) and Lyo et al. (2004). The normalized photosphere models were used to predict the photospheric flux density at 24, 70, and 160 m that are presented in Table 1.
In order to band-merge across wavelengths from optical to 160 m, we matched the central positions derived from photometry of each source to the expected position of each known association member. Since the source density in this field is not high, spurious source matches are relatively unlikely. IRAC and 2MASS positions were matched within 1 arcsecond to the MIPS-24 position, and within 2 arcseconds to the MIPS-70 position. Photometry for 160 m was done by hand at the position of the association member.
Note that the MIPS spatial resolution (, , and for 24, 70, and 160 m, respectively) is poor compared to most optical surveys, so source confusion is in theory a concern. In practice, this is a sparse enough association that source confusion among members is not a concern. The chances of a random alignment of a background galaxy on top of a known association member are not large given the intense scrutiny (including spectroscopy and deep and/or high-spatial-resolution observations) of these association members to this point (see, e.g., Lyo et al., 2006).
| ECHA | name | 2MASS ID | Spectral | pred. 24 m | meas. 24 m | pred. 70 m | meas. 70 m | pred. 160 m | meas. 160 m | LIRexcess/Lstar |
|---|---|---|---|---|---|---|---|---|---|---|
| number | Type11Spectral types from Luhman & Steeghs (2004) except as explained in note 2 | (mJy) | (mJy) | (mJy) | (mJy) | (mJy) | (mJy) | |||
| 01 | EG Cha | 08365623-7856454 | K6, K7.022Spectral types from Lyo et al. (2004) used for improved model fits as explained in section 3.3 | 10.21 | 10.11 0.04 | 1.2 | 16 | 0.23 | 121 | … |
| 02 | Cha | 08411947-7857481 | B8 | 34.54 | 113.30 0.07 | 4.0 | 31.1 0.1 | 0.74 | 270 | |
| 03 | EH Cha | 08413703-7903304 | M3.25 | 1.82 | 2.23 0.04 | 0.2 | 19 | 0.04 | 133 | |
| 04 | EI Cha | 08422372-7904030 | M1.75 | 3.91 | 5.37 0.04 | 0.5 | 17 | 0.09 | 127 | 0.0003 |
| 05 | EK Cha | 08422710-7857479 | M4 | 1.27 | 57.74 0.07 | 0.2 | 94.8 0.2 | 0.03 | 165 48 | 0.06 |
| 06 | EL Cha | 08423879-7854427 | M3 | 2.04 | 1.86 0.04 | 0.3 | 16 | 0.05 | 228 | … |
| 07 | EM Cha | 08430723-7904524 | K6, K6.922Spectral types from Lyo et al. (2004) used for improved model fits as explained in section 3.3 | 7.77 | 7.20 0.04 | 0.9 | 23 | 0.17 | 135 | … |
| 08 | RS Cha AB | 08431222-7904123 | A7 | 32.61 | 44.86 0.06 | 3.8 | 17 | 0.71 | 195 | … |
| 09 | EN Cha | 08441637-7859080 | M4.5 | 2.05 | 43.80 0.07 | 0.3 | 50.8 0.2 | 0.05 | 133 | 0.04 |
| 10 | EO Cha | 08443188-7846311 | M1 | 3.40 | 2.81 0.04 | 0.4 | 17 | 0.08 | 180 | … |
| 11 | EP Cha | 08470165-7859345 | K5.5, K6.522Spectral types from Lyo et al. (2004) used for improved model fits as explained in section 3.3 | 7.14 | 198.20 0.09 | 0.8 | 184.7 0.2 | 0.16 | 208 48 | 0.04 |
| 12 | EQ Cha | 08475676-7854532 | M3.25 | 4.59 | 4.33 0.05 | 0.6 | 19 | 0.11 | 122 | … |
| 13 | HD 75505 | 08414471-7902531 | A1 | 11.92 | 10.41 0.04 | 1.4 | 18 | 0.26 | 137 | … |
| 14 | ES Cha, ECHA J0841.5-7853 | 08413030-7853064 | M4.75 | 0.45 | 8.63 0.04 | 0.1 | 17 | 0.01 | 173 | 0.04 |
| 15 | ET Cha, ECHA J0843.3-7905 | 08431857-7905181 | M3.25 | 1.79 | 232.50 0.11 | 0.2 | 173.3 0.3 | 0.04 | 121 | 0.19 |
| 16 | ECHA J0844.2-7833 | 08440914-7833457 | M5.75 | 0.25 | 8.68 0.08 | 0.03 | … | 0.01 | … | 0.04 |

3 Results
We analyzed the [24] and [70] colors of our sources and compared the observed spectral energy distributions (SEDs) of the known association members with model photospheric spectra to look for signs of infrared excess.
3.1 vs. [24]
Fig. 2 shows the vs. [24] diagram for the 129 objects we detected at 24 m with counterparts in 2MASS. In this figure most stellar photospheres are near [24]0 and the clump of objects at the lower right are likely galaxies. Six of the known Cha members fall in the upper right of this diagram, showing strong 24 m excess: ECHA 05, 09, 11, 14, 15, and 16. Cha itself (ECHA 02) has a clear excess. Nine other members fall in or just redward of the “photospheric” strip in the vs. [24] diagram. This red trend is not due to observational errors. We examined the scatter in [24] for stars with good measured S/N at 24 m corresponding to 10. Among the 46 stars that are not known members, 10, and 0.5, the mean [24] color is 0.0160.098 mag. We take this to indicate that our measurement error in the color is 0.1 mag. Therefore, the majority of known members just redward of the photospheric strip have clearly non-zero [24] colors.

To understand whether these nine association members near the photospheric strip have infrared excess it is necessary to take into account the spectral types of the individual objects. While the [24] color is near zero for most stellar photospheres, it becomes non-zero and varies with spectral type among M stars (Gautier et al., 2007). Since many of our objects are of spectral type M this effect is important. Figure 3 plots [24] vs. spectral type for all association members. The locus of luminosity class V photospheres was obtained from Lang (1991) for types A to K5 and from Gautier et al. (2007) (and references therein) for K6 through M9. The strong excess sources are still obvious at the top right of the diagram.
Six of the nine association members fall on the locus of photospheric [24] colors and thus do not possess infrared excess. However, three objects (ECHA 03, 04, and 08) show a clear infrared excess. Their [24] uncertainty combined with the dispersion of normal dwarf stars about the plotted locus places ECHA 03 about away and ECHA 04 and 08 about away from the photospheric locus. Their observed 24 m flux densities are 1.23, 1.37, and 1.38 times greater than expected for their spectral type based on our model spectra (see Table 1).
In our large survey field, the possibility exists that previously unrecognized members of the Cha association might be revealed as stars with [24] excess. Figure 2 shows that no obvious new candidates are detected. While objects in the clump of likely galaxies have [24] colors comparable to other Cha members with excess, all are fainter than 13 and thus unlikely to be stars at a distance of 100 pc. This result is consistent with recent deep imaging and spectroscopic studies of the region that have also failed to identify additional members (see, e.g., Lyo et al., 2006).

3.2 vs. [70] and 160 m
Figure 4 shows the vs. [70] diagram for the 21 objects detected at 70 m that have counterparts in 2MASS. As in Figure 2, the clump of objects at the lower right are likely galaxies. Our observations were not sensitive enough to detect stellar photospheres at the distance of Cha, and thus most of the members are not detected (upper limits are shown as arrows). However, five stars show strong 70 m excess: ECHA 2, 5, 9, 11, and 15. All five also have 24 m excess. Our 160 m observations were also not sensitive enough to detect stellar photospheres so the two stars detected, ECHA 5 and 11, show 160 m excess.

3.3 Infrared Excesses of Cha Members
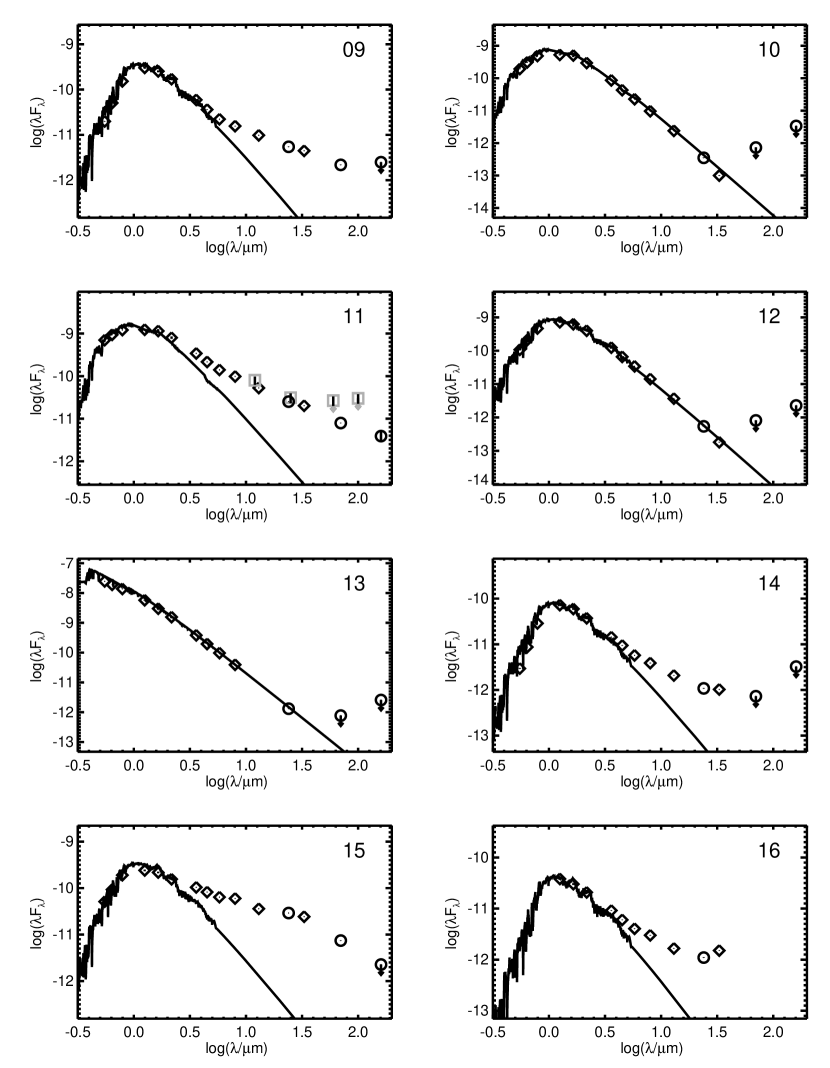
Figures 5 and 6 present the spectral energy distributions (SEDs) for all of the known members of the Cha Association covered by our MIPS map. Spectral types from Table 1 were used to select the model spectra as described in section 2. The spectral types from Lyo et al. (2004) were used for the K type stars, ECHA 1, 7 and 11, as models of the Luhman & Steeghs (2004) types are clearly too blue for these stars and would have required reddening from extinction much greater than allowed by the results of Lyo et al. (2004) and Luhman & Steeghs (2004).
Normalization of the model spectrum at for ECHA 11 did not produce a consistent fit to the measurements at wavelengths shorter than . We therefore normalized ECHA 11 at J, revealing an excess that begins at .
In one object, ECHA 08 (RS Cha), an apparent infrared excess is seen at 5.8, 8.0, and 24 m. This source is a known eclipsing binary with a peak-to-peak amplitude of 0.75 mag (Clausen & Nordstrom, 1980). The ephemeris in Clausen & Nordstrom indicates that the MIPS and IRAC observations were both made outside of eclipse at times when the b magnitude of RS Cha differed by about 0.03. The 2MASS observation was made in the secondary eclipse when RS Cha’s b magnitude was about 0.2 fainter than for the MIPS observation. Given the zero [5.8]-[8.0] color found in simultaneous observations of this source by IRAC (Megeath et al., 2005), and the 0.1 mag slight blue [8.0]-[24] color indicated by our data – both consistent with a stellar photosphere – it appears that our apparent [24] excess of 0.35 mag is an artifact of non-simultaneous photometry.
Another object, ECHA 13, the A1 star HD 75505, is reported by Luhman & Steeghs (2004) to be slightly reddened relative to the other ECHA objects. Lyo et al. (2004) also finds HD 75505 slightly reddened and, based on this reddening and a small KL excess reported by Lyo et al. (2003), attributes the reddening to an edge-on circumstellar disk. We find no evidence for a [24] excess in HD 75505 that might be expected from such a disk. While the absence of a 24 m excess is not evidence of no circumstellar disk, disk material capable of producing the reddening would have to be at a large distance from an A star to be invisible at 24 m. We note that Megeath et al. (2005) did not find a significant [3.6], a color similar to KL, excess for HD 75505.
The availability of the MIPS data now makes it possible to calculate the fractional infrared excess luminosity for each member of the Cha association. Optical and near-infrared points were used to define the stellar photospheres, which were represented as a blackbody at the known effective temperature of each source. Integration of the infrared excess across the Spitzer bands was done done using cubic spline interpolation to the observed mid-infrared and far-infrared data points, and subtracting off the photospheric contribution point-by-point. To account for the excess luminosity out to submillimeter wavelengths, a blackbody extrapolation was performed from the longest available infrared data point, with a blackbody temperature chosen using Wien’s law for that wavelength. The results of this analysis appear in the far right column of Table 1.
4 Disk Properties in the Cha Association
The infrared excesses reported in the literature at some wavelength between 6-160 m in nine association members require that circumstellar dust be present within 10 AU of these stars. A flattened disk is the only dust configuration that could be dynamically stable at the age of the association. From this point forward, we assume that the infrared excesses in the Cha association are produced by dusty circumstellar disks. A tally of our MIPS results shows 9 of 16 association members have excesses at 24 m and at least 5 of the members with 24 m excess also have a 70 m excess. We compare our results to disk indicators from other observations in Cha.
4.1 Spitzer/IRAC
Megeath et al. (2005) found excesses between 3.6-8.0 m in six stars: ECHA 5, 9, 11, 14, 15, and 16. All of these also have excesses in our data at 24 m. There are two stars, ECHA 3 and 4, where we have found MIPS excess but no mid-infrared excess is detected. This is not surprising, as these stars have very subtle MIPS-24 excesses. The steep brightening of the stellar photosphere toward shorter wavelengths would rapidly obscure such a modest mid-infrared excess of the strength seen at 24 m. No IRAC photometry was obtained for Megeath et al. (2005) for ECHA 2, so the inner disk of this source is uncharacterized. The frequency of IRAC excess in the association is 6/17 35%. We note for completeness that Megeath et al. (2005) discussed in detail a comparison between IRAC photometry and the L-band photometry from Lyo et al. (2003); so we do not repeat it here.
4.2 Spitzer/IRS
Bouwman et al. (2006) report 13 and 33 m flux densities for fifteen Cha members, based on Spitzer low-resolution spectra. The same six objects showing IRAC excess above also show 13 m excess. In addition, they found 33 m excess in ECHA 3 and 4 – two stars for which we have found weak 24 m excess. For ECHA 7, Bouwman et al. (2006) report a 33 m flux density of 6.9 mJy, and a 33 m to 13 m flux ratio noticeable larger than for their other diskless stars, but do not classify this as an excess. Our photosphere model is in excellent agreement with the flux densities measured with IRS at 13 m and with MIPS at 24 m. It predicts a flux density of 4.1 mJy at 33 m. The 40% difference between our prediction and the reported 33 m flux is significantly larger than the reported errors in the IRS measurements and argues that ECHA 7 does, in fact, show a 33 m excess. In view of this disagreement on interpretation of 33 m flux of ECHA 7 we examined the now public Spitzer data on which Bouwman et al. based their analysis. We find that the spectrum of the ECHA 7 spectrum beyond 20 m appears to be shallower than the Rayleigh-Jeans spectrum expected for photospheres in this region of the spectrum. A ratio of the ECHA 7 spectrum to the ECHA 1 spectrum, a star with a low value of 33 to 13 m flux ratio from the same IRS cluster observation, also shows that ECHA 7 has significantly shallower slope than ECHA 1 beyond 20 m. Given this evidence, we conclude that ECHA 7 probably has a weak 33 m excess indicative of a disk with a large inner hole. The MIPS 70 m upper limit is consistent with this interpretation. The overall frequency of 13 m excess in Cha is 6/15 40%; the revised frequency of 33 m excess, including ECHA 7, is 9/15 60%.
4.3 Disk Structure
Table 2 summarizes the results for disks in the Cha association. Ten members show infrared excesses attributable to disks at one or more wavelengths between 2.2 and 160 m; nine have excesses detectable by MIPS at 24 m and one has an excess beginning at 33 m. In ECHA 11, 15, and 16, excess is detected from 3.5-33 m (with 11’s excess extending even to 2.2 m), indicating that these objects possess continuous disks extending from near the stellar surface to radii 10s of AU. Remarkably, six of the other disks show evidence for inner holes. ECHA 9 and 14 have small inner holes diagnosed by the presence of excess only for 6 m; ECHA 5 is similar, with the excess starting at 8 m. The SEDs of ECHA 3 and 4 require larger disk inner holes, with excess absent at 13 m but detected at 24 m. Finally, the disk of ECHA 7 has the largest inner hole of all, with a 33 m excess but no 24 m excess. The tenth star with a disk is Cha itself; while the available data does not allow the presence of an inner hole to be discerned, the large ratio of the 24 and 70 m excess fluxes ( 3; Table 1) is characteristic of warm material near 250 K.
4.4 Disks and Mass Accretion
Lawson et al. (2004) studied the H emission in ten members of the association, and found that four show high-velocity line wings indicative of gas accretion: ECHA 5, 9, 11, and 15. Megeath et al. (2005) reanalyzed H data from Song et al. (2004) after the method of White & Basri (2003), and found that ECHA 16 also shows signs of gas accretion. We find that all five of these have circumstellar disks with Ld/L 0.04. The two disks around ECHA 3 and 4, where Spitzer has found weak 24 and 33 m excesses, showed no accretion signatures. These results support the long-known correlation between the strength of disk excess and accretion rates. H studies of ECHA 2 and 14 are still needed to see if this relation holds for all the disks Spitzer has detected in Cha.
| ECHA | H aaAll analysis in this column from Lawson et al. (2004), except ECHA 16, for which Megeath et al. (2005) reanalyzed data from Song et al. (2004) after the method of White & Basri (2003). | Megeath et al. (2005) | Bouwman et al. (2006) | this work |
|---|---|---|---|---|
| (=LS) | IRAC | IRS | MIPS | |
| ECHA 01 | (no data) | no | no | no |
| ECHA 02 | (no data) | (no data) | (no data) | yes |
| ECHA 03 | no | no | yes | yes |
| ECHA 04 | no | no | yes | yes |
| ECHA 05 | yes | yes | yes | yes |
| ECHA 06 | no | no | no | no |
| ECHA 07 | no | no | yesbbThis excess was not claimed in Bouwman et al. (2006). See section 4.2 for explanation. | no |
| ECHA 08 | (no data) | no | (no data) | noccApparent excess not attributable to a disk; see text in section 3.3. |
| ECHA 09 | yes | yes | yes | yes |
| ECHA 10 | no | no | no | no |
| ECHA 11 | yes | yes | yes | yes |
| ECHA 12 | no | no | no | no |
| ECHA 13 | (no data) | no | (no data) | no |
| ECHA 14 | (no data) | yes | yes | yes |
| ECHA 15 | yes | yes | yes | yes |
| ECHA 16 | yes | yes | yes | yes |
| ECHA 17 | (no data) | no | no | (no data) |
| ECHA 18 | (no data) | no | no | (no data) |
4.5 Disks and Binarity
Seven stars in the Cha association are known multiples: ECHA 1, 7, 8, 9, 12, 17, and 18 (Brandeker et al., 2006; Bouwman et al., 2006, and references therein). Infrared excess is detected for ECHA 7 and 9; in ECHA 9, the disk must be circumbinary. Of the eleven single stars, excess is detected around six. While an anticorrelation between disks and binarity is suggested by these results, small number statistics prevent any meaningful conclusion from being drawn.
5 Cha and Other Young Stellar Groups
Two other well-studied stellar associations close in age to Cha also have MIPS studies: the TW Hydra Association (TWA; Low et al., 2005), and the Beta Pic Moving Group (BPMG; Rebull et al., 2007b). At 8-10 Myr, TWA is thought to be comparable in age to Cha, and BMPG is slightly older at 12 Myr. Low et al. (2005) find for TWA that there are very large excesses around four of the TWA stars, with possibly a subtle 24 m excess around one more of the stars. Rebull et al. (2007b) re-reduced the TWA MIPS data in exactly the same fashion as here in Cha and in the BPMG, and find the TWA disk fraction at 24 m to be 7/23 stars, or 30%. Rebull et al. (2007b) find that the BPMG has a 24 m disk fraction of 7 of 30 stars, or 23%. The larger disk fraction we find at 24 m for Cha, 56%, suggests that it may actually be younger than either of these other two associations. Since so many association members are undetected at 70 m, the best constraint we can put on the disk fraction at this wavelength is a lower limit of 31%. We note that the various observational studies of the Cha association are not unbiased with respect to the known association members. Bouwman et al. (2006) excludes the early type members and this paper leaves two objects at 24 m and three objects at 70 m unobserved, with many 70 m upper limits for those that were observed. However this should not affect conclusions based on a larger disk fraction in Cha than in the other associations.
Within our Cha association members, there are three groups of 24 m excess sources attributable to disks. There are stars without excesses at 24 m (ECHA 1, 6, 7, 8, 19, 12 and 13), stars with small excesses (ECHA 2, 3 and 4), and stars with relatively large excesses (ECHA 5, 9, 11, 14, 15 and 16). This is reminiscent of the distribution of TWA 24 m excesses found by Low et al. (2005), where there are either large or subtle 24 m excesses. In our results from Cha, the largest [24] values that we find are those for ECHA 15 (5.73), ECHA 05 (4.62) and ECHA 16 (4.33). ECHA 9, 11, and 14 all have [24]3.8, and the rest are all 1.2. These largest values are close to, but still below, the four extreme TWA stars ([24]=5.8, 5.0, 4.4, and 4.4 for TWA 1, 3, 4, and 11, respectively) from Low et al. (2005). In contrast, Rebull et al. (2007b) find that the BPMG has no extreme excesses – the largest [24] they find is for Pic itself at only 3.5. We can compare the ratios of measured to predicted fluxes at 24 m for each of these three clusters. The median for all MIPS disks is 51.4, 21.2, and 1.83 for TWA, ECHA, and the BPMG, respectively.
We conclude that, while in terms of 24 m disk fraction, the Cha association is younger than both TWA and the BPMG, it is solidly intermediate in disk properties between the two clusters.
Fractional infrared luminosities are shown for nine Cha members in Table 1. Three sources ( Cha itself, ECHA 3 and ECHA 4) have fractional infrared luminosities , which are typical for debris disks around main sequence stars (Bryden et al. 2006; Su et al. 2006). The classical T Tauri star ECHA J0843.3-7905 (ECHA 15) has an Ld/L∗ of nearly 20%, consistent with an optically thick YSO disk like that of TW Hya. Five other members (ECHA 5, 9, 11, 14, and 16) have fractional infrared luminosities of 0.04-0.06. These disks are particularly interesting, as their luminosities are intermediate between those of optically thick young disks and those of debris disks. Other examples of disks with Ld/L∗ in this range have recently been found in Spitzer studies of weak-line T Tauri stars (Padgett et al. 2006; Cieza et al. 2007). Such disks can be explained by one of two models: an optically thick disk that has been highly flattened by settling of dust to its midplane, or an optically thin disk that is 10 denser than the prototypical young disk of Pictoris. Sensitive submillimeter observations will be needed to distinguish between these two possibilities. In either case, these five disk systems systems represent a key transitional stage in disk evolution; further detailed studies are needed.
6 Conclusions
Our Spitzer/MIPS data, combined with a reanalysis of IRAC and IRS data, indicates an overall mid-infrared disk frequency of at least 10/18 56% in the Cha association at ages of 8 Myrs. This is significantly higher than the disk fraction observed in the TW Hydra or Pictoris associations at similar ages.
The Cha disks show clear transitional characteristics between young stellar object and debris disks, both in terms of the distribution of their fractional infrared luminosities and the presence of inner holes (diagnosed by the spectral energy distribution) in 6 of the 10 disks studied.
References
- Bouwman et al. (2006) Bouwman, J., et al., 2006, ApJ, 653, L57
- Brandeker et al. (2006) Brandeker, A., Jayawardhana, R., Khavari, P., Haisch, K.E., Mardones, D. 2006, Ap.J., 652, 1572
- Bryden et al. (2006) Bryden, G., et al., 2006, ApJ, 646, 1038
- Cieza et al. (2007) Cieza, L., et al., 2007, arXiv/0706.0563
- Clausen & Nordstrom (1980) Clausen, J.V. and Nordstrom, B. 1980, A&A, 83, 339
- Engelbracht et al. (2007) Engelbracht, C., et al., 2007, PASP, in press
- Gautier et al. (2007) Gautier, T. N., et al., 2007, ApJ, 667, 527
- Gordon et al. (2005) Gordon, K., et al., 2005, PASP, 117, 503
- Gordon et al. (2007) Gordon, K., et al., 2007, PASP, in press
- Haisch et al. (2005) Haisch, K.E. Jr., Jayawardhana, R., and Alves, J. 2005 ApJ, 627 L57
- Lang (1991) Lang, K. R. 1991, Astrophysical Data, Springer-Verlag, New York
- Lawson et al. (2002) Lawson, W.A., Crause, L.A., Mamajek, E.E., and Feigelson, E.D. 2002 MNRAS, 329 L29
- Lawson et al. (2004) Lawson, W.A., Lyo, A-R. and Muzerolle, J. 2002 MNRAS, 351 L39
- Lejeune et al. (1997) Lejeune, T., Cuisinier F., & Buser R. 1997, A&AS, 125, 229
- Low et al. (2005) Low, F., et al., 2005, ApJ, 631, 1170
- Luhman & Steeghs (2004) Luhman, K.L. and Steeghs, D. 2004, ApJ, 609, 917
- Lyo et al. (2003) Lyo, A-R., et al., 2003, MNRAS, 338, 616
- Lyo et al. (2004) Lyo, A-R., et al., 2004, MNRAS, 355, 363
- Lyo et al. (2006) Lyo, A-R., et al., 2006, MNRAS, 368, 1451
- Makovoz & Marleau (2005) Makovoz, D., & Marleau, F., 2005, PASP, 117, 1113
- Mamajek et al. (1999) Mamajek, E.E., Lawson, W.A., and Feigelson, E.D. 1999, ApJ, 516 L77
- Mamajek et al. (2000) Mamajek, E.E., Lawson, W.A., Feigelson, E.D. 2000, ApJ, 544, 356
- Megeath et al. (2005) Megeath, S.T. et al., 2005 ApJ, 634 L113
- Moshir et al. (1992) Moshir, M., Kopman, G., Conrow, T. 1992, IRAS Faint Source Survey and Explanatory Supplement
- Padgett et al. (2006) Padgett, D.L., et al., 2006, ApJ, 645, 1283
- Rieke et al. (2004) Rieke, G., et al., 2004, ApJS, 154, 25
- Rebull et al. (2007a) Rebull, L., et al., 2007a, ApJS, 171, 447
- Rebull et al. (2007b) Rebull, L., et al., 2007b, ApJ, submitted
- Skrutskie et al. (2006) Skrutskie, M., et al., 2006, AJ, 131, 1163
- Song et al. (2004) Song, I., et al., 2004, ApJ, 600, 1016.
- Su et al. (2006) Su, K.Y.L. et al., 2006, ApJ, 653, 675
- Werner et al. (2004) Werner, M., et al., 2004, ApJS, 154, 1
- White & Basri (2003) White, R., & Basri, G., 2003, ApJ, 582, 1109