Compact groups in theory and practice - I. The spatial properties of compact groups
Abstract
We use a mock galaxy catalogue based upon the Millennium Run simulation to investigate the intrinsic spatial properties of compact groups of galaxies. We find that approximately 30 % of galaxy associations identified in our mock catalogue are physically dense systems of four or more galaxies with no interlopers, approximately half are close associations of 2, 3 or 4 galaxies with one or more interlopers, and the remainder are not physically dense (projections of looser groups and physically unassociated galaxies). Thus the effect of interloping galaxies is significant. However, we find that genuine compact groups are preferentially brighter and more isolated than those with interlopers; by increasing the required minimum surface brightness of a group from the canonical value of mags arcsec-2 to mags arcsec-2, we can increase the proportion of genuinely compact systems identified with no interlopers from % to 75%. Of the genuine compact groups identified, more than half consist of a single dark matter halo with all the member galaxies deeply embedded within it. In some cases, there are other galaxies which share the same halo (typically with mass M⊙) but which are not identified as being members of the compact group. This implies that compact groups are associated with group environments, some or all members of which are in the compact group. For those compact groups where all galaxies are in the same halo, the three-dimensional velocity dispersion of the compact group correlates broadly with the virial velocity of the dark matter halo. However, the scale-size of the group - and hence the fraction of the halo mass which the group samples - is completely uncorrelated with the properties of the dark matter halo. This means that masses derived under the simple assumption of virial equilibrium using the observed velocity dispersions and sizes of compact groups give incorrect estimates of the true mass of the underlying dark matter.
keywords:
methods: statistical - catalogues - surveys - galaxies: general - galaxies: interactions1 Introduction
In broad terms, a compact group (CG) of galaxies is a group of galaxies in which the typical inter-galactic separation is of order the scale of the galaxies. CGs were first quantitatively defined by Rose (1977) and Hickson (1982), although their original identification significantly predates these studies. Some of the most famous examples of CGs include Stephan’s Quintet (Stephan 1877) and Seyfert’s Sextet (Seyfert 1948). The advent of the first large area surveys, especially the Palomar Observatory Sky Survey (POSS), greatly increased the pace of discovery of CGs. CGs make up some of the objects identified by Vorontsov-Velyaminov (1959), Vorontsov-Vel’Yaminov (1977) and Arp (1966), in their catalogues of interacting galaxies. Studies initiated by Shakhbazian (1973) resulted in the identification of a few hundred ‘compact groups of compact galaxies’. Later studies by Hickson et al. (1977) and Heiligman & Turner (1980) identified CGs using qualitative selection criteria based upon their morphological appearance.
The most famous and well studied catalogue of CGs is the Hickson Compact Groups (HCGs; Hickson 1982) which were identified from the POSS using quantitative criteria based on the number and flux density of galaxies in a group (see Section 2.1 for a discussion of the selection criteria). The original catalogue consists of 451 galaxies in 100 different groups. Since its creation, several other catalogues of CGs have been compiled, including (but not limited to) the Digitized POSS CG catalog (Iovino et al. 2003), the Southern CG catalogue (Prandoni et al. 1994; Iovino 2002), CGs in the UZC galaxy catalogue (Focardi & Kelm 2002), the CfA2 redshift survey (Barton et al. 1996), the Las Campanas redshift survey (Allam & Tucker 2000), and the SDSS Commissioning Data (Lee et al. 2004).
When redshifts were measured for the members of Stephan’s Quintet and Seyfert’s Sextet, it was found that not all of the galaxies were at the same redshift. Indeed, the physical nature of CGs has been a topic of debate for many decades (see, e.g., Burbidge & Burbidge 1961). Mamon (1986) argued that, instead of being physically dense systems, roughly half of all CGs were line-of-sight alignments of galaxies within looser groups. However, Hickson & Rood (1988) refuted this and found the probability of such an occurrence to be smaller than predicted by Mamon (1986). More recently, Hernquist et al. (1995) have suggested that CGs may be the result of viewing a cosmological filament end-on. Ponman et al. (1996) have surveyed the HCGs with ROSAT and implied that hot intra-group gas is present in of the systems. The presence of such gas is strong evidence that the majority of CGs are physically dense, even if some of their members are interlopers.
The apparent high densities of CGs combined with their generally low velocity dispersions (eg. Hickson et al. 1992), make them an intriguing environment in which to study galaxy evolution. Mergers and interactions should be commonplace, and CGs are potentially an ideal laboratory to study these processes. Calculations by Carnevali et al. (1981) and Barnes (1989) suggest that CG galaxies should merge together on a timescale equal to the crossing time of the group, typically estimated to be of order Gyr. If this is true, then it suggests that CGs must be continually forming in order to compensate for the groups lost through the merging process (Diaferio et al. 1994). However, Governato et al. (1991) show that, for the right choice of initial conditions, CGs can potentially last for as long as Gyrs before merging into a single remnant. Athanassoula et al. (1997) show that CGs can survive for much longer than a Hubble time if they are embedded in massive dark matter haloes.
The selection criteria for CGs inevitably favor the extrema of the population, or those whose orientations to our line of sight are favourable. Thus, despite their existence being known for many years, and despite large amounts of observational effort in cataloging the properties of the HCGs in particular, the physical nature of CGs and their role in the galactic evolution process is still not clear. For example, how dense is the CG environment? How many contain interlopers? Are they dynamically stable? Are they a transient stage in the evolution of looser groups? Do they represent a distinct class of galaxy environment, or are they the extreme end of a larger class? Are they the site of the formation of early-type galaxies? What is their relation to so-called fossil groups? What effect does the CG environment have on the members of the group?
This is the first in a series of papers where we statistically examine the properties of CGs and their member galaxies based on large samples of CGs identified in cosmological simulations and observational surveys. We begin this series by examining the selection criteria of HCGs to determine the three dimensional reality of these systems and the effect of interlopers. This has been a long disputed argument in the field. The advent of large cosmological simulations and the ability to make realistic mock galaxy catalogues means fresh insight can now be obtained. For the first time, we can determine on a statistical basis how many of the HCGs are likely to be genuinely compact systems and explore their spatial properties.
Section 2 describes the Hickson selection criteria and the use of the mock galaxy catalogue. In Section 3, we apply Hickson’s criteria to this catalogue and examine the compactness of the galaxy associations identified. In Section 4, we optimise the selection criteria for CGs in photometric surveys to minimise the effect of interlopers. In Section 5, we take advantage of the cosmological simulations to examine the halo properties of the CGs and their relation to observable quantities. We defer the majority of the discussion of our results until Section 6.
2 Preliminaries
2.1 The Hickson criteria
Hickson (1982) define a CG as a set of galaxies in a photometric survey with projected properties such that
-
1.
;
-
2.
;
-
3.
.
is the number of galaxies within 3 magnitudes of the brightest galaxy and is the effective surface brightness of these galaxies in magnitudes per square arcsec where the total flux of the galaxies is averaged over the smallest circle which contains their geometric centres, and has an angular diameter . is the angular diameter of the largest concentric circle which contains no additional galaxies in the magnitude range of the group or brighter. All magnitudes and surface brightnesses are measured in the band. We hereafter refer to these three criteria collectively as the ‘Hickson criteria’.
The identification of groups of only galaxies from large photometric surveys where the only data available are projected positions and apparent magnitudes is a difficult problem. The Hickson criteria were originally constructed in an attempt to quantify what had up until then been identified by eye, and are inevitably subjective. Criterion (i) ensures that the CG has enough members to constitute a group. A magnitude range is imposed to ensure all members are of broadly equivalent masses. Without it, a galaxy and its satellites (such as the Milky Way and its entourage of dwarf spheroidals) could be identified as a CG. Criterion (ii) attempts to distinguish isolated groups from parts of larger structures, such as cluster cores. Criterion (iii) is, to first order, a distance independent means of defining compactness.
These criteria have been subject to some controversy since Hickson first introduced them. The basic issue is that it is not clear what the physical, three-dimensional reality of the identified galaxy associations are, given that the criteria are applied to projected, two-dimensional datasets. In particular, it is difficult to assess how homogeneous the identified galaxy associations are in terms of their physical compactness and environment, and the contribution from interlopers is unknown. These are fundamental problems for any observational study of CGs.
In what follows, we use the following terminology: ‘Hickson association (HA)’ describes all of the galaxy associations identified in the mock catalogue by application of the Hickson criteria. This is in recognition of the fact that some of these associations will be genuinely compact configurations in three dimensions, some will be projections of looser groups and some may be entirely spurious line-of-sight chance alignments. The term ‘compact association (CA)’ is used to describe the subset of HAs which are truly compact in three dimensions (we define ‘compact’ in Section 3.1).
2.2 The mock galaxy catalogue
The primary goal of this study is to assess the spatial and dynamical properties of compact galaxy groups by using simulations to relate three dimensional group properties to those in redshift space. The Millennium Run simulation of Springel et al. (2005) is a natural starting point: this simulation follows the evolution of dark matter within a cube which is 500 Mpc on a side, from a redshift of 127 to the present day. Here, the Hubble constant is parameterised as km s-1Mpc-1. Several galaxy catalogues have been created by applying semi-analytical models to the output of these simulations (Croton et al. 2006; De Lucia & Blaizot 2007; Bower et al. 2006). In principle, any or all of these catalogues are suitable for the three-dimensional requirements of our compact groups study.
In order to facilitate a direct comparison between simulations and observations, we require a mock redshift survey from these galaxy catalogues. For this task, we use the publicly available Blaizot Allsky catalogues available on the Millennium website111http://www.mpa-garching.mpg.de/millennium/. These mock catalogues were created by applying the Mock Map Facility (MoMaF) code of Blaizot et al. (2005) to the De Lucia & Blaizot (2007) semi-analytic galaxy catalogues. The basic idea which creates the mock catalogue is the replication of the data cube from the simulations (which has periodic boundary conditions) in all directions. Evolution is built in by using time snapshots which correspond to the look-back time of each cube.
Five of the six available Allsky catalogs employ the random tiling technique, which avoids spatial correlations on large scales due to replication of the simulation cube. We choose not to use these catalogues, since the discontinuities which arise between adjacent data cubes may lead to anomalous galaxy group detections. Instead, we use the “Blaizot_Allsky_PT_1” catalogue, which preserves the periodicity of the density field. We note, however, that the periodicity is not a concern on the small scales on which compact galaxy groups are found. Moreover, even if a given galaxy group is detected more than once, it will be viewed from different vantage points, and is therefore likely to have different observable properties.
The mock catalogue we use consists of million galaxies brighter than the magnitude limit of , where is the SDSS red filter. These catalogues contain the key observable properties one would have in a flux-limited survey: namely right ascension, declination and apparent magnitude. In addition, much of the associated information from the De Lucia & Blaizot (2007) galaxy catalogues is also provided, enabling a direct link to three dimensional positions and velocities, as well as intrinsic properties such as absolute magnitudes and stellar mass. These properties will be looked at in detail for the compact groups we detect in the next paper in this series (Brasseur et al. 2008). Here, we are now in a position to detect compact groups in a flux limited mock catalogue, and to relate the observed spatial properties of these groups to their counterparts in three dimensions.
The results we derive are only strictly correct for the mock galaxy catalogue from which they are derived, and any significant change in the input physics of the simulations on which they are based could affect our results. However, the De Lucia & Blaizot (2007) semi-analytic model galaxy catalogues used in this paper are closely related to those of Croton et al. (2006); the latter demonstrated that their galaxy catalogues are broadly consistent with observations of low redshift galaxies, including the luminosity function, the global star formation history, the Tully-Fisher relation, and the colour-magnitude distribution. In addition, the clustering properties of the Croton et al. (2006) catalog appear to be well matched to observations (Springel et al. 2005; Li et al. 2007).
Compact groups have, by definition, small scale radii, and it is therefore important to check that the resolution of the simulation is sufficient to identify these systems. The spatial resolution of the Millennium simulation is 5 kpc (Springel et al. 2005; Croton et al. 2006), set by the softening length of the gravitational force. This resolution scale is significantly less than the mean separation of galaxies in compact groups (Section 3.1) and will not affect the majority of systems we identify. However, interactions between galaxies at very small separations will not be followed accurately.
Similarly, the mass resolution for the identification of galaxy haloes in the simulation is important, particularly during the merging of galaxies. When two haloes start to merge, De Lucia & Blaizot (2007) follow the merger until the substructure drops below the mass resolution limit for the identification of (sub-)haloes. At this point, the two haloes are assumed to fully merge after a time , which is assumed to be twice the dynamical time. However, this timescale is ad-hoc. Changing could affect the number of galaxies we identify as compact groups. To investigate whether this severely affects our results, we calculate the distribution of sub-halo masses for all the galaxies we identify as members of compact groups (i.e., HAs; the halo masses are provided in the De Lucia & Blaizot (2007) catalogues). The mass resolution for the identification of (sub-)haloes in the simulation is M⊙, and we find that less than of galaxies in HAs have haloes this small. Only 5% of the galaxies have haloes with mass M⊙, and more than half of the haloes are larger than the mass resolution limit by more than a factor of 10. The halo masses of CAs (genuinely dense groups of galaxies) are higher still (Section 5). Thus possible uncertainties associated with are likely to have only a small, if not negligible, effect on this study.
Future generations of cosmological simulations will have improved spatial and mass resolution and will be able to more accurately trace the formation and evolution of dense groups of galaxies like compact groups. While this study - like any based on mock catalogues - cannot be definitive due to the many physical and computational uncertainties inherent in simulating cosmological volumes, it is nevertheless impressive that the simulations are of sufficient quality to start to provide a new handle on, and new insight into, the properties of compact groups. Our results are as robust as our current understanding allows, and should provide a useful comparison to samples of compact groups extracted from galaxy surveys such as the SDSS.
3 The predicted spatial characteristics of compact groups
3.1 Degree of compactness
We implement a search algorithm on the mock galaxy catalogue using the Hickson criteria to identify all HAs. In keeping with the original criteria, we use band apparent magnitudes to calculate surface brightnesses. We find HAs in the mock galaxy catalogue which satisfy the Hickson criteria, consisting of a total of galaxies. The benefit of this approach is that we can now cross correlate the two dimensional, projected, properties of each galaxy in every HA with their de-projected properties to determine the three dimensional reality of the HAs.
The intrinsic compactness of a HA is fundamental to studies of compact groups. The effective surface brightness, , is used in projection as a means of characterising compactness. Since three dimensional spatial information is available to us, we choose to use the ‘linking length’, , as a quantitative and robust measure of the three dimensional compactness of each of the 15 122 HA identified in our mock catalogue. This parameter is used extensively in friends-of-friends algorithms which are commonly used to identify galaxy groups when redshift information is available (Huchra & Geller 1982). For our purposes, we calculate the value of for each HA in physical coordinates which corresponds to the minimum linking length that would need to be used to ensure all members of that HA were identified in the simulation upon application of a friends-of-friends algorithm. The use of linking length as a measure of compactness has the added advantage that it is independent of the overall shape of the group: for example, it does not discriminate between a roughly spherical group or an elongated filamentary structure.
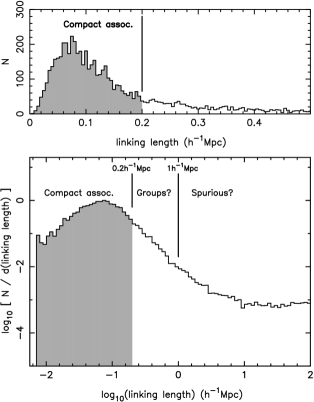
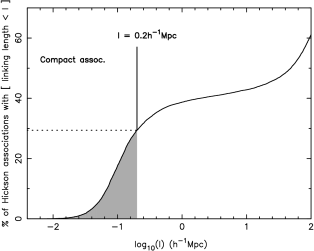
The distribution of three dimensional linking lengths for the identified HAs is shown in Figure 1. The top panel shows the distribution at small linking lengths ( kpc) on a linear scale whereas the lower panel shows the linking lengths for all HAs on a log scale (where each bin has been normalised by its width). The scale on which a HA becomes a CA is, to some extent, subjective. However, the top panel of Figure 1 reveals that Hickson’s criteria preferentially identify HAs with small linking lengths, of order a few hundred kpc or less. Despite this, there is a tail to very large values of , as the lower panel of Figure 1 makes clear. To quantify this further, Figure 2 shows the percentage of HAs with linking lengths less than or equal to .
By our definition, compact associations (CAs) have small values of , of order the scale of the galaxies. Looser groups have intermediate values of ; for example, the linking length of the brightest members of the Local Group, a relatively sparse grouping of galaxies, is approximately kpc. Spurious detections, caused by line-of-sight alignments of unassociated galaxies at different redshifts, yield very large values of . Therefore, a linking length Mpc would indicate that at least some of the galaxies in the HA are unlikely to be physically related to one another. We have indicated approximate ‘boundaries’ between CAs, loose groups and spurious associations in the lower panel of Figure 1.
Given the shape of the distribution of linking lengths in the top panel of Figure 1, and the curve of the distribution in Figure 2, kpc seems a natural division below which groups are classed as compact. It is also approximately the virial radius of galaxy haloes such as that of the Milky Way and M31 (Klypin et al. 2002). Since compact groups are generally understood to be galaxy groups where the typical inter-galactic separation is of order the scale of the galaxies themselves, we adopt kpc as the appropriate scale for CAs. This corresponds to the shaded areas of Figures 1 and 2. Defined in this way, % of all HAs (4446 galaxy associations) are compact associations of 4 or more galaxies in three dimensions.
The boundary between compact associations and looser arrangements of galaxies at kpc is somewhat subjective and could reasonably be set at a slightly higher value to increase the fraction of associations we deem compact. We note, however, that increasing the boundary by 50 % to kpc only increases the number of HAs identified as CAs by 4% to 33%. This is probably as large as the cut could reasonably be set given the shape of the distribution of linking lengths in Figures 1 and 2, and it does not significantly change the proportion of HAs we consider to be compact. The cut could be set much smaller than 200 kpc, of course, and this would reduce the number of systems which we consider as CAs quite dramatically.
3.2 Interloping groups and interlopers within groups

Figure 2 shows that % of HAs do not have small enough values of to be considered as CAs based on our definition of compactness. This fraction is quite large, and would suggest that the Hickson criteria do not efficiently identify compact arrangements of galaxies. However, while some of the HAs with large will be completely spurious line-of-sight alignments of galaxies (‘interloping groups’), another possibility is that some of the galaxies within the HA form a compact arrangement, and the large value is the result of a minority of physically unassociated galaxies which happen to lie along the same line of sight at a very different distance (‘interloping galaxy/galaxies’). There are famous examples of this; for example, four out of the five galaxies which form Stephan’s Quintet are at the same redshift, whereas one is not.
To gauge how this affects our results, we calculate how many of the HAs with kpc can be decomposed into a CA ( kpc) of 4 or more members and one or more interlopers. The results are shown as a percentage of the total number of HAs in Figure 3. The first bin is for all CAs with 4 or more galaxies and no interlopers, and corresponds to the discussed in Section 3.1. The remaining bins show the fraction of HAs which can be decomposed into a CA with 4 or more genuine members plus one or more interlopers (cross-hatched histograms). In total, the percentage of HAs identified as CAs increases by . Of these , virtually none have more than 2 interloping galaxies. Thus just over one-third () of identified HAs are compact arrangements of 4 or more galaxies in three dimensions, allowing for the presence of interlopers.
HAs are defined to have at least four members. However, given that interlopers are inevitably present in any observation sample of galaxy groups or clusters, we relax the requirement that 4 member galaxies are required to define a CA. Instead, we require a minimum of only 3 members, still with kpc (hatched histograms in Figure 3). By doing this, we find an additional of HAs can be decomposed into a CA plus interlopers. This means that of identified HAs consist (at least in part) of a compact arrangement of galaxies.
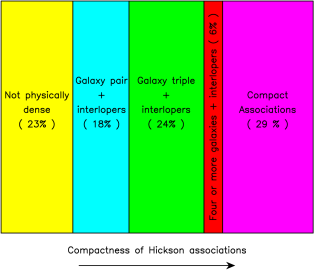
Finally, we determine that an additional 18 % of HAs consist of a pair of galaxies separated by less than 200 kpc with at least 2 interlopers (blank histograms in Figure 3). The number of completely ‘spurious’ associations identified by the Hickson criteria (that is, those where none of the galaxies are closer than 200 kpc to any other) is therefore less than one in four; 77 % of HAs consist of 2 or more galaxies which are physically associated on scales we consider ‘compact’.
It is important to emphasise that most of the compact arrangements of galaxies with one or more interlopers would otherwise fail to meet the criteria which define a HA were it not for the interlopers; they would either not have enough members or have too low a projected surface brightness to qualify.
Figure 4 summarises the results of this section. The finding that most () HAs are physically close associations of galaxies is clearly significant, as is the result that most of these physically close groupings usually consist of one or more interlopers. Of the 64 525 galaxies which make up all the identified HAs, 25 497 galaxies ( %) are not physically close ( kpc) to other galaxies. The effect of contamination from interlopers is clearly significant, and we will discuss this in more detail in Section 6.
4 Optimal selection criteria
| % CAs | % HAs | % CAs | % HAs | |||
|---|---|---|---|---|---|---|
| 4 | 100 | 29 | 3.0 | 100 | 29 | |
| 5 | 19 | 27 | 2.5 | 79 | 30 | |
| 6 | 4 | 22 | 2.0 | 57 | 29 | |
| 7 | 1 | 17 | 1.5 | 31 | 27 | |
| % CAs | % HAs | % CAs | % HAs | |||
| 3 | 100 | 29 | 26 | 100 | 29 | |
| 4 | 51 | 34 | 25 | 72 | 43 | |
| 5 | 29 | 37 | 24 | 39 | 56 | |
| 6 | 19 | 41 | 23 | 16 | 67 |
Given the significant number of interloping galaxies identified, we now examine whether it is possible to alter the Hickson criteria to reduce the ‘contamination’ levels, so that fewer interloping groups and interloping galaxies are identified. The associations we are interested in are the physically compact associations (CAs) of 4 or more galaxies with no interlopers. This is a much more homogeneous population than the overall sample of HAs, and are most analogous to the systems that the Hickson criteria were designed to identify. While pairs and triplets of galaxies are interesting environments in their own right, they are clearly not what the Hickson criteria were attempting to identify, insofar as they do not have enough members to satisfy Hickson’s definition of a group. We therefore treat all galaxies which do not belong to a CA as our ’contamination’.
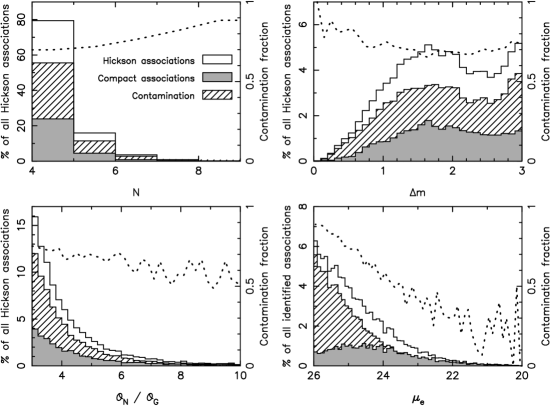
We want to stay as true to the original definition of (H)CGs as possible. Therefore, we look to fine-tune the selection criteria of Hickson (1982) to reduce contamination rather than create a completely new set of criteria. The selection criteria of Hickson detailed in Section 3.1 have 4 observable parameters whose values can be varied; these are (number of member galaxies), (band magnitude range of members), (effective surface brightness of group), and (degree of isolation in projection). The distribution of each of these four observables for all HAs, CAs and contamination identified in our mock catalogue are shown in Figure 5 as blank, shaded and hatched histograms, respectively.
Figure 5 shows the observed properties of the CAs compared to the contaminants, and as such allows us to explore how variations in the cuts for the observed parameters increase or decrease the contamination rate. The dotted line in each panel shows how the contamination level, expressed as a fraction of the number of HAs, changes as a function of each parameter (right vertical axis). Table 1 shows the net effect of varying each of the four parameters in turn, with the other three parameters set to their canonical values given in Section 3.1. For each parameter, the first column gives the value it is set to, the second column gives the number of CAs retrieved (shown as a percentage of the number of CAs obtained on using the standard values for all the parameters, 4446) and the third column gives the number of CAs retrieved as a percentage of the number of HAs retrieved.
Table 1 shows that the only observable parameter whose value does not appear to significantly change the contamination level is . Making smaller by a couple of magnitudes has no significant change on the contamination level of the sample retrieved. However, as the dotted line in the upper-right panel of Figure 5 makes clear, the contamination rate at large ( magnitudes) and small ( magnitudes) is slightly higher than at intermediate values. Most of the galaxy associations are identified at intermediate values, however, and so the overall contamination levels for the cuts listed in Table 1 do not change significantly.
More interestingly, Figure 5 and Table 1 reveal that the level of contamination of more populated groups is higher than less populated groups. This is unsurprising, given that it is more likely that a HA with many members has an interloper as a member than does a HA with fewer members. However, in terms of reducing contamination, it is not worth changing the requirements on how many galaxies define a group: although contamination is higher for more populated groups, there are very few groups which have more than 4 or 5 members in the first place.
The requirement that CAs should appear isolated can be used to reduce the level of contamination. As Table 1 and Figure 6 make clear, CAs preferentially appear more isolated on the sky than the contaminants and selecting groups which are increasingly distant from their nearest neighbour reduces the contamination rate. The fraction of CAs present in a sample of HAs can increase from 29% using the standard criteria to 41% if we require . A price is paid, however, since the sample size becomes less than one-fifth of its original size.
By far the most striking feature of Figure 5 and Table 1 is the distribution of in the lower right panel for the CAs compared to the contaminants. The number of contaminants with a given surface brightness increases steeply towards the faint end. In contrast, however, the number of CAs with lower and lower surface brightness levels off and starts to decline past a surface brightness of mags arcsec-2. This is to be expected: CAs need to have at least 4 galaxies in a relatively compact configuration in order to be identified. Therefore, the effective surface brightness of a CA (which is to first order distance independent) cannot be arbitrarily faint since the galaxies must all reside within a finite volume. There is no such physical restriction on the contaminants. The distribution of for CAs will therefore peak in some broad range, while that for the contamination will not.
Given the different shapes of the distribution of for CAs and the contaminants, adopting different cuts in has a dramatic effect on the contamination level of HAs, as the dotted line in the lower right panel of Figure 5 and Table 1 demonstrates. By requiring HAs to have a minimum effective surface brightness of 25 mags arcsec-2 instead of 26 mags arcsec-2, we increase the fraction of CAs identified to 43% from 29%. The number of CAs identified is then 72 % of the original number. Requiring a minimum surface brightness of 24 mags arcsec-2 means that over half of the identified HAs are CAs. At mags arcsec-2, the proportion is 67%. While not listed in Table 1, this trend continues to mags arcsec-2, where the proportion of CAs is 75%. By this point, however, far fewer CAs are identified. Clearly, searches for CAs which have higher surface brightness cuts have significantly reduced contamination levels.
5 Halo occupation and dynamics
Despite being identified using only projected information, the Hickson criteria do a remarkable job at retrieving dense groupings of galaxies. With only moderate refinement of the selection criteria we have shown that we can improve on these criteria further to minimise interlopers. We now ask how the observed dynamical properties of the member galaxies relate to the properties of the underlying dark matter.
5.1 Haloes versus galaxies

Figure 6 shows the number of separate haloes associated with each CA previously identified in Section 3. To simplify the analysis, we use only CAs with 4 members. Over half of the CAs consist of only one halo, with all four galaxies resident within that same halo. Of the rest, only a handful contain four individual haloes (one per galaxy). There is clearly not a one-to-one correspondence between haloes and galaxies in CAs, and most galaxies in CAs are found within the same halo. This is a strong affirmation of the physical association of galaxies in a CA environment, and highlights their obvious inter-dependence and co-evolutionary status.
The De Lucia & Blaizot (2007) catalogue records whether a galaxy is at the center of its halo or if it is a satellite. In 99 % of the cases where all member galaxies are within the same dark matter halo, one galaxy is recorded as being at the center of that halo. In the remaining 1% of cases, all four galaxies are listed as satellites.
5.2 Halo occupation/environment of compact groups

For those CAs with four members all embedded in the same dark matter halo, we now ask if these are the only four galaxies in the halo, or if there are others embedded in the same halo but which do not form part of the CA. This probes the environment of CAs; if CAs are embedded in larger structures, such as groups or clusters, then we expect many other galaxies to be resident in the same haloes.
Figure 7 shows the halo occupation distribution for those haloes we know to contain a CA of four galaxies. Only those galaxies within three magnitudes of the brightest galaxy in the CA are considered, to keep in line with the original Hickson criteria. The large majority of these haloes only contain the four galaxies of the CA, with the remainder containing, at most, a handful of extra galaxies. Therefore, most CAs dominate the haloes in which they are found, although some are associated with larger groups of typically galaxies in total. We have not probed the environment of the halo, but such an analysis is beyond the scope of this paper. We note, however, that it is unlikely that many CAs are associated with galaxy clusters, since in this scenario we would expect many other galaxies to share the same halo as the CA.
5.3 Halo mass and group dynamics
The galaxies in CAs which occupy only one halo might be viable tracers of the masses of these haloes. Indeed, the velocity dispersion of compact groups is usually used to imply a mass for the group, but small number statistics and the necessary assumption of virial equilibrium means that it is not clear that this method will work for these systems.
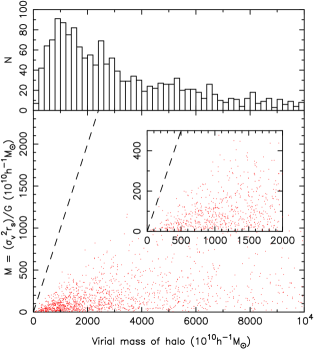
The top panel of Figure 8 shows the halo virial mass distribution for all those CAs with 4 member galaxies which all reside in the same halo. The typical halo mass is M⊙ - normal for a galaxy group - although there are a considerable number more massive than this.
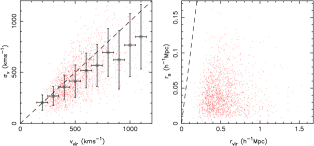
The three dimensional velocity dispersion, , of each of these CAs is plotted as a function of the virial velocity of the host halo, , in the left panel of Figure 9. Typical velocity dispersions are of order kms-1. The dashed line shows a one-to-one correspondence between and . The squares show the median velocity dispersion in 100kms-1 bins in virial velocity. The horizontal error bars show the width of the bin, and the vertical error bars show the standard deviation of the velocity dispersions in that bin. Clearly, the velocity dispersion of the group broadly correlates with the virial velocity of the host halo. The velocity dispersion is systematically lower than the virial velocity, and the spread about the median is very significant, of order km s-1. This means that adopting the velocity dispersion as a proxy for the dark matter halo virial velocity for any individual system is going to introduce a significant source of uncertainty.
To calculate the mass of the halo via the virial theorem requires a representative scale radius for the galaxy group. Following Binney & Tremaine (1987), we use
| (1) |
which is a measure of the typical intergalactic separation in the group. The second panel of Figure 9 shows as a function of the virial radius of the halo, . The dashed line represents a one-to-one correspondence between these quantities. The scale radius of the CA is much smaller than the virial radius of the dark matter halo, showing that the CA is deeply embedded in the central regions of the host halo (in Section 5.1 we showed that one galaxy in the CA is usually at the center of the halo). Further, the degree to which the CA is embedded is independent of , as demonstrated by the lack of a correlation between and .
Using the observed and for the CAs, we can calculate the mass that would be derived for the host halo upon simple application of the virial theorem. The lower panel of Figure 8 shows this mass in comparison to the true (virial) mass of the dark matter halo. The dashed line shows a one-to-one correspondence. The inset panel shows the same distribution on smaller scales. Clearly, the estimated mass is a gross underestimate of the virial mass of the halo, but this is to be expected; the galaxies are very embedded in the dark matter halo and sample a smaller mass corresponding to the innermost regions of the halo. Of greater interest is the fact that the estimated mass and the virial mass are uncorrelated. Given that and are uncorrelated, this is unsurprising, but it means that simple mass estimates for these galaxy groups do not trace, let alone estimate, the true mass of the dark matter halo. We emphasise that the cause of this discrepancy is due to the fact that, while the velocity dispersion of the group traces the virial velocity of the group’s dark matter halo, the scale radius of the group is uncorrelated with the properties of the dark matter halo.
6 Discussion
In this paper we have explored the three dimensional spatial properties of Hickson compact groups of galaxies identified in a mock galaxy catalogue from Blaizot et al. (2005). We now discuss our main results in the context of previous observational studies.
6.1 How compact are compact groups?
The compactness of compact groups has been an issue of some considerable debate. There have been many previous interpretations as to what compact groups are, summarised in the Annual Review by Hickson (1997). Of particular relevance, Mamon (1986) argued that roughly half of all HCGs were chance alignments of galaxies within looser groups, a view echoed by Walke & Mamon (1989) and Mamon (1995).
We find that approximately 30 % of HAs in our mock catalogue are physically dense systems of four or more galaxies with no interlopers. Nearly one-quarter of HAs are not physically dense, even in part. This latter fraction is significantly less than suggested by Mamon (1986), but it is still a considerable fraction. The remaining HAs (48 %) are dense configurations of 2, 3 or 4 galaxies with one or more interlopers. Thus the majority (over three-quarters) of HAs are physically dense associations of galaxies, although most of these contain interlopers and would otherwise fail to satisfy the selection criteria for HAs were it not for the presence of these interloping members. In terms of individual galaxies, 25 497 of the 64 525 galaxies identified by the Hickson criteria (40 %) are not found in very close proximity to at least one other galaxy, and will no doubt act to bias any study of galaxy properties in compact groups (Brasseur et al. 2008).
Ponman et al. (1996) surveyed most of the HCGs with ROSAT. They calculated that the X-ray emission they detected was greater than would be expected from each galaxy in isolation, and implied that most HCGs must therefore be physical associations of galaxies, with the excess emission associated with hot inter-galactic gas in the group. They implied that of the HCGs were physical associations of galaxies, by extrapolation of the number of associations from which they measured detectable X-ray emission. We find that of HAs are dense groupings of 3 or more galaxies, and this figure rises to if pairs are included. If these systems contain some intra-group hot gas, then our finding would be in good agreement with the Ponman et al. (1996) result.
6.2 Are Hickson’s criteria optimal?
The identification of a small number of physically associated galaxies based only on projected positions and apparent magnitudes is a difficult task, and we have found that most HAs are compact groupings of galaxies. However, only of HAs consist of 4 or more galaxies in a compact configuration with no interlopers. The remaining HAs can, in some respect, be viewed as contamination of this sample.
When we compare the observable properties of CAs with the ‘contaminants’ in Figure 5 and Table 1, we find that less populated, brighter, more isolated HAs are more likely to be CAs than more populated, fainter, and/or less isolated HAs. Table 1 shows that the success rate of identifying HA can be significantly improved by changing the selection criteria. The best criterion to change in this respect is the surface brightness limit; increasing the cut from mags arcsec-2 to mags arcsec-2 increases the fraction of CAs identified from 29 % to 67 %. This fraction can be increased to three-quarters by increasing the surface brightness limit to mags arcsec-2. This is done at a cost, of course, as fewer HAs identified with the original criteria pass these more strict requirements. Based upon these experiments, we conclude that, if you want to identify a sample of compact groups with as few interlopers as possible, then you should use selection criteria which only accept the brightest, most isolated, compact groups.
Lee et al. (2004) slightly modified the Hickson criteria in their search for compact groups in the SDSS commissioning data, such that groups had to have an effective surface brightness of mags arcsec-2. This will have reduced the expected contamination level to %, significantly less than would have been obtained using the original criteria.
In a subsequent paper in this series we use the information presented here to derive a large catalogue of CAs from the SDSS photometric catalogue. Importantly, for the first time in a study of compact groups identified in photometric catalogues, we will have a strong understanding of our sample selection and can be statistically confident in the identification of compact groups with minimal contamination from interlopers.
6.3 What are the dark matter properties of compact groups?
We have selected compact groups based solely on the properties of the luminous galaxies, independent of any dark matter properties. It is therefore satisfying to see that, in making this selection, we preferentially identify galaxies which belong to the same dark matter halo. In over half the compact groups (55%), all the member galaxies are found within the same dark matter halo. A smaller number have two or three haloes (32% and 11%, respectively), and only 2 % of compact groups are made of galaxies which each have their own dark matter halo.
We interpret the above result in terms of formation time. That is, those compact groups where each galaxy has its own halo are dynamically young, and the haloes have not yet had time to merge. In contrast, those compact groups with only one halo are dynamically older, and the haloes have fully merged. However, the mock catalogs used in this study do not contain information about the evolutionary history of these galaxy groups and the dark matter haloes that they occupy. A proper treatment of the evolutionary properties of these CAs would require analysis of the full de Lucia catalogs. As a result, a more detailed treatment of this topic is beyond the scope of this current contribution.
Vennik et al. (1993), Rood & Struble (1994) and Ramella et al. (1994) showed that the majority of the HCGs seemed to be associated with loose groups and clusters, although these were not generally in the highest density environments (eg. Sulentic 1987; Palumbo et al. 1995). More recently, an association between loose groups and a subset of the HCGs was also found by Tovmassian et al. (2006). Diaferio et al. (1994) and Governato et al. (1996) have both suggested that compact groups may arise as dense configurations within looser groups. For those CAs where all the galaxies reside within the same halo, we find that they generally dominate the halo. However, in a significant proportion of cases, there are several other galaxies in the halo which are not part of the CA, implying that the CA is part of a looser group with typically 5 - 10 galaxies in total. The virial masses of these haloes are of order M⊙. Thus our results for both the halo mass and the number of galaxies within the halo strongly suggest that compact groups are associated with galaxy groups, some or all of which have formed a dense galaxy grouping. This is in good agreement with recent observational studies, and argues against compact groups being associated with galaxy clusters.
Finally, we examine whether it is possible to relate the observed dynamics of compact groups to the mass of the host halo. We find that there is a strong statistical correlation between the host halo virial velocity and the three dimensional velocity dispersion of the group. However, the significant spread in this trend - likely a result of the velocity dispersion being based on only four galaxies - means that a significant uncertainty will be introduced if the velocity dispersion is used as a proxy for the virial velocity for any individual system.
Our results indicate that compact groups are deeply embedded near the centre of their dark matter halo. Unfortunately for observers, the degree to which they are embedded is uncorrelated with the virial radius of the halo. This result suggests a picture in which the individual galaxies and their haloes merge together and the galaxies sink towards the centre of their new host halo until they are within a few hundred kiloparsecs of each other, at which point they can be identified as a compact group. Thus derived mass estimates of the halo do not correlate with the true mass of the halo; by the time the group is dense enough to be able to be identified as a compact group, the linear size of the group - and hence the fraction of the halo mass which the group samples - is independent of the properties of the surrounding dark matter halo. In practice, this result will require more precise modeling of observed compact group dynamics in order to determine their dark matter halo properties.
Acknowledgments
The Millennium Simulation databases used in this paper and the web application providing online access to them were constructed as part of the activities of the German Astrophysical Virtual Observatory. AWM acknowledges support from a Research Fellowship from the Royal Commission for the Exhibition of 1851. He also thanks Sara Ellison and Julio Navarro for additional financial assistance. We thank Jon Willis, Crystal Brasseur and Jorge Peñarrubia for useful and stimulating discussions of these results. SLE and DRP acknowledge the receipt of NSERC Discovery Grants which funded some of this research. We thank the anonymous referee for very thoughtful and useful suggestions which led to significant improvements in this paper.
References
- Allam & Tucker (2000) Allam, S. S. & Tucker, D. L. 2000, Astronomische Nachrichten, 321, 101
- Arp (1966) Arp, H. 1966, ApJS, 14, 1
- Athanassoula et al. (1997) Athanassoula, E., Makino, J., & Bosma, A. 1997, MNRAS, 286, 825
- Barnes (1989) Barnes, J. E. 1989, Nature, 338, 123
- Barton et al. (1996) Barton, E., Geller, M., Ramella, M., Marzke, R. O., & da Costa, L. N. 1996, AJ, 112, 871
- Binney & Tremaine (1987) Binney, J. & Tremaine, S. 1987, Galactic dynamics (Princeton, NJ, Princeton University Press, 1987, 747 p.)
- Blaizot et al. (2005) Blaizot, J., Wadadekar, Y., Guiderdoni, B., Colombi, S. T., Bertin, E., Bouchet, F. R., Devriendt, J. E. G., & Hatton, S. 2005, MNRAS, 360, 159
- Bower et al. (2006) Bower, R. G., Benson, A. J., Malbon, R., Helly, J. C., Frenk, C. S., Baugh, C. M., Cole, S., & Lacey, C. G. 2006, MNRAS, 370, 645
- Brasseur et al. (2008) Brasseur, C., McConnachie, A. W., Ellison, S., & Patton, D. 2008, MNRAS, submitted
- Burbidge & Burbidge (1961) Burbidge, E. M. & Burbidge, G. R. 1961, AJ, 66, 541
- Carnevali et al. (1981) Carnevali, P., Cavaliere, A., & Santangelo, P. 1981, ApJ, 249, 449
- Croton et al. (2006) Croton, D. J., Springel, V., White, S. D. M., De Lucia, G., Frenk, C. S., Gao, L., Jenkins, A., Kauffmann, G., Navarro, J. F., & Yoshida, N. 2006, MNRAS, 365, 11
- De Lucia & Blaizot (2007) De Lucia, G. & Blaizot, J. 2007, MNRAS, 375, 2
- Diaferio et al. (1994) Diaferio, A., Geller, M. J., & Ramella, M. 1994, AJ, 107, 868
- Focardi & Kelm (2002) Focardi, P. & Kelm, B. 2002, A&A, 391, 35
- Governato et al. (1991) Governato, F., Bhatia, R., & Chincarini, G. 1991, ApJ, 371, L15
- Governato et al. (1996) Governato, F., Tozzi, P., & Cavaliere, A. 1996, ApJ, 458, 18
- Heiligman & Turner (1980) Heiligman, G. M. & Turner, E. L. 1980, ApJ, 236, 745
- Hernquist et al. (1995) Hernquist, L., Katz, N., & Weinberg, D. H. 1995, ApJ, 442, 57
- Hickson (1982) Hickson, P. 1982, ApJ, 255, 382
- Hickson (1997) —. 1997, ARA&A, 35, 357
- Hickson et al. (1992) Hickson, P., Mendes de Oliveira, C., Huchra, J. P., & Palumbo, G. G. 1992, ApJ, 399, 353
- Hickson et al. (1977) Hickson, P., Richstone, D. O., & Turner, E. L. 1977, ApJ, 213, 323
- Hickson & Rood (1988) Hickson, P. & Rood, H. J. 1988, ApJ, 331, L69
- Huchra & Geller (1982) Huchra, J. P. & Geller, M. J. 1982, ApJ, 257, 423
- Iovino (2002) Iovino, A. 2002, AJ, 124, 2471
- Iovino et al. (2003) Iovino, A., de Carvalho, R. R., Gal, R. R., Odewahn, S. C., Lopes, P. A. A., Mahabal, A., & Djorgovski, S. G. 2003, AJ, 125, 1660
- Klypin et al. (2002) Klypin, A., Zhao, H., & Somerville, R. S. 2002, ApJ, 573, 597
- Lee et al. (2004) Lee, B. C., Allam, S. S., Tucker, D. L., Annis, J., Johnston, D. E., Scranton, R., Acebo, Y., Bahcall, N. A., Bartelmann, M., Böhringer, H., Ellman, N., Grebel, E. K., Infante, L., Loveday, J., McKay, T. A., Prada, F., Schneider, D. P., Stoughton, C., Szalay, A. S., Vogeley, M. S., Voges, W., & Yanny, B. 2004, AJ, 127, 1811
- Li et al. (2007) Li, C., Jing, Y. P., Kauffmann, G., Börner, G., Kang, X., & Wang, L. 2007, MNRAS, 376, 984
- Mamon (1986) Mamon, G. A. 1986, ApJ, 307, 426
- Mamon (1995) Mamon, G. A. 1995, in Astronomical Society of the Pacific Conference Series, Vol. 70, Groups of Galaxies, ed. O.-G. Richter & K. Borne, 83
- Palumbo et al. (1995) Palumbo, G. G. C., Saracco, P., Hickson, P., & Mendes de Oliveira, C. 1995, AJ, 109, 1476
- Ponman et al. (1996) Ponman, T. J., Bourner, P. D. J., Ebeling, H., & Bohringer, H. 1996, MNRAS, 283, 690
- Prandoni et al. (1994) Prandoni, I., Iovino, A., & MacGillivray, H. T. 1994, AJ, 107, 1235
- Ramella et al. (1994) Ramella, M., Diaferio, A., Geller, M. J., & Huchra, J. P. 1994, AJ, 107, 1623
- Rood & Struble (1994) Rood, H. J. & Struble, M. F. 1994, PASP, 106, 413
- Rose (1977) Rose, J. A. 1977, ApJ, 211, 311
- Seyfert (1948) Seyfert, C. K. 1948, AJ, 53, 203
- Shakhbazian (1973) Shakhbazian, R. K. 1973, Astrofizika, 9, 495
- Springel et al. (2005) Springel, V., White, S. D. M., Jenkins, A., Frenk, C. S., Yoshida, N., Gao, L., Navarro, J., Thacker, R., Croton, D., Helly, J., Peacock, J. A., Cole, S., Thomas, P., Couchman, H., Evrard, A., Colberg, J., & Pearce, F. 2005, Nature, 435, 629
- Stephan (1877) Stephan, M. 1877, MNRAS, 37, 334
- Sulentic (1987) Sulentic, J. W. 1987, ApJ, 322, 605
- Tovmassian et al. (2006) Tovmassian, H., Plionis, M., & Torres-Papaqui, J. P. 2006, A&A, 456, 839
- Vennik et al. (1993) Vennik, J., Richter, G. M., & Longo, G. 1993, Astronomische Nachrichten, 314, 393
- Vorontsov-Velyaminov (1959) Vorontsov-Velyaminov, B. A. 1959, in Atlas and catalog of interacting galaxies (1959)
- Vorontsov-Vel’Yaminov (1977) Vorontsov-Vel’Yaminov, B. A. 1977, A&AS, 28, 1
- Walke & Mamon (1989) Walke, D. G. & Mamon, G. A. 1989, A&A, 225, 291