The nature of Ho magnetism in multiferroic HoMnO3
Abstract
Using x-ray resonant magnetic scattering and x-ray magnetic circular dichroism, techniques that are element specific, we have elucidated the role of Ho3+ in multiferroic HoMnO3. In zero field, Ho3+ orders antiferromagnetically with moments aligned along the hexagonal c direction below 40 K, and undergoes a transition to another magnetic structure below 4.5 K. In applied electric fields of up to V/m, the magnetic structure of Ho3+ remains unchanged.
pacs:
75.25.+z, 75.47.Lx, 75.50.Ee, 75.80.+q, 77.80.-eMagnetoelectric multiferroic compounds, systems which exhibit both ferroelectric and magnetic effects within the same phase, have attracted considerable attention due to the potential for controlling electric polarization by an applied magnetic fieldKimura et al. (2003) or, conversely, magnetic order through an applied electric fieldLottermoser et al. (2004). Recently, such a mechanism has been proposed for hexagonal HoMnO3Lottermoser et al. (2004). Despite numerous studies, however, the exact role that the Ho3+ ions play in the magnetic response, and the details of the magnetic ordering of the Ho3+ sublattices remain unclearSugie et al. (2002); Fiebig et al. (2002a, 2000); Lonkai et al. (2002); Muñoz et al. (2001); Brown and Chatterji (2006).
Below TC = 875 K, the ferroelectric phase of HoMnO3 possesses P63cm symmetry and a polarization PC = 5.6C/cm2 along the hexagonal c axisCoeuré et al. (1996). The Mn3+ moments order antiferromagnetically within the a-b plane below the Néel temperature, TN = 76 K, and undergo reorientation transitions at approximately 40 K and 5 KFiebig et al. (2000); Vajk et al. (2005). There have been several investigations of the role of Ho3+ in the magnetic ordering of this compound, but with contradictory results. For clarity in the discussion that follows, we list the various magnetic symmetries and their features in Table 1 and refer to the associated magnetic configurations for Ho3+ by their magnetic representation.
| Ho (2a) | Ho (4b) | Magnetic intensity | ||||||
| 0 | 0 | no | yes | |||||
| no | no | |||||||
| yes | yes | |||||||
| 0 | 0 | no | no | |||||
Muñoz et al.Muñoz et al. (2001) proposed that the magnetic representation is in the temperature range 24.6 K to 1.7 K based upon neutron powder diffraction measurements. Lonkai et al.Lonkai et al. (2002) and Fiebig et al.Fiebig et al. (2002a, 2000) proposed that from 40 K to 5 K the magnetic representation is and transforms, below 5 K, to based on neutron diffraction experiments and optical second harmonic generation (SHG) experiments, respectively. Most recently, Brown et al.Brown and Chatterji (2006) claimed that the magnetic representation is from 40 K down to 2 K based on neutron diffraction on single crystals and powders. All of the above studies concluded that the Ho3+ moments order along the hexagonal c axis. In their analysis of magnetoelectric measurements, however, Sugie et al.Sugie et al. (2002) proposed that the Ho3+ moments order non-collinearly in the hexagonal a-b plane. Perhaps of strongest interest is the proposal by Lottermoser et al.Lottermoser et al. (2004) that the application of an electric field changes the antiferromagnetic order of Ho3+ to ferromagnetic order, with the representation , over the temperature range from 2 K to 76 K, based on SHG and optical Faraday rotation experiments.
To resolve the contradictions regarding the magnetic order of Ho3+ below 40 K in zero field, and to investigate the nature of the Ho3+ magnetic ordering in an applied electric field, we have performed x-ray resonant magnetic scattering (XRMS) and x-ray magnetic circular dichroism (XMCD) studies of HoMnO3 at the Ho LIII absorption edge (E = 8.071 keV). In the XRMS experiment, the scattering process involves an intermediate state which arises from either dipole (E1) allowed (2p – 5d) or quadrupole (E2) allowed (2p – 4f) electronic excitationsGibbs et al. (1988); Hannon et al. (1988). In ordered rare-earth magnetic materials, the technique is sensitive to the magnetization density through either the 4f electronic states directly (E2) or indirectly through the 4f – 5d exchange interaction (E1). Of importance here is that since this technique is element specific, we can probe the magnetic structure associated with the Ho3+ moments directly. In the closely related XMCD measurements, the signal is defined as the difference in the absorption of circularly polarized x-rays with the helicity parallel and antiparallel to the sample magnetizationLang (2000). Since XMCD measurements are also performed at the absorption edges of elements of interest they can be viewed as measurements of the net magnetization for a specific elemental constituent of a magnetic compound, for example, measuring the contribution of Ho3+ to any ferromagnetic response of the sample.
Single crystals of HoMnO3 were grown using a floating zone method and prepared with a polished surface perpendicular to the crystallographic c axis. The magnetic properties (e.g. details of the complex magnetic phase diagram) agree well with reported resultsVajk et al. (2005); Lorenz et al. (2005). The XRMS experiment was performed on the 6ID-B beamline at the Advanced Photon Source at the Ho LIII absorption edge. The sample was mounted on the cold-finger of a displex cryogenic refrigerator with the a*-c* reciprocal plane coincident with the scattering plane. With the incident beam polarized perpendicular to the scattering plane (-polarized), measurements of the magnetic scattering were performed at the E1 and E2 resonances in the rotated (-) scattering channelHill and McMorrow (1996). Pyrolytic graphite (0 0 6) was used as a polarization analyzer to suppress the charge background (unrotated) relative to the magnetic scattering signal. The XMCD measurements were performed on the 4ID-D beamline at the Advanced Photon Source by modulating the x-ray helicity at 11.3 Hz with a thin diamond phase retarder and using a lock-in amplifier to detect the related modulation in the absorption coefficient. Spectra were recorded from a 20 m thin single crystal coated with carbon as electrodes and on a powder sample spread over several layers of tape and then sandwiched between two layers of conducting aluminized mylar (total sandwich thickness of 280 m). The samples were mounted on the cold finger of a horizontal field cryomagnet.
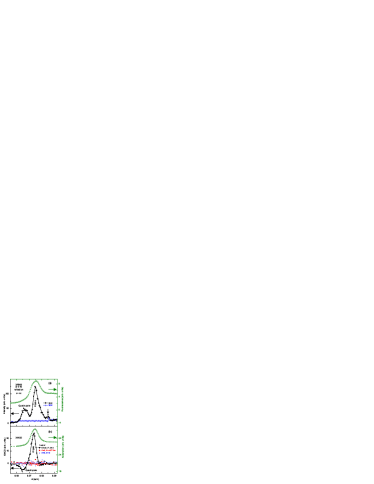
We first turn our attention to the magnetic structure of Ho3+ in the absence of an applied electric field. Fig. 1(a) shows energy scans through the Ho LIII absorption edge at the (0 0 9) reciprocal lattice point which is forbidden for charge scattering. Below 39 K, we observed two resonance peaks which correspond to the quadrupole resonance (just below the Ho LIII absorption edge) and the dipole resonance (just above the Ho LIII absorption edge). Recent XRMS work on TbMnO3Mannix et al. (2007), has shown that resonant scattering features can involve both charge and magnetic contributions in the more complex perovskite multiferroic compounds. In hexagonal HoMnO3, the predominant magnetic origin of the resonant scattering is supported by the following points. First, we note the close proximity in energy between the XRMS resonances (Fig. 1(a)) and the quadrupole and dipole features in the XMCD spectrum of the powder sample in an applied magnetic field of 0.4 Tesla (Fig. 1(b)). The magnetic origin of the XMCD features was confirmed by the observation that the spectrum flips upon reversal of the applied magnetic field. In addition, fits to the XRMS integrated intensities for (0 0 l) (l odd) diffraction peaks measured at each resonance are consistent with the expected angular and polarization dependence of the dipole and quadrupole resonant scattering cross-sections, respectivelyHill and McMorrow (1996); Nandi et al. ; Detlefs et al. (1997).
Fig. 2 shows the measured peak intensities for two characteristic magnetic reflections, (0 0 9) and (1 0 9), as a function of temperature from 1.7 K to 45 K. Also shown are the integrated intensities measured in -scans (rocking scans) at several temperatures for the (0 0 9) reflection. Due to strong local heating effects from the incident beam, significant attenuation of the undulator beam ( 98 %) was required to accurately measure the temperature dependence over the entire temperature range. Above T = 39 K, we find no signal at these magnetic peak positions. Just below 39 K there is an abrupt increase in both the dipole and quadrupole diffraction peak intensities, followed by a smooth increase with decreasing temperature down to 4.5 K. The temperature of the onset of magnetic Ho3+ ordering agrees well with the kink in magnetization data and the Mn3+ spin re-orientation transition as found by Vajk et al.Vajk et al. (2005). At 4.5 K, changes in the intensities of the (0 0 9) and (1 0 9) magnetic peaks signal a change in the magnetic ordering of Ho3+ in this low temperature phase (LTP), from the intermediate temperature phase (ITP) for 4.5 K < T < 39 K.

To determine the moment direction in the intermediate phase, we measured the intensity of the off-specular reflections, (3 0 9) and ( 0 9), at T = 12 K. While the magnetic structure factor is the same for both reflections, the angular dependence of the dipole resonant scattering cross sectionHill and McMorrow (1996) is different providing strong sensitivity to the moment direction. The experimentally observed intensity ratio is . For the Ho3+ moment oriented along the hexagonal c axis, the calculated intensity ratio I (3 0 9)/I( 0 9) = 86.3, while for moments lying in the a-b plane, I (3 0 9)/I ( 0 9) = 0.32. Thus, within experimental error, the Ho3+ moments lie along the hexagonal c axis.
As identified in previous work, the magnetic unit cell is the same as the chemical unit cellMuñoz et al. (2001). In order to determine the appropriate magnetic representationBertaut (1968) we must look into details of the six magnetic representations that are possible for the crystallographic space group P63cm, listed in Ref. 7. Only four magnetic representations (from to ) are compatible with Ho3+ magnetic moments along the hexagonal c direction and are described in Table 1. From the last columns of Table 1, we see that only the magnetic representation yields non-zero intensity for (0 0 l) reflections with l odd. While details will be presented elsewhereNandi et al. , here we note that at 6 K, the measured integrated intensities of a series of (0 0 l) reflections are consistent with calculated values for both dipole and quadrupole resonant scattering based on the magnetic representation and yields an ordered magnetic moment for the Ho (2a) site twice that of the Ho (4b) site at 6 K.
The temperature dependence of the Ho3+ XRMS signal in the ITP (as shown in Fig. 2(a)) exhibits a concave curvature quite similar to what was observed in XRMS measurements of orthorhombic multiferroic DyMnO3, and ascribed to the induced magnetic ordering of Dy3+Prokhnenko et al. (2007). For hexagonal HoMnO3, this behavior may be explained with reference to other systems with ground state quasidoublet crystal field levels, split by an exchange fieldPopova et al. (2005); Sachidanandam et al. (1997); Zheludev et al. (1996). The non-Kramers Ho3+ ions in HoMnO3 are at positions of trigonal symmetry which typically leads to singlets with very small zero-field splitting, forming such a quasidoubletRanon and Lee (1969); Hardy et al. (2006). As a first attempt, if we assume an effective two level system with a splitting , the temperature dependence in the ITP, should goes as Popova et al. (2005); Sachidanandam et al. (1997). Fits to the temperature dependence of the dipole and quadrupole resonant scattering in the ITP yields meV, consistent with the low-energy crystal electric field transition of Ho3+ of 1.5 meV observed in neutron scattering measurements below 40KVajk et al. (2005); Zhou et al. (2006). The ordering at the Ho3+ sites in the ITP may be induced by changes in the anisotropic superexchange interactions resulting from the reorientation of the Mn3+ momentsFiebig et al. (2002b).

We now turn to our investigation of the magnetic structure of the low temperature phase (LTP). From Fig. 2 we see that the intensity of (0 0 9) decreases while the intensity of (1 0 9) increases strongly below 4.5 K. Similar to our approach for the ITP, we confirmed that the moments lie primarily along the c axis by measuring the integrated intensities of the (2 0 9) and ( 0 9) reflections at 2 K. The decrease in intensity for the (0 0 9) reflection and increase in the (1 0 9) reflection signal a transition from to (see Table 1). An interesting consequence of this transition is that the Ho (2a) site can not order magnetically according to the representation . The finite intensity of the (0 0 9) reflection below 4.5 K is likely due to residual beam heating effects although we can not exclude a mixed / phase in this region.
After determining the magnetic structure in zero field, we measured the temperature dependence of both dipole and quadrupole resonances in an applied electric field. For these measurements, a thinned (130 m) sample coated with silver (as electrodes) was used. Fields of up to V/m, well above the saturation value reported by Lottermoser et al.Lottermoser et al. (2004), were obtained for an applied voltage of 1500 V. Fig. 3 shows that there is no difference between the temperature dependence of the peak intensity in zero and the maximum applied electric field. Further, the inset to the Fig. 3 shows that there are no gross structural changes in this applied field since the peak position and the full width at half maximum remain same. We conclude that there is no change of the antiferromagnetic structure of Ho3+ in an applied electric field in the ITP.
Since the XRMS measurements probe only antiferromagnetic order and are not sensitive to small ferromagnetic components of the ordered magnetic moment, we have performed XMCD measurements, at the Ho LIII edge, on single crystal and powder samples. As illustrated for the powder sample in Fig. 1 (b), the XMCD signal is unaffected by applied electric fields of up to approximately V/m for either sample, for temperatures between 8 K and 80 K. We conclude that Ho3+ is not responsible for the reported ferromagnetic response of HoMnO3 in an applied electric field.
Acknowledgements.
We are indebted to D. S. Robinson, A. Kracher, and A. Barcza for help during experiments. We thank J. Schmalian and B. N. Harmon for helpful discussions. The work at Ames Laboratory and at the MU-CAT sector was supported by the US DOE under Contract No. DE-AC02-07CH11358. Use of the Advanced Photon Source was supported by US DOE under Contract No. DE-AC02-06CH11357.References
- Kimura et al. (2003) T. Kimura et al., Nature 426, 55 (2003).
- Lottermoser et al. (2004) T. Lottermoser et al., Nature 430, 541 (2004).
- Sugie et al. (2002) H. Sugie et al., J. Phys. Soc. Jpn. 71, 1558 (2002).
- Fiebig et al. (2002a) M. Fiebig et al., J. Appl. Phys. 91, 8867 (2002a).
- Fiebig et al. (2000) M. Fiebig et al., Phys. Rev. Lett. 84, 5620 (2000).
- Lonkai et al. (2002) T. Lonkai et al., Appl. Phys. A 74, S843 (2002).
- Muñoz et al. (2001) A. Muñoz et al., Chem. Mater. 13, 1497 (2001).
- Brown and Chatterji (2006) P. J. Brown and T. Chatterji, J. Phys.: Condens. Matter 18, 10085 (2006).
- Coeuré et al. (1996) P. Coeuré et al., in Proc. Int. Meeting on Ferroelectricity V (Institute of Physics of the Czechoslovak Academy of Sciences, Prague, 1996), pp. 332–340.
- Vajk et al. (2005) O. P. Vajk et al., Phys. Rev. Lett. 94, 087601 (2005).
- Gibbs et al. (1988) D. Gibbs et al., Phys. Rev. Lett. 61, 1241 (1988).
- Hannon et al. (1988) J. P. Hannon et al., Phys. Rev. Lett. 61, 1245 (1988).
- Lang (2000) J. C. Lang, in Methods in materials research: a current protocols publication, edited by E. N. Kaufmann (J. Wiley & Sons, New York, 2000), chap. 10c2.
- Lorenz et al. (2005) B. Lorenz et al., Phys. Rev. B 71, 014438 (2005).
- Hill and McMorrow (1996) J. P. Hill and D. F. McMorrow, Acta Cryst. A 52, 236 (1996).
- Mannix et al. (2007) D. Mannix et al., Phys. Rev. B 76, 184420 (2007).
- (17) S. Nandi et al., unpublished.
- Detlefs et al. (1997) C. Detlefs et al., Phys. Rev. B 55, R680 (1997).
- Bertaut (1968) E. F. Bertaut, Acta Cryst. A 24, 217 (1968).
- Prokhnenko et al. (2007) O. Prokhnenko et al., Phys. Rev. Lett. 98, 057206 (2007).
- Popova et al. (2005) M. N. Popova et al., Phys. Rev. B 71, 024414 (2005).
- Sachidanandam et al. (1997) R. Sachidanandam et al., Phys. Rev. B 56, 260 (1997).
- Zheludev et al. (1996) A. Zheludev et al., Phys. Rev. B 54, 7216 (1996).
- Ranon and Lee (1969) U. Ranon and K. Lee, Phys. Rev. 188, 539 (1969).
- Hardy et al. (2006) V. Hardy et al., Phys. Rev. B 74, 064413 (2006).
- Zhou et al. (2006) H. D. Zhou et al., Phys. Rev. B 74, 094426 (2006).
- Fiebig et al. (2002b) M. Fiebig et al., Phys. Rev. Lett. 88, 027203 (2002b).