8000
address=JILA - University of Colorado, 440 UCB, Boulder, CO 80309-0440, USA, email=lazzati@colorado.edu,
2008
X-ray flares and their relation to the inner engine activity
Abstract
Flares overlaid on the smooth power-law decay of Swift X-ray afterglows are rather common, appearing in roughly half the observed light curves. They are a manifestation of the late time activity of the inner engine, since their temporal evolution is too fast to be linked to activity taking place in the external shock blastwave. In this paper we show that the energy emitted in the form of flares decreases with time as a power-law. We discuss several possibilities in which the flares can be powered and the source of the observed variability. We show that late time accretion from a disk can provide the necessary energy input in both classes of short duration and long duration gamma-ray bursts.
Keywords:
gamma-ray bursts:
98.70.Rz1 Introduction
Approximately half of the X-ray afterglows observed by Swift display one or more X-ray flares between few hundreds to several tens of thousand of seconds after the end of the prompt emission chinca07 ; falcone07 . Albeit with some exception, flares are observed only in the X-ray telescope data, and are therefore much harder than the afterglow emission.
An short-time increase in the X-ray afterglow flux can have various causes. These can be broadly distinguished in two classes. In the first class we put events taking place in the external shock blastwave. In the second class we put events due to late activity of the inner engine, i.e., radiation produced by electrons trailing the afterglow blastwave, released at a later stage by the inner engine. These two possibilities can be distinguished through the time behavior of the flares. In § 2 we will show that when a flare is observed at a time after the burst trigger, it means that the inner engine had an episode of emission at a time very close to . Such conclusion implies that the flares can tell us precious information on the functioning of the inner hidden engine at very long times, when its luminosity has decreased several orders of magnitude. To start addressing this issue, in § 3 we compute the amount of energy that is released by the inner engine in the form of flares as a function of the time elapsed since the prompt emission and we elaborate on possible sources for the late energy injection. In § 4 we discuss the mechanism by which the energy released from the engine is observed in episodic flares and not as a continuous output. Finally, in § 5 we summarize and discuss our results.
2 Internal or external?
Consider a spherical blastwave, for simplicity as a sphere concentrated on the external shock. Even if the whole sphere suddenly brightens and dims again in a very short time, the observer at infinity would see a flare with a long duration. This is due to the curvature of the emitting surface and to the finite speed of light. Due to special relativistic effects, the duration of the flare depends on the spectral energy distribution and on the dynamics of the blastwave expansion. Lazzati & Perna lazzperna07 computed the minimum duration of a flare as
| (1) |
where is the FWHM of the pulse, the peak time, is the spectral index (under the assumption the spectrum is well described by a power-law), and a parameter specified by the dynamics of the blastwave (either radiative or adiabatic) and the properties of the interstellar medium. For an adiabatic blastwave expanding into a uniform medium and with a power-law spectral index of (), we obtain . Figure 1 shows the distribution of the observed chinca07 compared to the limit of Eq. 1. Not a single flare has a duration that satisfies the above condition.
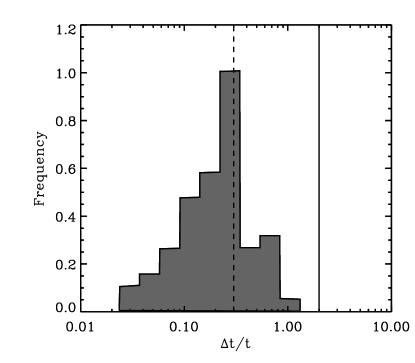
The flares must therefore be related to engine activity. A very important question remains. Are the flares observed at a late time because the engine is active at late time or are they due to slower material ejected at the end of the prompt phase with a small Lorentz factor? Lazzati & Perna lazzperna07 show that also emission produced by material ejected immediately after the prompt phase has to satisfy a constraint on the duration that reads (for a spectral index of . This constraint is shown in Fig. 1 as a dashed line. Even though some 30 per cent of the flares can be explained in this way, 70 per cent of them do require that the inner engine ejected energy at a time immediately before the flare itself is seen.
3 Energy in flares
In the previous paragraph we showed that the time at which the flare is observed coincides, in most cases, with the time at which the energy was ejected from the central engine. This conclusion allows us to construct an average light curve of flares that tells us how much energy is released from the central engine as a function of time lazz08 . To this aim, we selected a sample of 10 GRBs from falcone07 for which the redshift is known. They all have at least one flare, for a total of 24 flares. The average flare light curve is shown in Fig. 2. The result is obtained by assuming that the opening angle of the flares is constant or, at least, that there is no correlation between the jet opening angle and the time at which the engine releases the energy to produce a flare, nor a consistent evolution of the opening angle within a single GRB.

On average, the engine of GRBs releases a tail of energy extending to several hours (in comoving time) as a power-law of index lazz08 . What is the energy supply that is used to power such tail? In a black hole (BH) accretion disk system there are, at least, two possibilities. First, fall-back material from the supernova explosion can rain onto the draining disk, providing an extra supply of matter to accrete. Chevalier cheva showed that such fall-back has a power-law behavior with index . The dashed line in Fig. 2 shows a decay overlaid on the data. It provides a good fit. Alternatively, the disk itself can supply energy for a long time, as a consequence of the spreading of the disk to large radii in order to conserve angular momentum. For a thin disk, the material supply in this way accretes onto the BH as a power-law in time with index to , according to the viscosity prescription fkr . A solid line with slope is shown in Fig. 2. Such a possibility is favored by the detection of flares in short GRBs (without an associated supernova nor a progenitor star). However, not enough flares in short GRBs have been observed to meaningfully check whether or not they have the same properties of those observed in long GRBs. An alternative scenario is provided by an inner engine made by a fast spinning magnetar buccia08 . In that case, though, the spin down luminosity should be steeper than allowed by the data.
4 From steady state to flares
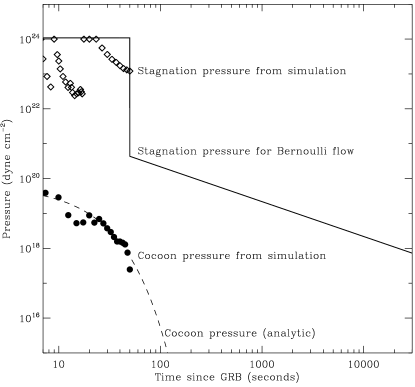
Figure 2 shows a continuous light curve. However, flares are episodic events, and we have to explain not only where the energy is taken from, but also the reason why its release is discontinuous. One possibility is that a continuous outflow is converted into a discontinuous one by the interaction with the stellar progenitor material. This would be possible if the pressure of the cocoon surrounding the jet inside the star overcomes, at any time, the stagnation pressure of the jet:
| (2) |
Figure 3 shows the comparison between the stagnation pressure of a typical GRB jet and the cocoon pressure. Lines (solid and dashed) show the result of analytic estimates based on lazzbege05 . The result is that the cocoon pressure is never strong enough to actually stagnate the jet. This analytic estimate is supported by simulation results from brian07 , shown in the figure with symbols. Even though the jet stagnation pressure can decrease due to shocking and non-adiabatic evolution, it hardly gets close to the cocoon pressure. The consequence of this is that the flaring nature of the late energy release from the inner engine must be related either to the accretion process itself perna06 or the the jet launching process, before the outflow becomes relativistic.
5 Conclusions
We have analyzed X-ray flares in long duration GRB afterglows.We reached several conclusions. First, they are due to activity of the engine at the same time they are observed. This allowed us to produce a light curve of the energy emitted by the engine at late times. We find that it falls as a power-law with index . the data are consistent with two processes to power the flares: fallback accretion and disk draining. Finally, we excluded that the flaring behavior can be due to the propagation of the relativistic outflow through the star. It has to be due either to the accretion process or to the jet launching mechanism.
References
- (1) G. Chincarini, A. Moretti, P. Romano, A. D. Falcone, D. Morris, J. Racusin, S. Campana, S. Covino, C. Guidorzi, G. Tagliaferri, D. N. Burrows, C. Pagani, M. Stroh, D. Grupe, M. Capalbi, G. Cusumano, N. Gehrels, P. Giommi, V. La Parola, V. Mangano, T. Mineo, J. A. Nousek, P. T. O’Brien, K. L. Page, M. Perri, E. Troja, R. Willingale, and B. Zhang, ApJ 671, 1903–1920 (2007).
- (2) A. D. Falcone, D. Morris, J. Racusin, G. Chincarini, A. Moretti, P. Romano, D. N. Burrows, C. Pagani, M. Stroh, D. Grupe, S. Campana, S. Covino, G. Tagliaferri, R. Willingale, and N. Gehrels, ApJ 671, 1921–1938 (2007).
- (3) D. Lazzati, and R. Perna, MNRAS 375, L46–L50 (2007).
- (4) D. Lazzati, R. Perna, and B. M. C., MNRAS submitted (2008).
- (5) R. A. Chevalier, ApJ 346, 847–859 (1989).
- (6) J. Frank, A. King, and D. J. Raine, Accretion Power in Astrophysics: Third Edition, Accretion Power in Astrophysics, by Juhan Frank and Andrew King and Derek Raine, pp. 398. ISBN 0521620538. Cambridge, UK: Cambridge University Press, February 2002., 2002.
- (7) N. Bucciantini, E. Quataert, J. Arons, B. D. Metzger, and T. A. Thompson, MNRAS 383, L25–L29 (2008).
- (8) D. Lazzati, and M. C. Begelman, ApJ 629, 903–907 (2005).
- (9) B. J. Morsony, D. Lazzati, and M. C. Begelman, ApJ 665, 569–598 (2007).
- (10) R. Perna, P. J. Armitage, and B. Zhang, ApJL 636, L29–L32 (2006).