Coherent generation of nonclassical light on a chip via photon-induced tunneling and blockade
Abstract
We report the observation of nonclassical light generated via photon blockade in a photonic crystal cavity with a strongly coupled quantum dot. By tuning the frequency of the probe laser with respect to the cavity and quantum dot resonance we can probe the system in either photon blockade or photon-induced tunneling regime. The transition from one regime to the other is confirmed by the measurement of the second order correlation that changes from anti-bunching to bunching.
Quantum dots in photonic crystals are interesting for their potential in quantum information processing98LossQDquantcomp ; 99ImamogluQDquantcomp and as a testbed for cavity quantum electrodynamics. Recent advances in controlling06ImamQDspinPrep and coherent probingNatureRef ; 2007KartikPainterNature of such systems open the possibility of realizing quantum networks originally proposed for atomic systemsCZKM1997PRL ; 2006.Kimble.Quant.Net ; 2007MonroeAtomEntanglement . We recently showedNatureRef that the intensity of a probe beam coupled to a photonic crystal cavity is controlled by the presence of a single strongly coupled quantum dot that splits the cavity resonance into two eigenstatesSCImamogluNature ; Yoshie04 . Here we analyze the photon statistics of this probe beam. We show that the capture of a single photon into the cavity affects the probability that a second photon is admitted. This probability drops when the probe is positioned at one of the two energy eigenstates, resulting in photon antibunching. This result is analogous to the recent report on photon blockade of a neutral atom strongly coupled to a Fabry-Perot cavityKimbleBlockade ; 97ImamogluBlockade . In addition, we show that when the probe is positioned in between the energy eigenstates the probability of admitting subsequent photons increases, resulting in photon bunching. We call this process photon-induced tunneling. This system represents an ultimate limit for solid-state nonlinear optics at the single photon level. Along with demonstrating the generation of nonclassical photon states, we propose an implementation of a single photon transistorLukinSPhTr in this system.
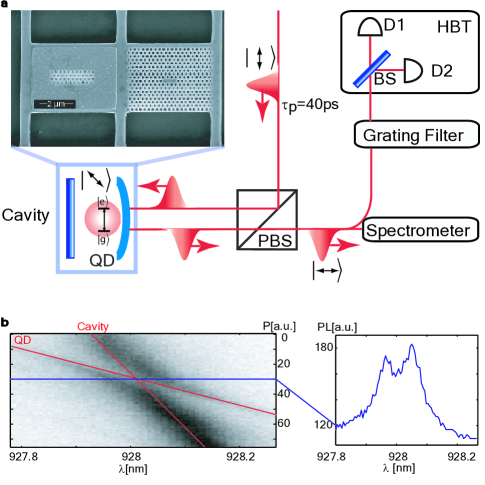
The optical system consists of a self-assembled InAs quantum dot (QD) with decay rate GHz, coupled to a three-hole defect cavityNodaL3 in a two-dimensional GaAs photonic crystal, as described in ref.NatureRef . The coupling rate GHz equals the cavity field decay rate GHz (corresponding to a cavity quality factor Q=10,000), putting the system in the strong coupling regimeYoshie04 ; SCImamogluNature . We first characterize the system in photoluminescence (PL) by pumping the structure above the GaAs bandgap. The PL scans in Fig.1(b) show the anticrossing characteristic of strong coupling between the QD and the cavity. Here, the QD is tuned into resonance using local temperature tuningAndreiTtune around an average temperature of 20 K maintained in a continuous flow cryostat. We probe the system with linearly polarized laser beams (Fig.1(a)) and observe the cross-polarized output as described in our previous workNatureRef . The measurement on the reflected port from this single-sided cavity is analogous to a transmission measurement in a Fabry Perot arrangement.
The energy eigenstates of a two-level system strongly coupled to an optical resonator are grouped into two-level manifolds denoted , with energies , where is the number of energy quanta in the system and is the bare cavity frequency (Fig.2(a)). The anharmonic energy level spacing causes phenomena such as photon blockadeKimbleBlockade or photon-induced tunneling. To observe photon blockade, a coherent probe beam (frequency ) tuned at is coupled to the cavity. This probe is resonant with the first-order manifold, but detuned from transitions to the second manifold, as shown in Fig.2(a). Consequently, once a photon is coupled into the system, it suppresses the probability of coupling a second photon with the same frequency. As a result, the output field acquires sub-poissonian statistics with second-order correlation , as recently demonstrated by Birnbaumm et alKimbleBlockade in an experiment with neutral atoms.
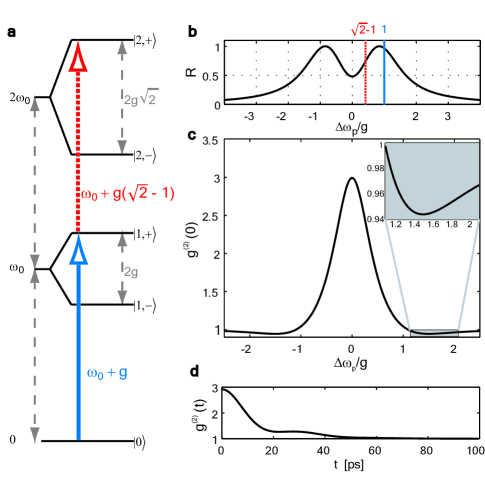
In addition to photon blockade, photon-induced tunneling is expected near the bare cavity resonance (): the absorption of a first photon enhances the absorption of subsequent photons so the output consists of “photon bunches.” In Fig.2(b) we show the output spectrum as the probe is tuned through the cavity and mark the resonance of the transitions and . The simulated driving field injects an average photon number when resonant with the polaritons in the first manifold, thus causing a slight saturation of the QD dipole. As , the probability of absorbing the first photon decreases. However, if a photon is nevertheless absorbed, it enhances the probability of capturing the second photon. This process produces a photon-bunched output. This intuitive explanation can be extended in the same way to include higher order manifolds.
The expected second-order correlation function for our system is shown in Fig.2(c), where we plot the dependence of for different detunings of the probe from the anticrossing frequency . As expected from the intuitive argument above, the simulation predicts photon bunching as . Photon blockade is evident in the antibunched region near (see inset of Fig.2(c)). However, the blockade does not occur for as previously explained, but at . The reason is that the linewidth of the eigenstates () is comparable to the splitting of the manifolds (), resulting in significant overlap of the allowed transitions between consecutive manifolds.

We measure the time-dependent autocorrelation using the Hanbury-Brown-Twiss (HBT) setup shown in Fig.1(a) and described in ref.DirkAndreiSPhtransfer ; 05PRLEnglund . The relevant features occur at the QD-cavity coupling rate , enveloped by the coherence time91Charmichael , as shown in Fig.2(d). The coherence time for our system is given by the cavity photon lifetime . Hence the time-dependent features in occur much faster than the 300 ps time-resolution of the single photon counting modules in the HBT setup. For this reason, we sample the autocorrelation function by short pulses ( ps, GHz) with a repetition rate of ns. This probe pulse duration forms a compromise between fast sampling and a spectral linewidth narrow enough to resolve the relevant spectral features. In the remainder of the paper we present the measurements of for different detunings of the probe beam, denoted as .
To observe photon blockade and photon-induced tunneling, we measured the second-order correlation at detunings and as shown Fig.3. The expected photon antibunching and bunching behavior is clearly visible at zero time delay (Fig.3(b,d)). The histograms also show bunching over timescales of hundreds of nanoseconds. This bunching results not from the quantum nature of the system, but from blinking behavior of the QD. As reported by Santori et alCharlieBlinkingPRB , such blinking behavior between a bright and a dark state results in bunching near t=0, with a characteristic fall-off rate given by the mean switching rate. Our observations indicate that the blinking rates vary for different QDs and for different probe powers, and the quantum dot spends of the time in the bright state.
Photon blockade and photon-induced tunneling are quantified by the normalized second-order correlation function . Each peak in the histogram of Fig.3 represents the unnormalized value of averaged over the pulse duration of 40 ps. We express this time averaging by using the notation . Because of the QD blinking there are two choices for the normalization constant. One choice is to normalize such that . We keep the notation for this normalized quantity (Fig.3(b)). We stress that captures both the quantum and classical nature (i.e. blinking) of the output field. The normalization constant for is determined by fitting the histogram with the function for . The quantity represents the number of counts at time , where indexes the peak number with corresponding to , and ns is the pulse repetition period. The other choice of normalization constant is , which is equivalent to normalizing to the nearest neighbor peaks at ns. When referring to this normalization we use the notation (Fig.3(b)). The time-dependence in on the time scale of 12.5 ns is due almost exclusively to the fast interaction between probe and QD and is only negligibly affected by the comparatively slow QD blinking process. Thus the nearest-neighbor normalized better captures the photon blockade () and photon-induced tunneling () effects.
In the case of photon blockade, and (Fig.3(b)), showing the antibunched quantum nature of the system for both choices of normalization. For photon-induced tunneling, and (Fig.3(d)). These values are different from the ideal theoretical prediction in Fig.2(c) because of the background noise caused by the imperfect extinction of the cross-polarized experimental setup (signal to noise ratio ), QD blinking and finite bandwidth of the probe. Both the background and the output signal when the QD is in the dark state have .
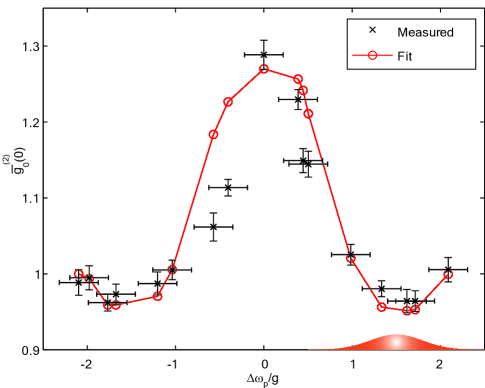
We repeated the autocorrelation measurements for a large set of detunings to map the full spectrum of . The measurement of the full autocorrelation spectrum entails several challenges such as sample drift resulting in fluctuating coupling intensity into the cavity, and fluctuating temperature. To map the dependence of on probe detuning, we took care to maintain constant coupling into the cavity mode for the full duration of the experiment. Our most consistent data set is presented in Fig.4 where we plot for different detunings of the probe frequency. We kept a constant probe power of nW before the objective lens corresponding to an average cavity photon number , and the coupling was re-optimized for every data point. The lowest value for obtained in this data set is not as antibunched as the value reported in Fig.3(b), mainly because we could not reproduce exactly the same coupling conditions. We found that the data in Fig.4 is well fitted by a numerical model that takes into account pulses of finite bandwidth, QD blinking and background from the imperfect extinction of the cross-polarized setup (see Methods section for details).
The experimental data in Fig.4 shows that this strongly coupled system allows control of the statistics of the output field from sub-poissonian to super-poissonian. Thus, the probability of transmitting a specific number of photons can be tailored by controlling . Given the above-mentioned properties, this device can be used as a single photon transistorLukinSPhTr where the presence of a gate field could control the transmission of a signal field. One scheme to implement the transistor is to tune the frequency of the gate field resonant with one of the polaritons in the first-order manifold, say . A photon injected at , increases the probability of absorbing photons that are resonant with the transition at . If the signal is tuned to this frequency, the presence of the gate field enhances the transmission of the signal field. The photonic crystal architecture allows for easy integration of such a single photon transistor with photonic crystal waveguidesAndreiWgCoupling ; Noda2DTrap so the single photon switching is done directly on the chip. The most straightforward configuration would be a photonic crystal cavity butt-coupled in between two photonic crystal waveguidesNotomiTrapDelay .
In conclusion we observed the phenomena of photon blockade and photon-induced tunneling in a solid-state strongly coupled QD/cavity system. By changing the frequency of the input beam, we synthesized nonclassical states of light with various degrees of bunching or antibunching (). These results complement the photon blockade experiments in atomic physics by showing the full dependence of on the probe frequency. They have promise in realizing single photon transistors for on-chip optical logic devices operating at the single photon level, or the implementation of two-qubit gates and generation of nonclassical states for quantum information processing, quantum lithography and quantum metrology.
Methods
Autocorrelation Measurement: We scan several cavities until we find one which contains a strongly coupled QD, as determined by the anticrossing behavior in photoluminescence between QD and cavity during temperature tuning. Then we direct the pulsed laser beam at the cavity and observe the reflected beam in cross-polarization. While tuning the local temperature with an additional heating beam, we adjust the probe beam coupling to optimize the QD-induced reflectivity drop, as described for the continuous-wave beam in ref.NatureRef . Then we stop scanning and temperature-tune the QD and cavity onto resonance. With the pulsed probe beam at different detunings with respect to the anticrossing point, we measure the autocorrelation signal by passing the reflected probe through a grating filter (to remove stray light) followed by the HBT setup. To limit sample drift, the alignment procedure is repeated for every data point in Fig. 4.
Data Analysis: The numerical model for the second-order coherence in Fig.4 is based on numerical integration of the quantum master equation. A time-dependent driving term in the Hamiltonian represents the 40-ps excitation pulses. The intensity of the drive field matches the intensity used in the experiment, representing one-third of saturation. In our experiment, this intensity was nW for the incident beam, measured before the objective lens. The state of the QD/cavity is time-evolved using a quantum Monte Carlo approach, which we based on the qotoolbox of ref.TanMATLAB . The QD can emit into free space or into the cavity mode, which in turn dissipates energy into the output channel at the loss rate . We then compute the autocorrelation on the output channel. The simulation additionally accounts for QD blinking and laser background. The full second-order coherence is calculated as weighted sum of the different contributions,
| (1) | |||||
| (2) |
where the autocorrelation function accounts for the QD bright state, for the QD-dark state (calculated using ), and for background laser signal (a coherent state). We then normalize by the simulated nearest neighbor peaks () to obtain , as shown for example in Fig.3(d).
Acknowledgements
Financial support was provided by the MURI Center for photonic quantum information systems (ARO/IARPA Program supervised by Dr. TR Govindan)), ONR Young Investigator Award( supervised by Dr. Chagaan Baatar) and NSF. D.E and I.F. were also supported by the NDSEG fellowship. Part of the work was performed at the Stanford Nanofabrication Facility of NNIN supported by the National Science Foundation.
References
- [1] Loss, D. & DiVincenzo, D. P. Physical Review A 57(1), 120–126 (1998).
- [2] Imamoglu, A. et al. Physical Review Letters 83(20), 4204–4207 November (1999).
- [3] Atature, M. et al. Science 312, 551–553 april (2006).
- [4] Englund, D. et al. Nature 450(7171) (2007).
- [5] Srinivasan, K. & Painter, O. Nature 450, 862–866 (2007).
- [6] Cirac, J. I., Zoller, P., Kimble, H. J. & Mabuchi, H. Physical Review Letters 78(16), 3221–24 April (1997).
- [7] Felinto, D. et al. Nature Physics 2, 844–848 (2006).
- [8] Moehring, D. L. et al. Nature 449, 68–72 (2007).
- [9] Hennessy, K. et al. Nature 445, 896–899 Feb (2007).
- [10] Yoshie, T. et al. Nature 432, 200–203 November (2004).
- [11] Birnbaum, K. M. et al. Nature 436, 87–90 (2005).
- [12] Imamoglu, A., Schmidt, H., Woods, G. & Deutsch, M. Physical Review Letters 79(8), 1467–1470 August (1997).
- [13] Chang, D. E., Sorensen, A. S., Demler, E. A. & Lukin, M. D. Nature Physics 3, 807–812 November (2007).
- [14] Akahane, Y., Asano, T., Song, B.-S. & Noda, S. Nature 425(6961), 944–947 October (2003).
- [15] Faraon, A. et al. Applied Physics 90(213110) (2007).
- [16] Englund, D., Faraon, A., Zhang, B., Yamamoto, Y. & Vučković, J. Optics Express 15(9) April (2007).
- [17] Englund, D. et al. Physical Review Letters 95(013904) July (2005).
- [18] Carmichael, H., Brecha, R. J. & Rice, P. R. Optics Communications 82(1,2), 73–79 April (1991).
- [19] Santori, C. et al. Physical Review B 69(205324) (2004).
- [20] Faraon, A., Waks, E., Englund, D., Fushman, I. & Vuckovic, J. Applied Physics Letters 90(073102) (2007).
- [21] Noda, S., Chutinan, A. & Imada, M. Nature 407, 608–610 oct (2000).
- [22] Tanabe, T., Notomi, M., Kuramochi, E., Shinya, A. & Taniyama, H. Nature Photonics 1, 49–52 (2006).
- [23] Tan, S. M. J. Opt. B 1, 424–432 (1999).