An X-ray and optical study of
the ultracompact X-ray binary
A 1246-58
Results are discussed of an X-ray and optical observation campaign of the low-mass X-ray binary A 1246-58 performed with instruments on Satellite per Astronomia X (’BeppoSAX’), the Rossi X-ray Timing Explorer (RXTE), the X-ray Multi-mirror Mission (’XMM-Newton’), the Swift mission, and the Very Large Telescope. Spectra and flux time histories are studied. The most important results are the lack of hydrogen spectral features in the optical spectrum, supporting the proposition that this is an ultracompact X-ray binary (UCXB), the determination of a 4.3 kpc distance from time-resolved spectroscopy of thermonuclear X-ray bursts, and the detection of intermediately long thermonuclear bursts as seen in a number of other UCXBs. There is evidence for a Ne/O abundance ratio in the line of sight that is higher than solar and variable. This may be due to different changes in the ionization degrees of Ne and O, which may be related to the variable irradiating flux. We discuss the spectral variability and the peculiarities of the long-term light curve.
Key Words.:
X-rays: binaries – X-rays: individual (A 1246-58) – accretion, accretion disks – stars: neutron1 Introduction
Ultracompact X-ray binaries (UCXBs) consist of a dwarf star that is overflowing its Roche lobe and transferring matter via an accretion disk on an accompanying neutron star (or black hole, although such a case has not been identified yet) in an orbit with a period shorter than 80 min. The period threshold implies that the donor star is hydrogen deficient (e.g., Nelson et al. 1986) because a hydrogen-rich donor would not fit in the Roche lobe. The discovery rate of (candidate) UCXBs has increased in recent years. Currently, there are 9 UCXBs with measured orbital periods, 4 with tentative period measurements, and 15 systems with other indications that they are ultracompact (e.g., Nelemans & Jonker 2006; in ’t Zand et al. 2007). The fraction of ultracompact systems in the group of Galactic low-mass X-ray binaries (LMXBs) is large: presumably of the order of 50% or more (in ’t Zand et al. 2007).
The source A 1246-58 was discovered three decades ago (Carpenter et al. 1977). Dedicated X-ray observations were sparse during the first two decades with only one (unpublished) EXOSAT observation. A serendipitous detection of an X-ray burst in 1997 (Piro et al. 1997; Boller et al. 1997) identified A 1246-58 as a LMXB, with a neutron star as accretor. In 2005 we initiated a vigorous observation campaign of this object to obtain a more complete picture of the properties of this LMXB, encompassing X-ray as well as optical observations. Preliminary results have been published in Bassa et al. (2006), who identified a optical counterpart, and in Jonker et al. (2007) who found a quasi-periodic oscillation of exceptional high frequency (1258 Hz) and the highest amplitude among LMXBs. Based on an optical to X-ray flux ratio that is relatively low for an LMXB, A 1246-58 was identified as a candidate UCXB (Bassa et al. 2006).
We discuss in this paper results from the observation campaign on A 1246-58. The data were taken with state-of-the-art instrumentation such as the European XMM-Newton X-ray observatory and the Very Large Telescope. The new data focus on X-ray bursts and on measurements of the X-ray and optical spectra. In Sect. 2, an overview is provided of all observations. Section 3 discusses the analysis results on the acquired data sets. Finally, in Sect. 4, the results are discussed in the context of UCXBs and accretion disk theory.
2 Observations and data reduction
| Facility | Instrument | Wavelength/ | Data modes | Dates | Exposure time |
|---|---|---|---|---|---|
| photon energy | (ks) | ||||
| BeppoSAX | WFC | 2-30 keV | Normal | Jul 96 - Apr 02 | 8 |
| RXTE | ASM | 2-12 keV | Normal | Jan 96 - Jul 07 | 4.5 |
| PCA | 2-60 keV | Normal | Dec 05 - Jun 07 | 104 | |
| Swift | XRT | 0.3-10 keV | WT | Aug 11, 06 | 12 |
| XMM-Newton | EPIC-PN | 0.6-12 keV | Fast Timing | Aug 31, 06 | 41 |
| EPIC-MOS | 0.3-10 keV | Timing+Ima | |||
| RGS | 0.6-1.6 keV | Normal | |||
| OM | U-band | Fast+ima. | 36 | ||
| VLT | Antu+FORS2 | 380-830 nm | Spectrosc. | Apr+May 06, Jan 07 | 10 |
The observation campaign comprises of X-ray and optical data from 9 instruments on 4 space-borne and 1 ground-based facility. Table 1 summarizes the observations.
2.1 BeppoSAX
The Satellite per Astronomia X (’BeppoSAX’) observatory (Boella et al. 1997), operational between June 1996 and April 2002, carried the Wide Field Camera (WFC) instrument package consisting of two identical X-ray cameras each with a field of view of 40°40° pointing in opposite directions, a bandpass of 2 to 30 keV and a spectral resolution of 20% full width at half maximum (FWHM) (Jager et al. 1997). Except for a dedicated observation program on the Galactic center (in ’t Zand et al. 2004), the cameras were pointed randomly at the sky. For a total of 8 Msec, A 1246-58 was serendipitously in the field of view of either camera. The sensitivity of the WFCs and the flux of A 1246-58 was such that the source was always near the detection threshold and we refrain from an analysis of the data on the persistent emission and focus on four detected X-ray bursts.
2.2 RXTE
The Rossi X-ray Timing Explorer (RXTE) carries three instruments: the All-Sky Monitor (ASM; Levine et al. 1996), the Proportional Counter Array (PCA; Jahoda et al. 2006), and the High-Energy X-ray Timing Experiment (HEXTE; Rothschild et al. 1998). The ASM observes approximately 80% of the sky each 1.5 hr orbit during one or several 90-s dwells by its three cameras. A 1246-58 is far from the ecliptic, which implies that it is covered throughout the year. The bandpass is the traditional X-ray band between 2 and 12 keV. The source is in a relatively clean part of the sky, which precludes source confusion and ensures optimum sensitivity. A 1246-58 is fairly weak for detection with the ASM. Therefore, the data of approximately one week of observations need to be combined to obtain a significant signal (see Fig. 3 upper panel).
Between Dec 16, 2005, and June 25, 2007, we carried out a monitoring campaign with the PCA and HEXTE (under observation id 90042), by performing 1 ks snapshot observations once a week. PCA and HEXTE data are the only data that cover photon energies above 10 keV. The PCA consists of 5 proportional counter units (PCUs) with co-aligned collimated fields of view of 1°1° (FWHM), a 2-60 keV bandpass and a total effective area of 8000 cm2 at 6 keV. The HEXTE consists of two clusters of four detectors with a total area of 1600 cm2 in the 10 to 250 keV band. As the PCA, it is a non-imaging device with the same field of view as the PCA. The 1 ks exposure time is insufficient for a HEXTE detection that allows for a meaningful analysis. Therefore, we refrain from doing such an analysis. In total 78 observations were carried out with a total PCA exposure of 56 ks. Jonker et al. (2007) discussed the first 55 observations.
The PCA monitoring campaign also provided triggers for longer target-of-opportunity observations (TOOs) with the same instrument (under observation id 92020) once the flux rose to a higher value. We carried out three TOO campaigns, for a total exposure of 48 ks.
2.3 Swift
The Swift mission, launched in September 2004, is an observatory with a quick slewing time (of order 100 s), which is primarily used to study gamma-ray bursts (GRBs). It carries three instruments. The Burst Alert Telescope (BAT; Barthelmy et al. 2005) has a wide field of view (2 sr) in a 15-150 keV bandpass, with full-width at half-maximum resolutions of 17′ and 7 keV, respectively. The large field of view results in many serendipitous measurements of hard X-ray sources (Krimm et al. 2006), including A 1246-58 (see Fig. 3 middle panel). The BAT detects randomly occurring GRBs in its field of view. The position of these GRBs is determined automatically on board and, depending on a figure of merit, the platform is slewed to that GRB so that it comes in the field of view of the narrow-field X-ray Telescope (XRT; Burrows et al. 2005) and UV Optical Telescope (UVOT; Roming et al. 2005). The bandpass and effective area of the BAT is such that it is also able to detect bright X-ray bursts, which typically have black body spectra with peak temperatures of k3 keV. Usually, X-ray bursts do not invoke an automatic slew, because there is a black-out list of known X-ray bursters on board to prevent such slews (X-ray bursts do not belong to the primary scientific objectives of the mission).
On Aug 11, 2006, at 02:59:55 UT, an X-ray burst was detected with BAT from A 1246-58, which delivered a trigger (trigger number 223918). The BAT light curve is presented in Fig. 1. In 15-25 keV, the burst was detectable for approximately 100 s. Since at the time A 1246-58 was not in the black-out list, this triggered an automatic slew of Swift to the 3′-accurate BAT-determined position. The XRT and the UVOT were on target after 193 s at 03:03:08 UT. The X-ray burst was still ongoing and was detected with the XRT (Romano et al. 2006; Kong 2006). No signal was detected in the UVOT. Swift remained on target for the next 8.76 hr, during 6 orbits, until 11:45:43 UT.
The XRT has a Wolter-I-type mirror system with a focal length of 3.5 m and a spatial resolution of 18″ half-power diameter at 1.5 keV. At its focal plane is a 600600-pixels CCD with the same design as the EPIC MOS on XMM-Newton (see Sect. 2.4). The field of view captured with the CCD is 23′′ and the pixel size is 236. The peak effective area is 110 cm2 at 1.5 keV. The spectral resolution varies between 50 eV at 0.1 keV to 190 eV at 10 keV (full width at half maximum FWHM).


After acquiring an image for a refined position, whose 47-radius error circle (90% confidence) contains the optical counterpart of A 1246-58 (Romano et al. 2006), XRT was set to Windowed Timing (WT) mode at 03:08:16 UT for the remainder of the observation. This implies that the CCD columns are collapsed and only the central 200 out of the 600 pixels are read out, resulting in a 1-dimensional image with a frame time of 1.7 ms. For the photon count rates encountered in our observation (50 s-1 at maximum), this implies a pile-up fraction of less than 1%, which is ignored in the analysis. We employed the 1-dimensional image for the whole observation in sky coordinates to define an extraction region with a commonly used width of 40″, centered on the source, to extract source photons and on an empty part well outside the point-spread function (PSF) of the source to extract background photons. The photon rate in the whole bandpass of the background region was found to be 0.16 s-1 and of the source region at least 10 s-1. Thus, the background contribution is negligible, although it was taken into account throughout our analysis.
Figure 2 shows a light curve of the photon rate in the source region of all WT data. The decay of the burst is clearly visible in the first orbit. The five subsequent orbits show a variable accretion photon flux between 9 and 14 s-1. The burst appears to decay to a level similar to the average flux in the last orbit (11.5 s-1).
The extraction of Swift-XRT data was done with version 2.0.1 of the XRT, as embedded in version 2.6.1 of the Swift software package. We calculated exposure maps per orbit (taking into account ’hot’ pixels) using the tool xrtexpomap and effective area arrays as a function of photon energy per orbit using the tool xrtmkarf. Spectral bins were grouped such that each resulting bin contains at least 20 photons to justify the use of the statistic as a goodness-of-fit parameter.
Swift-BAT detected a 2nd X-ray burst on October 13th, 2007 (see Fig. 3) that did not trigger XRT follow-up observations.
2.4 XMM-Newton
XMM-Newton carries 5 X-ray instruments behind 3 identical X-ray telescopes, each with a 1500 cm2 collecting area. It also carries the Optical Monitor. For two X-ray telescopes, half of the radiation goes to two European Photon Imaging Cameras (EPIC) of the Metal-Oxide Semiconductor (MOS) conductor variety (Turner et al. 2001). These are sets of 7 front-illuminated CCDs. The other half of the light from the two telescopes goes to Reflection Grating Spectrometers (RGS1 and 2; den Herder et al. 2001). The full light of the third telescope goes to an EPIC p-n-junction (’pn’) CCD, a set of 12 back-illuminated CCDs (Strüder et al. 2001). The optical monitor (OM) is a 30 cm optical/UV telescope with a resolution of 1″, a field of view of 17′, a limiting B-magnitude of 20.7 (for 1 ks integration) and a bandpass of 160 to 600 nm (Mason et al. 2001).
XMM-Newton observed A 1246-58 for 41 ks starting Aug 31, 2006, 21:02 UT. EPIC PN was set in Fast Timing mode in which only the central CCD, covering 13644, is read out every 0.03 ms with preservation of image information along one axis only (the 44 side) and full energy information. EPIC MOS1 was set in Full Frame (imaging) mode while EPIC MOS2 was set in Fast Uncompressed Timing mode, which is also full imaging mode except for the central CCD that is read out like EPIC pn in Timing Mode with a time resolution of 1.5 ms. The two EPIC MOS cameras had the filter positioned in ’thin-A’ position and EPIC PN in ’thin’. The MOS1 data suffer somewhat of out-of-time events. The source position measured from the MOS1 image is , with an uncertainty of 2″ (rms, including systematics). This is 40 from the optical counterpart proposed by Bassa et al. (2006), which is within 2 consistent. The optical monitor was operated in the ’Image + Fast Mode’ with the U-band filter in front with a bandpass between 300 and 400 nm.
All data were analyzed with SAS version 7.1.0, and the standard pipeline products were employed as a basis for extraction of science data products (light curves and spectra).
The X-ray observation was hindered by particle flaring for 17% of the time according to standard criteria (e.g. for EPIC PN: the rate of PATTERN=0 photons above PI channel 10000 was 0.35 s-1 or larger) and this portion of the observation was excluded from further analysis. For further EPIC pn Timing Mode analysis source photons were extracted between RAWX values of 30 and 46, for pixel patterns below 5 and grade 0, and for background photons between 10 and 26. The net source photon rate is s-1 and the background rate 5.3 s-1 (full bandpass). For EPIC MOS2 Timing Mode analysis, photons were extracted with RAWX from 294 to 314 and PATTERN=0. Background photons were extracted from the same CCD for RAWX from 258 to 277, which is well outside the PSF of the source. The net photon count rate is s-1. The RGS1 net photon count rate is s-1 (1st order only); for RGS2 this is s-1. The light curve shows no long-term trends during the observation and the Fourier power spectrum shows white noise above 10 Hz (with a few instrumental features; Kuster et al. 2002) and red noise below that. For details on high-frequency variability see Jonker et al. (2007).
We used standard analysis threads for the extraction of X-ray spectra from EPIC PN and EPIC MOS2 data and employed rgsproc for RGS. The spectral channels were grouped such that each group contains at least 25 photons. The bandpass for EPIC pn was restricted to between 0.6 and 12 keV, for MOS2 between 0.3 and 10 keV (following Kirch 2006) and for RGS between 0.6 and 1.6 keV. A more elaborate discussion of the RGS spectrum is presented elsewhere (Paerels et al., in prep.).
2.5 Very Large Telescope
Optical spectra of A 1246-58 were obtained with FORS2, the low dispersion spectrograph of ESO’s Very Large Telescope in Chile. On April 29, 2006, 2600 s exposures were taken with the blue 600 lines mm-1 (600B) and the red 600 lines mm-1 (600RI) grisms, providing a mean dispersion of 1.50 Å pix-1 and 1.63 Å pix-1, respectively. During the blue exposure the seeing was , but it had degraded to during the red exposure, contaminating the spectrum of the optical counterpart to A 1246-58 with that of a nearby star. Two more 2600 s exposures using the 600RI grism were obtained on May 5, 2006, but also lacked adequate seeing ( and ). On January 27, 2007 a 2600 s 600RI spectrum was obtained under seeing conditions, which fulfilled our observational constraints. The signal-to-noise of this spectrum is much better than that of the other three 600RI spectra and in the analysis below only the 2007 600RI spectrum is used. All observations used slits of and were obtained in multi-object mode, capturing spectra of both object X, the counterpart of A 1246-58, and object A, a nearby blue object (Bassa et al. 2006).
The observations were corrected for bias and the sky was subtracted using clean regions between the stars along the slitlets. The spectra were extracted using an optimal extraction method similar to that of Horne et al. (1986) and wavelength and flux calibrated using observations that were obtained as part of the VLT standard calibration plan.
3 Data analysis
3.1 X-ray variability

In Fig. 3 the monitoring results obtained with ASM, PCA and BAT are plotted. The ASM light curve (top panel) is the longest observation series, extending over 12 years. Variability is apparent on two time scales: one week and hundreds of days. The peak-to-peak amplitude is a factor of about 8. The average flux is 0.4960.005 ASM c s-1, after accounting for a bias level of 0.075 ASM c s-1 (Remillard & Levine 1997) or roughly 9.4 erg cm-2s-1 (2-10 keV). For a distance of 4.3 kpc (see Sect. 3.2) this translates to a luminosity of erg s-1.
The middle panel shows the BAT monitoring results. These data are of limited statistical quality, due to the high value of the low-energy threshold (15 keV), but they show that no unexpected high-energy behavior occurs.
The bottom panel shows the results of the PCA monitoring campaign (only obsid 90042-02) in terms of calibrated energy flux. Average spectra were extracted for each PCA observation. These were, between 3 and 20 keV, modeled with a comptonized spectrum multiplied by absorption, see Sect. 3.3. The equivalent hydrogen column density was fixed to cm-2 (see spectral analysis below), which is hardly noticeable in the 3-20 keV bandpass. Subsequently, we determined the energy flux between 2 and 10 keV. These data are of much higher quality than the ASM data and they provide a clearer picture of the variability. It is noted that no other high-frequency QPOs were found apart from the ones reported by Jonker et al. (2007).
3.2 X-ray bursts


We carried out a time-resolved spectral analysis111XSPEC version 12.3.1x (Arnaud 1996; Dorman & Arnaud 2001) was employed for X-ray spectral analyses. of the four WFC bursts by modeling the spectrum with an absorbed black body (for details about the absorption model, see Sect. 3.3) as a function of time and measuring the evolution of temperature and emission area, see Fig. 4. The persistent emission was neglected because it is less than 1% of the total emission at the burst peak.
All bursts are fairly long, with e-folding decay times between about 50 and 100 s. Also, they are Eddington limited. The effect of the Eddington limit is most clearly seen in the evolution of the size of the emission region for the first two bursts as measured through the radius of an isotropically radiating sphere. There is clear expansion of the photosphere. In particular, during the first burst the photosphere expands by two orders of magnitude in radius. In cases where a change in emission region size is not strong, an indication of near-Eddington fluxes is suggested by the prolonged rising of the temperature. This takes up to 100 s to reach the peak value for the first two WFC bursts and 20 to 30 s for the latter two. The long-duration rise of the temperature is likely due to a photosphere that is receeding to the neutron star surface after an expansion due to super-Eddington fluxes. In non-Eddington-limited bursts, rising high-energy fluxes last less than 1 s unless hydrogen is present, which in our ultracompact case is unlikely. The peak unabsorbed bolometric flux is comparable over the four WFC bursts, at erg cm-2s-1. If this is equivalent to the Eddington limit for a hydrogen-poor atmosphere (as expected for a UCXB) of erg s-1, we derive a distance of 5.8 kpc. Correcting for a gravitational redshift of at the surface of a canonical neutron star (i.e., with a mass of 1.4 M⊙ and a radius of 10 km) decreases the luminosity for a distant observer by a factor of (e.g., Lewin et al. 1993). As a result, the distance decreases by a factor of 0.75 to 4.3 kpc. Furthermore, scattering of the black body photons by electrons in the NS atmosphere, particularly when the flux is near Eddington, will alter the spectrum and at the least introduce uncertainties in the distance of order 10% (e.g., London et al. 1986).
The Swift burst was initially detected with the BAT and followed up with the XRT. One spectrum was extracted from the BAT data, during the peak between -20.0 to +9.7 s from the trigger time (see Fig. 1). Applying a higher time resolution is not useful given the low count rate. The 15-30 keV spectrum was fitted with a black body (absorption is not relevant in this bandpass) and we find k keV and a flux of erg cm-2s-1 ( for ). This translates to a bolometric flux of erg cm-2s-1, which is, within error margins, equal to the value found for the WFC bursts. The longevity of the rising keV flux (35 s) suggests super-Eddington fluxes.
The data from the sensitive XRT traces the faint end of a burst and it is necessary to take into account the persistent emission: the persistent spectrum was modeled by a combination of a power law and a black body multiplied by absorption, fixing the parameters for the absorption and power law to that found for the 6th orbit whose photon rate is closest to the aymptotic value found during orbit 1. The results for the time-resolved spectroscopy of the burst in XRT are presented in Fig. 5. The XRT data provide a rare opportunity to study a burst down to relatively low temperatures. This opportunity is facilitated by the combination of a burster with bright bursts, low persistent flux and low absorption, and an instrument that (compared to instruments that mostly observe bursts) is sensitive, has low background levels and covers sub-keV photon energies. It is possible to follow burst temperatures down to less than 0.5 keV and up to half an hour after the onset. There are no unexpected measurements for this burst, except for the long duration. The spectrum shows no narrow features for any choice of time interval, and the decay is as expected for a UCXB with a low accretion rate (e.g., in ’t Zand et al. 2007).
An interesting aspect is the occurrence of irregularities from a monotonic decay for the first two WFC bursts. This is similar to what is seen in some other long bursts from UCXBs (in ’t Zand et al. 2005, 2007) and is not explained. For certain, A 1246-58 is not a dipping source as dips should have been detectable in the persistent emission.
From the 8 Msec WFC exposure time, the average burst recurrence time is very long: d, which is consistent with a low-mass accretion rate (for details, see in ’t Zand et al. 2007). The closest observed burst pair had a 77 d recurrence time (Levine et al. 2006; Romano et al. 2006).
We tested the BAT data for the occurrence of (quasi) periodic signals, motivated by the positive detection with BAT of a 414 Hz burst oscillation in the UCXB 4U 0614+091 (Strohmayer et al. 2007), although we realize that chances for detection are small because of the six times smaller raw photon count rate during the burst peak. We selected BAT detectors that had % exposure by A 1246-58. Such a selection improves the sensitivity through a decrease of the background by a factor of 3 at a mere 35% loss of source photon rate. The time resolution is 100 s. We searched the 13-25 keV photon rate with standard Fourier techniques (e.g., Strohmayer et al. 2007) and found no oscillations. The 2-sigma upper limit for a 1 Hz wide QPO is 8% r.m.s.
On May 26, 2006, a type-I X-ray burst was detected with the ASM (Levine et al. 2006) lasting at least 340 s (there were 4 consequetive dwells on the source) and a peak flux of 1.91 Crab units averaged over the second dwell, which is equivalent to approximately erg cm-2s-1 (2-12 keV). The peak temperature of 2.8 keV (Kuulkers & Levine 2006) is consistent with the measurements of the other bursts.
3.3 X-ray spectrum of persistent emission
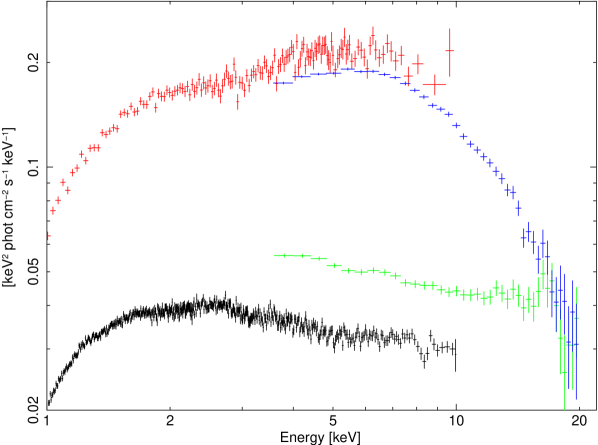
We first concentrate on a subset of four observations that trace the flux range well and have good-quality spectra. These are the XMM-Newton, the Swift-XRT and two long PCA measurements at low and high fluxes (obsids 92020-01-04-00 [exposure time 10752 s] and 92020-01-05-00 [8192 s] respectively). Figure 6 shows these spectra in calibrated flux units. It shows that only in the high-flux PCA observation curvature is detected that is not related to the low-energy absorption. Specifically, there is a high-energy cutoff. The three other spectra are fairly well represented by (absorbed) power laws, see Table 2.
Curvature may be introduced in the broad-band spectrum of the persistent emission from an X-ray burster through a generic spectral continuum model (e.g., White et al. 1988; Mitsuda et al. 1989; Sidoli et al. 2001) that is a combination of a ’disk black body’ (model diskbb in XSPEC; Mitsuda et al. 1984; Makishima et al. 1986) and comptonization of soft photons by a hot plasma (model comptt in XSPEC; Titarchuk 1994). If the upper boundary of the bandpass is limited to 10 or 20 keV, it is difficult to constrain the comptonized component since the plasma temperatures are often higher than that boundary. If the optical depth is low, the comptonized component will, within the bandpass, simplify to a power law. Disk black body temperatures are generally lower than the plasma temperatures; the interpretation favors the above model only if the spectrum is concave pointing up. If it is concave pointing down (i.e., there is a high-energy cutoff), the break is more likely due to a detection of the plasma temperature. In our case, if curvature is detected it is always in the latter sense and the evidence for the presence of a disk black body component is not significant. A model is favored with just a single continuum component consisting of a comptonized component. All spectra are indeed consistent with this model.
| Parameter | PCA low | PCA high | Swift-XRT | XMM-Newton |
| Date | 2006-08-21 | 2007-04-10 | 2006-08-11 | 2006-08-31 |
| Bandpass | 3-20 keV | 3-20 | 0.3-10 | 0.6-10 |
| 0.51 (fixed) | 0.51 (fixed) | |||
| n/a | n/a | |||
| 2.48 | ||||
| Flux‡ | 4.85 | |||
| () | 0.8851 (37) | 91.0× (37) | 1.209 (219) | 1.3451 (1891) |
∗in units of cm-2; ‡2-10 keV absorbed flux, in 10-10 erg cm-2s-1; ×The reduced is so high that we refrain from quoting errors on fitted parameters.

| Swift-XRT+PCA(high) / comptonized | |
|---|---|
| (1021 cm-2) | |
| k (keV) | |
| k (keV) | |
| (dof) | 1.034 (255) |
| Flux‡ 2-10 keV (absorbed) | |
| Flux‡ 0.3-10 keV (absorbed) | |
| Flux‡ 0.3-10 keV (unabsorbed) | 7.72 |
| Flux‡ 0.1-100 keV (unabsorbed) | 8.90 |
| Swift-XRT+PCA(high) / comptonized + disk black body | |
| (dof) | 1.035 (254) |
| XMM-Newton (RGS+EPIC-PN+MOS2) / comptonized | |
| (1021 cm-2) | |
| k | |
| k | 288 |
| (dof) | 1.3304 (4657) |
| Flux‡ 2-10 keV (absorbed) | |
| Flux‡ 0.3-10 keV (absorbed) | |
| Flux‡ 0.3-10 keV (unabsorbed) | 1.671 |
| Flux‡ 0.1-100 keV (unabsorbed) | 2.437 |
| XMM-Newton (RGS+EPIC-PN+MOS2) / power law | |
| (1021 cm-2) | |
| (dof) | 1.398 (4659) |
| Flux‡ 2-10 keV (absorbed) | |
| Flux‡ 0.3-10 keV (absorbed) | |
| Flux‡ 0.3-10 keV (unabsorbed) | 3.015 |
| Flux‡ 0.1-100 keV (unabsorbed) | 5.75 |
| PCA (low) / power law | |
| (1021 cm-2) | |
| unconstrained | |
| (dof) | 1.226 (37) |
| Flux‡ 2-10 keV (absorbed) | |
| Flux‡ 0.3-10 keV (absorbed) | |
| Flux‡ 0.3-10 keV (unabsorbed) | 2.63 |
| Flux‡ 0.1-100 keV (unabsorbed) | 4.89 |
‡in 10-10 erg cm-2s-1.
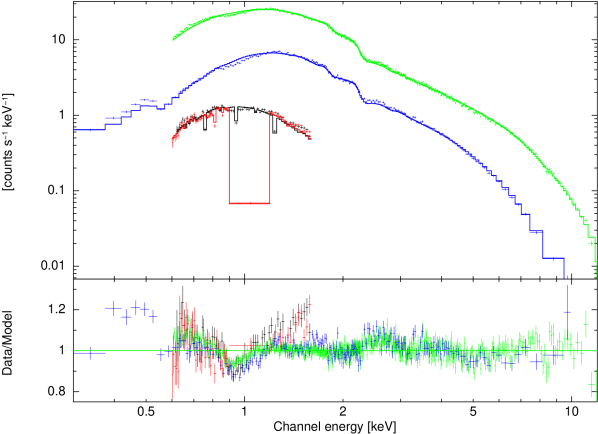
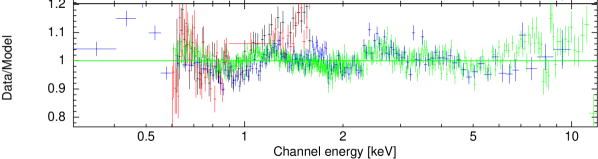
There is significant low-energy absorption in the spectrum. We modeled this by photo-electric absorption in a cold gas of solar abundances (following Lodders 2003) and with absorption cross sections according to Bałucińska-Church & McCammon (1992). The vphabs model in XSPEC is employed that allows for fitting abundances per element in the absorbing gas. While for most elements this did not result in significantly better fits, Neon is the exception. For any continuum model and for data covering sub-keV photon energies, leaving free the Neon abundance yields better fits. We specify the best-fit Neon abundance with respect to solar, , when appropriate. The relevance of Neon is visible in Fig. 7, which shows the XMM-Newton spectra fitted with a continuum model without leaving free. The fit shows large negative residuals at 1 keV that can be explained by the Neon K-shell absorption edge with a larger-than-solar abundance.
We analyzed the Swift-XRT and PCA high-flux spectra simultaneously . Since the fluxes are so similar (Table 2), as are the spectral shapes in the overlapping 3-10 keV band (Fig. 6), the spectral shape is assumed to be the same in both cases. To allow for the slightly different fluxes, a normalization factor is introduced between both data sets. The results of the fits are presented in Table 3. As a test, a disk black body is added and it is found that the fit does not improve (see Table 3).
The X-ray spectra from XMM-Newton probe the lowest fluxes, which, in a sense, is fortunate because these are the most sensitive data. However, the analysis of these spectra is cumbersome. The fit with a comptonized model is slightly better than with a power law, see Table 3, with a plasma temperature above the bandpass, but none of the models provide satisfactory fits. It is suspected that this is mainly due to calibration uncertainties rather than to incompleteness of the models. This is most clearly illustrated by the inconsistencies between the results of pairs of instruments. For instance, there are clear deviations between the RGS and CCD spectra and between both CCD spectra above 5 keV. Furthermore, the deviations between the CCD spectra and the models (see lower panels in Fig. 7) show a jump at 2.3 keV that is coincident with a jump in the effective area for both instruments. This jump is related to the telescope mirrors and we refrain from interpreting this as a true effect in the spectrum of A 1246-58. If the spectra of all instruments are individually modeled, introduction of systematic uncertainties of 5, 3, and 1% can lower to an acceptable 1 for EPIC MOS, PN and RGS, respectively. Thus, the timing-mode MOS2 spectrum seems most in need for a refined calibration. The apparent uncertainties in the calibration make us hold back from interpreting the details of the spectra. We only consider relevant the results of the general continuum model and the high-resolution features seen in the RGS spectrum.
There are no narrow spectral lines in the high-resolution RGS spectra. Typical upper limits on the equivalent width of narrow lines are 3 eV at 1 keV (with coverage by only RGS1) and 2 eV at 1.2 keV (with coverage by both RGSs). However, absorption edges are clearly detected and these high-resolution spectra provide the most accurate means for abundance determinations. The K-edges of neutral O and Ne (at 0.538 keV and 0.870 keV, respectively) and the L-edge of neutral Fe (0.7 keV) are significantly detected. To avoid complications in modeling these edges due to the various other manifestations of these elements (ionized species, atoms contained in dust particles; e.g., Kaastra et al. 2007), we determined the edge depths by zooming in on them and ignoring data at the exact energy of the edge. Thus, we only analyzed the following ranges of photon energy: 0.480-0.524 and 0.550-0.600 keV for the O K-edge; 0.600-0.690 and 0.710-0.800 keV for the Fe L-edge; and 0.700-0.850 and 0.880-1.100 keV for the Ne K-edge. The continuum model is fixed to that found from all XMM-Newton data, however, we left free the power-law normalization (see Table 3) and the abundances of the three elements in question, fitting each of the 3 edges separately. The ’Cash’ statistic (Cash 1979) was used to find the best fit. The results are: , and . The value for Ne differs 2.6 from the combined EPIC/RGS analysis. The Ne/O abundance ratio with respect to solar (as prescribed by Lodders 2003) is , 4 above solar.
We provide the results of modeling the PCA monitoring data in Fig. 8. We modeled the data with an absorbed comptonized spectrum as well as an absorbed power law. This again shows that the spectra for the higher fluxes are only well fitted with the comptonized spectrum. The power-law fits fail for 2-10 keV fluxes above erg cm-2s-1. In other words, it is above this flux threshold that the plasma temperature drops below the 20 keV boundary of the bandpass.
3.4 Optical photometry
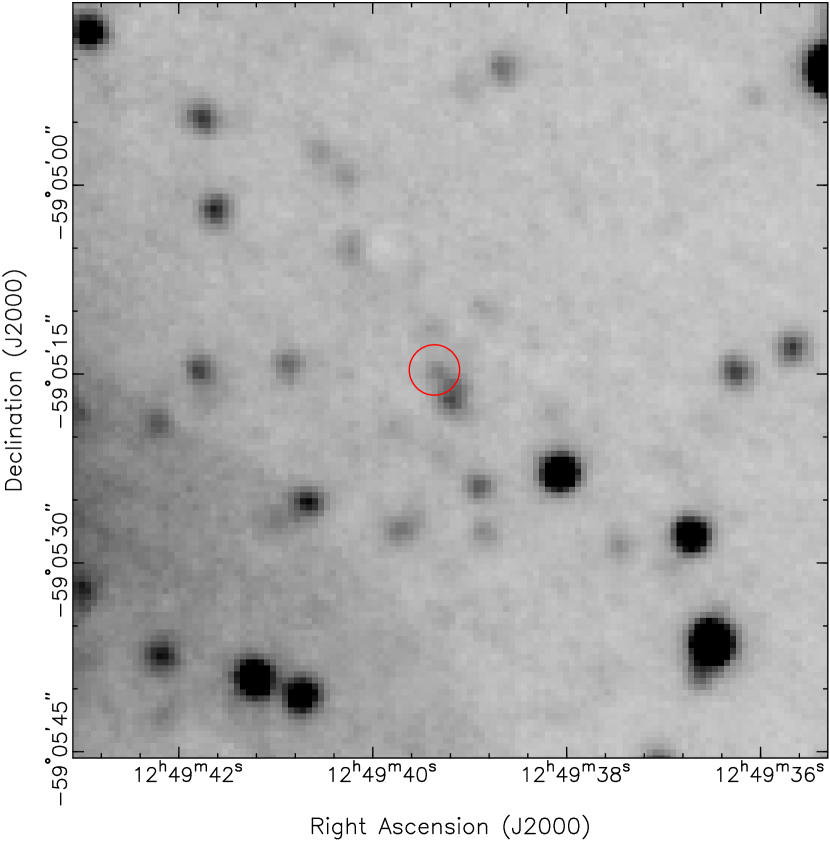
A U-band exposure taken with the XMM-Newton OM (exposure time 36 ks) is shown in Fig. 9. The optical counterpart to A 1246-58 is clearly detected. It is blended with a nearby star, which precludes an accurate assessment of the U-band brightness. A photon list was recorded for a 2223 pixels part of this image, which includes the optical counterpart, with a time resolution of 0.5 s. We extracted the photons from a region that includes the counterpart and excludes as much as possible the blended star. The selected set of 2404 photons (for an average rate of 0.067 s-1) was explored for periodicities using Fourier power and epoch-folding techniques. No periodicity was found up to 20 s, with an upper limit of about 5% in amplitude (0.05 in uncalibrated magnitude).
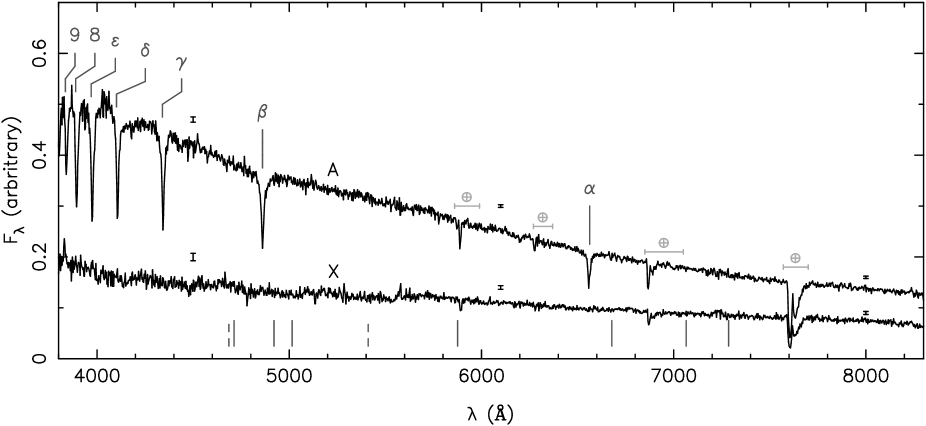
3.5 Optical spectroscopy
Figure 10 shows the combined VLT spectra of objects A and X (the two blue objects in the field found by Bassa et al. 2006). The hydrogen Balmer lines H up to H9 are seen in the spectrum of star A. Due to the strong pressure broadening it is clear that the star is a white dwarf. A comparison of its spectrum to hydrogen atmosphere models by Pierre Bergeron (2003, private communication) indicates that it is of spectral type DA7 and possibly has a surface gravity, , that is low for a white dwarf.
The spectrum of object X, the optical counterpart to A 1246-58, is featureless except for absorption features, which can be attributed to telluric absorption and are also seen in the spectrum of object A. In order to quantify the presence or absence of spectral features we follow the method employed by Nelemans et al. (2004); we determine equivalent widths (EWs) for different spectral ranges. This is done by fitting a straight line to the 25 Å regions of the continuum on either side of the spectral range in question and this model for the continuum is subtracted from the data points inside the spectral range. By computing the weighted average of these datapoints and combining it with the width of the spectral range we obtain ’area’ of the spectral feature that may be present and use it to define the EW. Using this strategy, no assumptions about the shape of the spectral feature have to be made.
| Line | Spectral range | EW | Line | Spectral range | EW | Line | Spectral range | EW | |
|---|---|---|---|---|---|---|---|---|---|
| (Å) | (Å) | (Å) | (Å) | (Å) | (Å) | (Å) | |||
| H | 4101 | 4091–4111 | C iii | 4624–4680 | O ii | 4680–4720 | |||
| H | 4340 | 4330–4350 | C ii | 5110–5165 | O ii | 4900–4960 | |||
| H | 4861 | 4851–4871 | C iii | 5230–5310 | O ii | 5160–5220 | |||
| H | 6563 | 6552–6572 | C iii | 5675–5715 | O iii | 5550–5620 | |||
| He ii | 4686 | 4676–4696 | C iii | 5785–5840 | O i? | 8180–8260 | |||
| He i | 4713 | 4703–4723 | C ii? | 6040–6120 | |||||
| He i | 4921 | 4911–4931 | C ii | 6130–6180 | |||||
| He i | 5015 | 5005–5025 | C ii | 6550–6600 | |||||
| He ii | 5411 | 5401–5421 | C iii | 6700–6760 | |||||
| He i | 5876 | 5866–5886 | C ii | 6760–6820 | |||||
| He i | 6678 | 6668–6688 | C ii | 7210–7260 | |||||
| He i | 7065 | 7055–7075 | C iii? | 7700–7750 | |||||
| He i | 7286 | 7276–7296 | a Possibly affected by telluric absorption | ||||||
In Table 4, we list detections and upper limits on the equivalent widths of several hydrogen and helium lines, which are routinely seen in optical spectra of classical X-ray binaries and cataclysmic variables. We do not detect any significant (upto ) hydrogen and helium emission or absorption lines. The He i at 5876 Å feature is detected at , though this measurement may be affected by telluric absorption. Equivalent widths were also determined for spectral ranges specified in Nelemans et al. (2004). These ranges can be attributed to features of carbon and oxygen, and several of these features are detected.
Before each spectral observation, a or -band acquisition image was obtained. These images were bias-substracted and flat-fielded and instrumental magnitudes for stars on these images were determined through point-spread-function (PSF) fitting. The instrumental magnitudes were calibrated against the observations described in Bassa et al. (2006). We find that on April 29, 2006, the optical counterpart to A 1246-58 had , which is mag fainter than during the observation in March 2000 (Bassa et al. 2006). The -band magnitudes are on May 5, 2006 and on January 1, 2007, which are again mag fainter than during the 2000 observation, in accordance with the higher X-ray flux found in 2000 than in 2007 (see Fig. 3).
4 Discussion
The optical spectroscopic data do not show features from hydrogen. We regard this as support of the UCXB proposition by Bassa et al. (2006). Time histories of X-ray or optical flux failed to find periodicities that would unambiguously confirm the ultracompact nature through a measurement of the orbital period.
The spectral analysis of the 4 good-quality X-ray spectra finds that the 0.1-100 keV unabsorbed flux varies between 2.4 and 8.9 erg cm-2s-1. The ASM data provide the best measurement of the average persistent flux. If we scale the spectral results of the low-flux XMM-Newton spectrum to this flux and assume the same comptonized spectrum, A 1246-58 on average shines at erg cm-2s-1 (0.1-100 keV; unabsorbed). If the peak bolometric flux of the X-ray bursts ( erg cm-2s-1, see Fig. 4) is equal to the Eddington limit (this statement is accurate to perhaps 10%; e.g., Galloway et al. 2006), then the average persistent flux translates to 0.26% of the Eddington limit and the maximum flux to 0.9%. These numbers have a limited accuracy due to the extrapolation to 0.1-100 keV from the 0.3 to 20 keV bandpass (accurate to roughly a factor of 2; see power-law and comptonized-spectrum results for the XMM-Newton spectra in Table 3) and the uncertainty in the inclination angle of the accretion disk. For an inclination angle of 90° the observer views the disk from the side and will measure a low, if not negligible, accretion flux. There are no signs of dips nor eclipses in the X-ray flux, implying that the inclination angle is at most 70° (Horne 1985). Thus, the correction factor to derive the accretion flux from the observed flux is at most 3 (=1/cos70°). Combining both uncertainties, the ratio between the persistent flux and the Eddington limit is accurate to within a factor of 4. This is a constraining measurement since it is significantly below the 2% threshold, a regime in which persistent sources are expected to be UCXBs. Therefore, this measurement is consistent with the UCXB nature of A 1246-58. The 2% threshold is empirically determined (of all LMXBs with measured orbital periods, only UCXBs occupy this regime in ’t Zand et al. 2007) and qualitatively explained by the smaller accretion disks in UCXB needing a smaller irradiation flux to remain in a hot high-viscosity state that sustains accretion onto the compact object (van Paradijs 1996).
The spectral changes of A 1246-58 (see Fig. 8) are similar to what is observed in other LMXBs (e.g., Gladstone et al. 2007; Done et al. 2007). One explanation is that at the lowest mass accretion rates the inner disk is truncated, leaving a hot inner flow with a hot optical thin boundary layer (Meyer & Meyer-Hofmeister 1994; Narayan & Yi 1994). As the accretion rate increases, the disk moves in and changes the hot (high k) optically thin (low ), geometrically thick inner flow to a cooler (low k), optically thick (high ), geometrically thin disk (e.g., Esin et al. 1997). The ratio at which this happens (%) is roughly consistent with observations of other LMXBs that descends that far in luminosity (Gladstone et al. 2007). If the accretion rate would have approached the Eddington limit, presumably would have become so large that the comptonized spectrum transforms into a black body spectrum. That does not happen in A 1246-58. One should note that our bandpass is limited. There may be additional spectral components above our 20 keV bandpass limit due to comptonization elsewhere in the binary (e.g., Done et al. 2007; Paizis et al. 2006) or below 0.3 keV in the form of a cool disk black body. Finally, we remark that the spectra do not seem to suggest that UCXBs behave differently from non-ultracompact LMXBs. The fact that UCXBs generally have harder spectra (e.g., in ’t Zand et al. 2007) is likely because they reside at low enough accretion rates for a longer fraction of the time. Non-ultracompact LMXBs are only in that regime when they are transient and in the final decay phase of an outburst.
We find a larger-than-solar Ne/O abundances ratio. The ratio is 62% higher than solar with a significance of 4. High Ne/O ratios have also been measured from other UCXBs employing XMM-Newton and Chandra (Juett & Chakrabarty 2003). However, it was found that the Ne/O ratio tends to change from observation to observation with accompanying changing continuum fluxes. Sometimes those changes would make the value consistent with the solar value. This was interpreted (Juett & Chakrabarty 2005) as the result of different ionization effects on Ne and O, which would nullify the use of the Ne/O ratio as a possible diagnostic for the composition of the donor atmosphere. The same appears to be the case in A 1246-58: the Swift-XRT spectrum shows a different Ne abundance, pointing to a different Ne/O ratio.
From a comparison of 0.1-100 keV BeppoSAX spectra of 10 LMXBs in globular clusters, Sidoli et al. (2001) found a spectral diagnostic to discriminate ultracompact cases against non-ultracompact ones. In a model consisting of a disk black body and a comptonized component, only in UCXBs does the inner temperature of the disk black body resemble the temperature of the seed photons of the comptonized component, and only in UCXBs are the inferred disk radii physically realistic (i.e., equal to what is expected for the radius of the inner disk edge). We are unable to find evidence for a disk black body component in A 1246-58, preventing us from verifying this diagnostic in A 1246-58.
The source A 1246-58 sofar exhibited 7 type-I X-ray bursts. Most bursts are intermediately long (i.e., tens of minutes) as would be expected for UCXB if the accretion rate is less than about 2% of Eddington (in ’t Zand et al. 2005; Cumming et al. 2006; in ’t Zand et al. 2007). The two latter WFC bursts (Fig. 4) are relatively short (a few minutes). These happen to have occurred during a period when the accretion is showing enhanced flaring behavior (Fig. 3). A similar effect is seen more clearly in 4U 0614+091 (Kuulkers et al., in prep.). The most likely explanation is that the enhanced flaring is effective in heating up the neutron star crust to such a level that flashes are ignited more quickly (within days instead of weeks), flash layers are thinner (by an order of magnitude), and as a result flash durations shorter (by the same amount). A quantitative analysis of this effect may be instrumental in determining worthwhile constraints on the crust, but the analysis requires larger numbers of bursts to enhance the statistical significance.
Quick follow-up of one burst with Swift-XRT allowed us to track the burst to relatively deep levels and show that the bursts last up to 30 min with temperatures going down substantially below 1 keV. To our knowledge, this is the first time that a burst has been tracked down to these cool regimes so accurately and we find no unexpected behavior.
The X-ray light curve is typical for an UCXB (c.f., in ’t Zand et al. 2007): a tranquil component that changes on a timescale of a year, and a flaring component with a timescale of a week. This typical behavior may be related to the probably low value (see in ’t Zand et al. 2007). A low value makes the accretion disk prone to warping and precession (giving rise to for instance the superhump phenomenon in cataclysmic variables; Whitehurst 1988; Pringle 1996). There is another interesting aspect of the PCA light curve (Fig. 3 bottom panel): the peak levels of the flares decrease at a pace (% over 1.5 yr) that is similar to the gradual decrease of the tranquil level. This suggests that the aspect angle of the accretion disk to the observer is gradually changing. In other words, a tilted accretion disk is undergoing a nodal precession with a period that is larger than the 1.5 yr time span of the observations. Nodal precession has been confirmed in a number of other X-ray binaries; famous cases are Her X-1 (Katz 1973) and SS 433 (e.g., Katz 1980). Such precession is thought to be responsible for some super-orbital periods in LMXB light curves (Priedhorsky & Holt 1987). The ASM light curve of A 1246-58 shows 2 periods of increased fluxes peaking at roughly 2000 and 2005. Perhaps 5 yr is a superorbital period. Such a period would be very long in comparison to other LMXBs (c.f. Priedhorsky & Holt 1987; Wen et al. 2006) and would imply an unlikely low donor mass (i.e., less than M⊙; Patterson 2001), but would not be unprecedented (GX 3+1 appears to have a 6-yr period, see den Hartog et al. 2003). We are unable to determine the period and verify the nodal-precession idea any further. An interesting test against it would be a measurement of the recurrence time of X-ray bursts. For instance, 4U 1820-30 has a half-year super-orbital flux modulation (Priedhorsky & Terrell 1984). This can be attributed to a modulation of the accretion rate because the X-ray bursts recurrence shows a similar modulation (Chou & Grindlay 2001; Cornelisse et al. 2003). The rate of X-ray bursts in A 1246-58 is too small to test whether the same behavior applies as in 4U 1820-30.
Acknowledgements.
We thank Jelle Kaastra and Cor de Vries for useful discussions, Frank Marshall at NASA-GSFC for investigating the Swift-UVOT data on A 1246-58, and an anonymous referee for useful suggestions that improved the manuscript. This work is based on observations obtained with XMM-Newton (an ESA science mission with instruments and contributions directly funded by ESA Member States and NASA), ESO telescopes at the Paranal Observatories, Swift/BAT transient monitor results provided by the Swift/BAT team, RXTE/ASM results provided by the ASM teams at MIT and at the RXTE SOF and GOF at NASA/GSFC, and BeppoSAX (a joint Italian and Dutch program that was operational between 1996 and 2002).References
- Arnaud (1996) Arnaud, K. A. 1996, in Astronomical Society of the Pacific Conference Series, Vol. 101, Astronomical Data Analysis Software and Systems V, ed. G. H. Jacoby & J. Barnes, 17–+
- Bałucińska-Church & McCammon (1992) Bałucińska-Church, M. & McCammon, D. 1992, ApJ, 400, 699
- Barthelmy et al. (2005) Barthelmy, S. D., Barbier, L. M., Cummings, J. R., et al. 2005, Space Science Reviews, 120, 143
- Bassa et al. (2006) Bassa, C. G., Jonker, P. G., in ’t Zand, J. J. M., & Verbunt, F. 2006, A&A, 446, L17
- Boella et al. (1997) Boella, G., Butler, R. C., Perola, G. C., et al. 1997, A&AS, 122, 299
- Boller et al. (1997) Boller, T., Haberl, F., Voges, W., Piro, L., & Heise, J. 1997, IAU Circ., 6546, 1
- Burrows et al. (2005) Burrows, D. N., Hill, J. E., Nousek, J. A., et al. 2005, Space Science Reviews, 120, 165
- Carpenter et al. (1977) Carpenter, G. F., Eyles, C. J., Skinner, G. K., Wilson, A. M., & Willmore, A. P. 1977, MNRAS, 179, 27P
- Cash (1979) Cash, W. 1979, ApJ, 228, 939
- Chou & Grindlay (2001) Chou, Y. & Grindlay, J. E. 2001, ApJ, 563, 934
- Cornelisse et al. (2003) Cornelisse, R., in’t Zand, J. J. M., Verbunt, F., et al. 2003, A&A, 405, 1033
- Cumming et al. (2006) Cumming, A., Macbeth, J., Zand, J. J. M. i., & Page, D. 2006, ApJ, 646, 429
- den Hartog et al. (2003) den Hartog, P. R., in’t Zand, J. J. M., Kuulkers, E., et al. 2003, A&A, 400, 633
- den Herder et al. (2001) den Herder, J. W., Brinkman, A. C., Kahn, S. M., et al. 2001, A&A, 365, L7
- Done et al. (2007) Done, C., Gierliński, M., & Kubota, A. 2007, A&A Rev., 3
- Dorman & Arnaud (2001) Dorman, B. & Arnaud, K. A. 2001, in Astronomical Society of the Pacific Conference Series, Vol. 238, Astronomical Data Analysis Software and Systems X, ed. F. R. Harnden, Jr., F. A. Primini, & H. E. Payne, 415–+
- Esin et al. (1997) Esin, A. A., McClintock, J. E., & Narayan, R. 1997, ApJ, 489, 865
- Galloway et al. (2006) Galloway, D. K., Muno, M. P., Hartman, J. M., et al. 2006, ArXiv Astrophysics e-prints
- Gladstone et al. (2007) Gladstone, J., Done, C., & Gierliński, M. 2007, MNRAS, 378, 13
- Horne (1985) Horne, K. 1985, MNRAS, 213, 129
- in ’t Zand et al. (2004) in ’t Zand, J., Verbunt, F., Heise, J., et al. 2004, Nuclear Physics B Proceedings Supplements, 132, 486
- in ’t Zand et al. (2005) in ’t Zand, J. J. M., Cumming, A., van der Sluys, M. V., Verbunt, F., & Pols, O. R. 2005, A&A, 441, 675
- in ’t Zand et al. (2007) in ’t Zand, J. J. M., Jonker, P. G., & Markwardt, C. B. 2007, A&A, 465, 953
- Jager et al. (1997) Jager, R., Mels, W. A., Brinkman, A. C., et al. 1997, A&AS, 125, 557
- Jahoda et al. (2006) Jahoda, K., Markwardt, C. B., Radeva, Y., et al. 2006, ApJS, 163, 401
- Jonker et al. (2007) Jonker, P. G., in ’t Zand, J. J. M., Méndez, M., & van der Klis, M. 2007, MNRAS, 378, 1187
- Juett & Chakrabarty (2003) Juett, A. M. & Chakrabarty, D. 2003, ApJ, 599, 498
- Juett & Chakrabarty (2005) Juett, A. M. & Chakrabarty, D. 2005, ApJ, 627, 926
- Kaastra et al. (2007) Kaastra, J., de Vries, C. P., Costantini, E., & Den Herder, J. W. A. 2007, A&A, submitted
- Katz (1973) Katz, J. I. 1973, Nature, 246, 87
- Katz (1980) Katz, J. I. 1980, ApJ, 236, L127
- Kong (2006) Kong, A. K. H. 2006, The Astronomer’s Telegram, 875, 1
- Krimm et al. (2006) Krimm, H. A., Barthelmy, S. D., Markwardt, C. B., et al. 2006, in Bulletin of the American Astronomical Society, Vol. 38, Bulletin of the American Astronomical Society, 374–+
- Kuster et al. (2002) Kuster, M., Kendziorra, E., Benlloch, S., et al. 2002, ArXiv Astrophysics e-prints
- Kuulkers & Levine (2006) Kuulkers, E. & Levine, A. M. 2006, The Astronomer’s Telegram, 837, 1
- Levine et al. (1996) Levine, A. M., Bradt, H., Cui, W., et al. 1996, ApJ, 469, L33+
- Levine et al. (2006) Levine, A. M., Remillard, R. A., & Galloway, D. 2006, The Astronomer’s Telegram, 830, 1
- Lewin et al. (1993) Lewin, W. H. G., van Paradijs, J., & Taam, R. E. 1993, Space Science Reviews, 62, 223
- Lodders (2003) Lodders, K. 2003, ApJ, 591, 1220
- London et al. (1986) London, R. A., Taam, R. E., & Howard, W. M. 1986, ApJ, 306, 170
- Makishima et al. (1986) Makishima, K., Maejima, Y., Mitsuda, K., et al. 1986, ApJ, 308, 635
- Mason et al. (2001) Mason, K. O., Breeveld, A., Much, R., et al. 2001, A&A, 365, L36
- Meyer & Meyer-Hofmeister (1994) Meyer, F. & Meyer-Hofmeister, E. 1994, A&A, 288, 175
- Mitsuda et al. (1984) Mitsuda, K., Inoue, H., Koyama, K., et al. 1984, PASJ, 36, 741
- Mitsuda et al. (1989) Mitsuda, K., Inoue, H., Nakamura, N., & Tanaka, Y. 1989, PASJ, 41, 97
- Narayan & Yi (1994) Narayan, R. & Yi, I. 1994, ApJ, 428, L13
- Nelemans & Jonker (2006) Nelemans, G. & Jonker, P. G. 2006, ArXiv Astrophysics e-prints
- Nelemans et al. (2004) Nelemans, G., Jonker, P. G., Marsh, T. R., & van der Klis, M. 2004, MNRAS, 348, L7
- Nelson et al. (1986) Nelson, L. A., Rappaport, S. A., & Joss, P. C. 1986, ApJ, 304, 231
- Paizis et al. (2006) Paizis, A., Farinelli, R., Titarchuk, L., et al. 2006, A&A, 459, 187
- Patterson (2001) Patterson, J. 2001, PASP, 113, 736
- Piro et al. (1997) Piro, L., Heise, J., Jager, R., et al. 1997, IAU Circ., 6538, 2
- Priedhorsky & Terrell (1984) Priedhorsky, W. & Terrell, J. 1984, ApJ, 284, L17
- Priedhorsky & Holt (1987) Priedhorsky, W. C. & Holt, S. S. 1987, Space Science Reviews, 45, 291
- Pringle (1996) Pringle, J. E. 1996, MNRAS, 281, 357
- Remillard & Levine (1997) Remillard, R. A. & Levine, A. M. 1997, in All-Sky X-Ray Observations in the Next Decade, ed. M. Matsuoka & N. Kawai, 29–+
- Romano et al. (2006) Romano, P., Barthelmy, S. D., Gehrels, N., et al. 2006, GRB Coordinates Network, 5436, 1
- Roming et al. (2005) Roming, P. W. A., Kennedy, T. E., Mason, K. O., et al. 2005, Space Science Reviews, 120, 95
- Rothschild et al. (1998) Rothschild, R. E., Blanco, P. R., Gruber, D. E., et al. 1998, ApJ, 496, 538
- Sidoli et al. (2001) Sidoli, L., Parmar, A., Oosterbroek, T., et al. 2001, A&A, 368, 451
- Strohmayer et al. (2007) Strohmayer, T., Markwardt, C., & Kuulkers, E. 2007, ArXiv e-prints, 711
- Strüder et al. (2001) Strüder, L., Briel, U., Dennerl, K., et al. 2001, A&A, 365, L18
- Titarchuk (1994) Titarchuk, L. 1994, ApJ, 434, 570
- Turner et al. (2001) Turner, M. J. L., Abbey, A., Arnaud, M., et al. 2001, A&A, 365, L27
- van Paradijs (1996) van Paradijs, J. 1996, ApJ, 464, L139+
- Wen et al. (2006) Wen, L., Levine, A. M., Corbet, R. H. D., & Bradt, H. V. 2006, ApJS, 163, 372
- White et al. (1988) White, N. E., Stella, L., & Parmar, A. N. 1988, ApJ, 324, 363
- Whitehurst (1988) Whitehurst, R. 1988, MNRAS, 232, 35