22email: folini@astro.phys.ethz.ch 33institutetext: Dipartimento di Fisica ’Enrico Fermi’, UniversitÀ di Pisa, largo Pontecorvo 3, Pisa 56127, Italy 33email: shore@df.unipi.it 44institutetext: INFN/Pisa, largo Pontecorvo 3, Pisa 56127, Italy
3D simulations of RS Oph: from accretion to nova blast††thanks: In the frame of the computing project ’Cosmic Engines in Galaxies’
Abstract
Context. RS Ophiuchi is a recurrent nova with a period of about 22 years, timescale, consisting of a wind accreting binary system with a white dwarf (WD) very close to the Chandrasekhar limit and a red giant star (RG). The system is considered a prime candidate to evolve into an SNIa. For its most recent outbursts in 1985 and 2006, exquisite multiwavelength observational data are available.
Aims. Further physical insight is needed regarding the inter-outburst accretion phase and the dynamical effects of the subsequent nova explosion in order to improve the interpretation of the observed data and to shed light on whether the system is an SNIa progenitor.
Methods. We present a three dimensional hydrodynamic simulation of the quiescent accretion and the subsequent explosive phase.
Results. The computed circumstellar mass distribution in the quiescent phase is highly structured with a mass enhancement in the orbital plane of about a factor of 2 as compared to the poleward directions. The simulated nova remnant evolves aspherically, propagating faster toward the poles. The shock velocities derived from the simulations are in agreement with those derived from observations. For km/s and for nearly isothermal flows, we derive a mass transfer rate to the WD of 10% of the mass loss of the RG. For an RG mass loss of yr-1, we found the orbit of the system to decay by 3% per million years. With the derived mass transfer rate, multi-cycle nova models provide a qualitatively correct recurrence time, amplitude, and fastness of the nova.
Conclusions. Our 3D hydrodynamic simulations provide, along with the observations and nova models, the third ingredient for a deeper understanding of the recurrent novae of the RS Oph type. In combination with recent multi-cycle nova models, our results suggests that the WD in RS Oph will increase in mass. Several speculative outcomes then seem plausible. The WD may reach the Chandrasekhar limit and explode as an SN Ia. Alternatively, the mass loss of the RG could result in a smaller Roch volume, a common envelope phase, and a narrow WD + WD system. Angular momentum loss due to graviational wave emission could trigger the merger of the two WDs and – perhaps – an SN Ia via the double degenerate scenario.
Key Words.:
stars: individual: RS Oph – stars: novae, cataclysmic variables – supernovae: general – accretion, accretion disks – Gravitational waves – methods: numerical1 Introduction
Type Ia supernovae (SNe Ia) are cornerstones of modern cosmology, as a measure for cosmological distances, and they are crucial building blocks of the universe, as production sites of a large part of iron group elements. The recurrent nova RS Ophiuchi (RS Oph) (Hachisu et al. 1999; Hachisu & Kato 2001) is a candidate for their still mysterious progenitors. It is a symbiotic-like binary star system consisting of a red giant (RG) and a white dwarf (WD) that undergoes a nova outburst about every 22 years (Anupama 2002; Fekel et al. 2000; Dobrzycka et al. 1996). For the most recent outbursts in 1985 and 2006, exquisite panchromatic observational data are available (Shore et al. 1996; Bode et al. 2006; Sokoloski et al. 2006; Das et al. 2006; O’Brien et al. 2006; Evans et al. 2006; Worters et al. 2007; Hachisu et al. 2007; Bode et al. 2007). Here we present first 3D hydrodynamical simulations of RS Oph, from pre-outburst accretion through nova explosion, with the goal of improving the physical insight into the system and the interpretation of the unique observational data.
RS Oph has an orbital period of 455 days (Fekel et al. 2000), RG and WD masses of 2.3 and close to 1.4 (Anupama 2002; Worters et al. 2007), respectively, and a separation between the components of cm. The RG mass is, however, still uncertain, much smaller values (Fekel et al. 2000) have also been suggested. We supplement the system parameters by assuming for the RG a terminal wind velocity of km/s in the rest frame of the RG and a mass loss rate of yr-1. Note that mass losses of red giants are still not well known. While Seaquist & Taylor (1990) find a massloss of order yr-1 for the majority of RG in symbiotic systems, the scatter is significant and values of less than yr-1 can be found. For the range of spectral types suggested (Worters et al. 2007) for RGs in the RS Oph system, its radius is always smaller than its Roche lobe and accretion by the WD occurs only from the RG wind.
2 3D simulations of RS Oph
2.1 Computational method
Our numerical simulation was performed using the A-MAZE-code (Walder & Folini 2000), a parallel, block structured, adaptive mesh refinement (AMR) hydrodynamical code using Cartesian meshes and a multidimensional high-resolution finite-volume integration scheme. The code has been used for accretion studies before (Zarinelli et al. 1995; Walder 1997; Dumm et al. 2000; Harper et al. 2005). The Euler equations are solved in three dimensions with a nearly isothermal polytropic equation of state with , resulting in a thermal structure that comes close to that obtained from photoionization models of related symbiotic binary systems (Nussbaumer & Vogel 1987; Nussbaumer & Walder 1993).
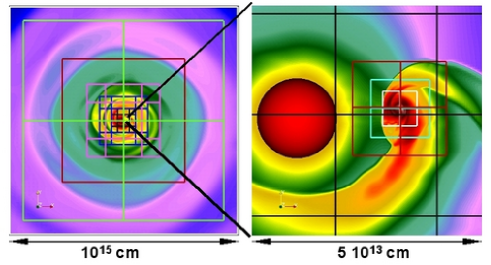
The simulation is carried out in an Eulerian frame of reference with the stars moving within the computational domain which, which measures cm a side. The computational grid consists of nine nested levels of refinement (Fig. 1). The coarsest level consists of 50 cells cubed. From one level to the next, grid cells are refined by a factor of two. Each level comprises between 8 and 64 individual grids, the entire mesh consists of 233 grids and cells. The decomposed grid structure is exploited for parallelization under OpenMP.
We impose free outflow at the outer domain boundary. The WD is represented as a spherical low pressure, low density, zero velocity region of radius cm. The accretion rates of mass, momentum, energy, and angular momentum onto the WD are derived from the flow quantities entering the region. The rates are not sensitive to the size, pressure, and density of the region representing the WD. The RG is represented as a spherical region of 150 . In the rest frame of the RG star, which rotates and orbits with respect to the computational domain, we chose a terminal velocity of the RG wind of 20 km/s. The absolute value of the density in the cells representing the RG was adjusted to achieve the desired mass loss of yr-1. The wind temperature is set to 8000 K, a value between the RG photospheric temperature and the wind temperature more close to the WD as computed by elaborate photo-ionization models (Nussbaumer & Vogel 1987).
At the beginning, the entire computational domain was filled with the RG wind. The accreting system was then relaxed over seven orbital periods, about the crossing time from the RG to the domain boundary at the RG wind speed. Mass and angular momentum losses out of the system were then computed through spherical shells around the centre of mass.
The losses became constant for shell radii larger than cm. The nova explosion was then launched into the relaxed density structure.
2.2 Quiescent phase: density spirals and wind accretion
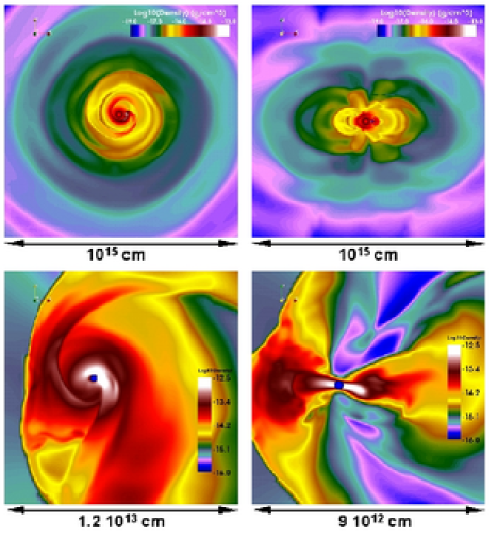
The inter-outburst accretion phase leads to a circumstellar density distribution that deviates substantially from the density distribution of a single RG wind out to several system separations. The deviations, usually neglected when interpreting RS Oph observations, arise from the orbital motion of the two components and the accretion onto the WD, and are subsequently transported outward in the flow. The resulting density structure, Fig. 2, depends critically on the ratio where , with the orbital period. For , an Archimedian spiral occurs in the orbital plane, as observed in the colliding wind Wolf Rayet binary star system WR 104 (Tuthill et al. 1999). For RS Oph, with , the spiral pattern becomes self-interacting.
In the vicinity of the WD, a high density accretion disk forms that is clearly visible in Fig. 2. Its diameter is roughly 1/10 of the system separation, and velocities are non-Keplerian. Strong spiral shock waves are responsible for the transport of angular momentum and mass, and stable accretion occurs. The disk is geometrically thick, the opening angle perpendicular to the orbital plane (Fig. 2, lower right panel) measures roughly in the direction toward the RG and away from it.
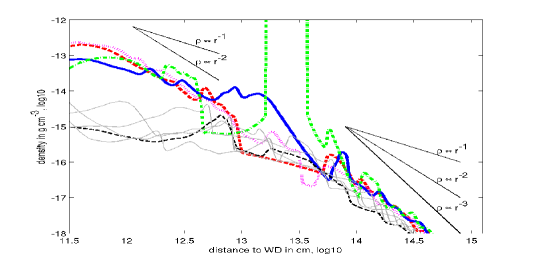
On length scales less than the system separation, radial density profiles as seen from the WD (Fig. 3) show density contrasts between the orbital plane and poleward directions of one to two orders of magnitude. Most prominent here, and reaching furthest out, is the trailing accretion wake of the WD. This density structure affects the early evolution of the nova remnant. At greater distances, densities in the orbital plane remain larger than toward the poles, but only by a factor of 2-3. This is, however, sufficient to cause an asymmetric evolution of the nova remnant. Note that although the density decreases as on average, the relative amplitude of local variations due to the self-interacting spiral pattern are up to a factor of 10, especially in the orbital plane. We expect these local variations to vanish at even larger scales that are beyond our computational domain.
The velocity of the systemic outflow is a superposition of the velocity of the RG wind, the stellar orbital and rotational velocities and hydrodynamical effects. On larger scales than cm, the flow field is essentially directed radially outward. Depending on the exact angle of an observer, any radial speed between km/s (polewards) and km/s (mostly in the orbital plane) can be found in the computational data. This range is consistent with the different values of the wind speeds derived from observations, e.g. 36 km/s by Iijima (2008) and 40-60 km/s by Shore et al. (1996).
The computed accretion rate is 10 % of the mass loss rate of the RG, independent of the absolute mass loss of the RG. To our knowledge, this is the first quantitative self-consistent prediction of the accretion rate of a symbiotic-like recurrent nova. A higher accretion rate is expected for a less massive RG (Fekel et al. 2000; Dobrzycka & Kenyon 1994), since a smaller system separation would result. The computed value is in line with the values found in 3D simulations of related symbiotic binary star systems, for example 6% in RW Hydrae (Dumm et al. 2000) and 10% - 25% in Z Andromeda (Mitsumoto et al. 2005). In absolute terms, the WD in our simulation accretes yr-1. This value also agrees well with the accretion rates required by multi-cycle nova evolution models (Yaron et al. 2005) for RS Oph like binary systems, with and a recurrence period of 22 years. Conversely, the nova models together with the above accretion rate of 10% of the RG mass loss quantitatively constrain the mass loss of the RG to values around yr-1. This is yet another, completely independent, estimate of the mass loss rate of the RG in RS Oph. It is more at the upper limit of the values given by Seaquist & Taylor (1990) for RG in classical symbiotics. A much higher estimate of yr-1 was derived by Shore et al. (1996). A more recent analysis indicates the rate could be a factor of about 10 lower (Shore 2008) and should only be taken as an upper limit. However, evolutionary models of single stars predict values greater than yr-1 for only a very short time on the RG branch (Maeder & Meynet 1988). At the moment, we are not able to resolve this spread in the estimates.
2.3 Outburst: bipolar blast due to density stratification
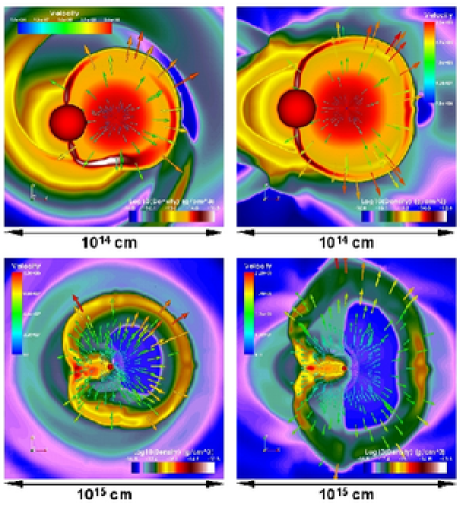
Launching the ejecta of a nova explosion into this complex circumstellar environment naturally results in a strongly asymmetric shock front, visible as a high density shell in Fig 4. The time evolution of the nova remnant is shown in a Supplementary Movie. The explosion was simulated by instant injection of an energy and mass of ergs and , respectively, at the position of the WD. The assumed explosion mass is on the lower end of published estimates for the ejected mass (Sokoloski et al. 2006; O’Brien et al. 1992), which range from to , but is comparable to the obtained from the self-consistently computed accretion phase. An isothermal equation of state with is used, because inclusion of detailed cooling as in recent 1D models (Vaytet et al. 2007) is currently beyond reach in 3D simulations.
The initial velocities of the modeled ejecta are km/s, within the range of observed values (Bode et al. 2006; Das et al. 2006; Evans et al. 2006). A larger extension of the shock front in poleward directions, where pre-outburst densities are smallest, is consistent with observations (O’Brien et al. 2006; Chesneau et al. 2007). In the orbital plane, the shock front displays a roughly circular shape for about 2/3 of its arc. Toward the RG and the former accretion wake, where densities are particularly high, the shock front advances more slowly.
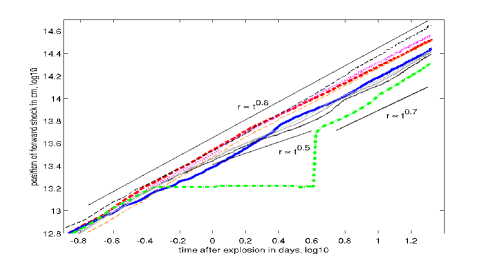
Quantitative evaluation of the shock position as a function of time, Fig 5 yields shock velocities scaling with time as , with for most times and directions. Poleward values of are slightly smaller after about day 10, while for directions toward the former accretion wake of the WD and times before day 6 after the explosion. Values for derived from observational data of the 2006 nova outburst (Bode et al. 2006; Sokoloski et al. 2006; Das et al. 2006) are in the same range up to day 6, and are somewhat larger () later on. The present simulation suggests that the observed range of values is real and a consequence of different observational diagnostics probing different regions of the expanding shock front. A clear change in the velocity of the shock as a function of time is seen only toward the former accretion wake.
There is no evident change in the expansion when the accumulated mass equals the ejected mass of , which occurs after about eight to ten days. Observations taken much later will show only mixed ejecta with the nova processed material significantly diluted.
2.4 Shrinking of the binary orbit
The orbit shrinks at a rate of per year, or 3% per million years. This finding is in line with previous suggestions (Hachisu et al. 1999; Jahanara et al. 2005). The absolute losses of mass and angular momentum from the system, and , scale linearly with the RG mass loss. For a RG mass loss rate of per year, the fractional losses per year are and , respectively, implying a dimensionless specific systemic angular momentum loss of . This time scale does not become significantly larger if the effect of the nova blast on orbital parameters is taken into account, provided not much more mass is ejected than was accreted during the 22 years.
3 Summary and conclusions
Our 3D simulations of the quiescent phase result in a density distribution of the circumstellar matter which is strongly stratified in poleward directions, leading to an expansion of the nova remnant that is roughly twice as fast in the poleward directions than within the orbital plane. With a reasonable RG mass loss rate of about yr-1, the computed accretion rate of about 10% of the RG mass loss rate results in accretion rate of yr-1 for the WD. Inserting this value into the multi-cycle nova models by Yaron et al. (2005) predicts on a qualitative level – though not in all quantitative details – correctly the recurrence time, amplitude, and fastness of the RS Oph nova. Our simulations further predict shrinking of the binary orbit at a rate of about 3% per million years, which would improve conditions for enhanced mass transfer. According to nova models by Yaron et al. (2005), enhanced mass loss should lead to shorter nova cycles and favour net mass gain over multiple nova cycles, a necessary condition for the evolution toward an SN Ia. On the other hand, the above RG mass loss suggests that the mass and thus the Roche volume of the RG will drastically shrink on a time scale of years, depending on the still not fixed mass of the star. The system then would likely enter a common envelope phase and produce a narrow WD-WD system. Further angular momentum losses by gravitational wave emission will drive the merger of the two WDs, an event which should be detectable with present GW detectors, e.g. Virgo and LIGO. Depending on what the result of the merger is, an accretion induced collapse or an SN Ia will end the life of the system RS Oph.
Acknowledgements.
We thank Dr. J. Favre from the Swiss Centre of Scientific Computing (CSCS) for graphics support and production of the movie accompanying this paper. Computations were performed at CSCS, at CINECA (Italy), and at the computing centre of ETH Zurich. The authors would like thank the staff of all supercomputing centres for substantial support. R.W. acknowledges financial support from the EGO Fellowship (VESF) and the INFN-Sezione Pisa, as well as the hospitality of the Max Planck Institute for Astrophysics, Garching, Germany, where part of the work was done. SNS thanks J. José, M. Bode, A. Evans, and S. Starrfield for valuable discussions.References
- Anupama (2002) Anupama, G. C. 2002, in American Institute of Physics Conference Series, Vol. 637, Classical Nova Explosions, ed. M. Hernanz & J. José, 32–41
- Bode et al. (2007) Bode, M. F., Harman, D. J., O’Brien, T. J., et al. 2007, ApJ, 665, L63
- Bode et al. (2006) Bode, M. F., O’Brien, T. J., Osborne, J. P., et al. 2006, ApJ, 652, 629
- Chesneau et al. (2007) Chesneau, O., Nardetto, N., Millour, F., et al. 2007, A&A, 464, 119
- Das et al. (2006) Das, R., Banerjee, D. P. K., & Ashok, N. M. 2006, ApJ, 653, L141
- Dobrzycka & Kenyon (1994) Dobrzycka, D. & Kenyon, S. J. 1994, AJ, 108, 2259
- Dobrzycka et al. (1996) Dobrzycka, D., Kenyon, S. J., Proga, D., Mikolajewska, J., & Wade, R. A. 1996, AJ, 111, 2090
- Dumm et al. (2000) Dumm, T., Folini, D., Nussbaumer, H., et al. 2000, A&A, 354, 1014
- Evans et al. (2006) Evans, A., Tyne, V. H., van Loon, J. T., et al. 2006, MNRAS, 373, L75
- Fekel et al. (2000) Fekel, F. C., Joyce, R. R., Hinkle, K. H., & Skrutskie, M. F. 2000, AJ, 119, 1375
- Hachisu & Kato (2001) Hachisu, I. & Kato, M. 2001, ApJ, 558, 323
- Hachisu et al. (2007) Hachisu, I., Kato, M., & Luna, G. J. M. 2007, ApJ, 659, L153
- Hachisu et al. (1999) Hachisu, I., Kato, M., & Nomoto, K. 1999, ApJ, 522, 487
- Harper et al. (2005) Harper, G. M., Brown, A., Bennett, P. D., et al. 2005, AJ, 129, 1018
- Iijima (2008) Iijima, T. 2008, in Proceedings of the workshop RS Ophiuchi (2006), ed. N. Evans, M. Bode, & T. O’Brien, preprint, http://www.astro.keele.ac.uk/rsoph/index.html
- Jahanara et al. (2005) Jahanara, B., Mitsumoto, M., Oka, K., et al. 2005, A&A, 441, 589
- Maeder & Meynet (1988) Maeder, A. & Meynet, G. 1988, A&AS, 76, 411
- Mitsumoto et al. (2005) Mitsumoto, M., Jahanara, B., Matsuda, T., et al. 2005, Astronomy Reports, 49, 884
- Nussbaumer & Vogel (1987) Nussbaumer, H. & Vogel, M. 1987, A&A, 182, 51
- Nussbaumer & Walder (1993) Nussbaumer, H. & Walder, R. 1993, A&A, 278, 209
- O’Brien et al. (1992) O’Brien, T. J., Bode, M. F., & Kahn, F. D. 1992, MNRAS, 255, 683
- O’Brien et al. (2006) O’Brien, T. J., Bode, M. F., Porcas, R. W., et al. 2006, Nature, 442, 279
- Seaquist & Taylor (1990) Seaquist, E. R. & Taylor, A. R. 1990, ApJ, 349, 313
- Shore (2008) Shore, S. N. 2008, in RS Ophiuchi (2006), ed. N. Evans, M. Bode, & T. O’Brien, ASP Conf. series, in press, preprint
- Shore et al. (1996) Shore, S. N., Kenyon, S. J., Starrfield, S., & Sonneborn, G. 1996, ApJ, 456, 717
- Sokoloski et al. (2006) Sokoloski, J. L., Luna, G. J. M., Mukai, K., & Kenyon, S. J. 2006, Nature, 442, 276
- Tuthill et al. (1999) Tuthill, P. G., Monnier, J. D., & Danchi, W. C. 1999, Nature, 398, 487
- Vaytet et al. (2007) Vaytet, N. M. H., O’Brien, T. J., & Bode, M. F. 2007, ApJ, 665, 654
- Walder (1997) Walder, R. 1997, in Astronomical Society of the Pacific Conference Series, Vol. 121, IAU Colloq. 163: Accretion Phenomena and Related Outflows, ed. D. T. Wickramasinghe, G. V. Bicknell, & L. Ferrario, 822
- Walder & Folini (2000) Walder, R. & Folini, D. 2000, in Astronomical Society of the Pacific Conference Series, Vol. 204, Thermal and Ionization Aspects of Flows from Hot Stars, ed. H. Lamers & A. Sapar, 281
- Worters et al. (2007) Worters, H. L., Eyres, S. P. S., Bromage, G. E., & Osborne, J. P. 2007, MNRAS, 379, 1557
- Yaron et al. (2005) Yaron, O., Prialnik, D., Shara, M. M., & Kovetz, A. 2005, ApJ, 623, 398
- Zarinelli et al. (1995) Zarinelli, A., Walder, R., & Nussbaumer, H. 1995, A&A, 301, 922