The core flux of the brightest 10m galaxies in the southern sky111 Based on observations collected at the European Southern Observatory, Chile, programme numbers 67.B-0582, 68.B-0575, 68.B-0033
Abstract
Aims. Near diffraction-limited images have been taken at 8.9, 11.9, and 12.9 m for the brightest extragalactic sources in the southern sky, in order to optimally plan N-band observations with MIDI (MID-infrared Interferometric instrument) at the VLTI.
Methods. We have assembled a sample of 21 objects consisting of all the AGNs observable from Paranal observatory, Chile, plus three non-AGN objects, with an estimated N-band flux greater than 400mJy. We used the TIMMI2 Mid Infrared instrument mounted on the ESO’s 3.6m telescope to obtain near diffraction-limited images in order to establish the unresolved core flux within arscsec.
Results. Positions and core total fluxes were obtained for all sources in our sample and compared with similar investigations in the literature. We find that 15 AGN and the nuclear starburst in NGC 253 exhibit an unresolved core flux mJy at 11.9m , making them promising targets for MIDI at the VLTI. For extended sources, near diffraction-limited images are presented and discussed.
Key Words.:
galaxies: active – galaxies: nuclei – galaxies:Seyfert– infrared: galaxies1 Introduction
Since the operation of MIDI at the VLTI began in 2004, astronomy has entered a new era where it is now possible to reach a resolution of a few milliarcseconds at infrared wavelengths, about 15 times the resolution of the largest single-dish telescopes. MIDI (operates in the N-band (8-13m ) and therefore it is ideal for observing heated dust expected in AGNs and starburst galaxies. Although it is most commonly used in observing galactic objects like circumstellar disks (Leinert et al. 2004) and dust shells around evolved stars (Ohnaka et al. 2005), MIDI has been successfully used to observe extragalactic objects. The main limitation of MIDI in this context is its limiting flux of 400mJy, so only bright objects can be observed currently. So far, MIDI has been used to observe dusty torii in AGNs, objects which are central to the AGN unification model, and which have proven too small to be resolved by a single dish telescope. With its superior resolution, the presence of a torus-like structure has been established in the galaxy NGC 1068 /citepJaffe04 by using only two baseline observations, and additional MIDI observations with extensive coverage of up to 21 baselines have measured the geometrical properties of the torus in the Circinus galaxy ((Tristram et al. 2007)) and NGC 1068 (Raban et at, submitted). A resolved dust structure was also detected in the core of Centaurus A (Meisenheimer et al. 2007). Apart from active galactic nuclei, the only extragalactic objects bright enough for MIDI are starburst galaxies. For such objects, MIDI can be used to measure the size and geometry of the nuclear star-forming region.
Here, we have assembled a list of the brightest extragalactic objects at 10m , and observed them at 8.9 ,11.9 and 12.9 m with the TIMMI2 instrument, mounted on the 3.6m telescope in La Silla, Chile. Our goal here is to give the basic information needed in order to plan VLTI observation of cores of galaxies. Positions and core fluxes were determined for all sources, and for those sources which were resolved, we present and discuss images at 8.9, 11.9 and 12.9 m .
2 Sample selection
The target list consists of all AGN’s observable from Cerro Paranal () and have an estimated total N-band flux density brighter than or mJy, which is the limiting magnitude for observations with MIDI, estimated from previous N-band measurements available in the literature. This list of 21 objects (without NGC 1068) was taken from the catalogue of Seyfert galaxies by Lipovetsky et al. (1988) to which we added additional sources from the compilations of Granato et al. (1997) and Maiolino et al. (1995), plus the IR luminous galaxy M83, the starburst galaxy NGC 253 and the famous quasar 3C 273. See Table 1 for a complete list.
3 Observations
The mid-infrared observations were carried out with the TIMMI2 instrument on the ESO 3.6m telescope on La Silla, Chile, on the nights of 6 and 7 of August 2001 and 8 to 10 February 2002. TIMMI2 is a mid-infrared imager and spectrograph operating in the M (5 m ), N (10 m ) and Q (20 m ) atmospheric bandpasses. The camera is equipped with a pixel Si:As array and can operate at a scale of 0.2 or 0.3 arcsec/pixel. We used the 0.2 arcsec/pixel scale resulting in a total field-of-view of . For a complete description of the instrument refer to Reimann et al. (2000) and Käufl et al. (2003).
For most of the observations we selected the 1.2m wide 11.9m filter since it offered the best signal to noise ratio for a given integration time. A ratio of flux over noise (per pixel) of about a 200 is achieved by 40 minutes of integration time for a 400mJy source. Sources that were significantly brighter were observed for shorter periods of time. Some targets were supplemented with additional images with the the 8.6 m filter (m ) and the 12.9 m filter (m ). The complete observation log can be found in table 1.
Seeing conditions as monitored in the optical were highly variable, ranging between 1 and 1.8 arcseconds on August 6 to 0.36 and 0.8 arcseconds on August 7 2001, while the humidity at ground level remained around 5%. During the February 2002 run the seeing was constant at 1 arcsecond with a very high humidity at ground level of 80% 95%. In order to remove the strongly variable background radiation of the telescope and atmosphere in the mid infrared we used the standard chopping and nodding method. In this mode the secondary mirror chops with a frequency of typically several Hz North-South and the telescope is nodded approximately every 5 minutes East-West. As all sources turned out to be compact at 10m , the small field chop and nod mode was used, keeping the objects always in the frame, while still avoiding overlapping of the images which might lead to loss of flux. This effectively cuts the field-of-view of the chip in 4 pieces and is therefore only possible for compact targets. such as extended star forming regions, the relatively small throw we used can substract these from the image, leading to an underestimation of the flux. During chopping the detector is continuously read-out with a frequency of about 40 Hz and each 100 image pairs are subtracted, stacked and saved to disk. The result is a series of chopped frames with both a positive and a negative image of the source, with an exposure time of approximately 25 seconds per frame. Subtracting 2 frames from different nod positions results in 2 positive and 2 negative acquisitions of the object. We used a chop throw of 20 arcsec North-South and a nod of 30 arcsec East-West (except for the observations of M83 where these values were 25 and 30 arcsec respectively), allowing for both the chopped as well as the nodded positions to fall onto the detector, while at the same time preventing any overlap of the positive and negative images.
Due to technical problems with the autoguider there was a slow position drift during the integrations. This was taken into account during data reduction.
4 Reduction
Standard reduction techniques were used to convert a set of raw frames into a final, photometrically calibrated image of the source. Flat field correction was not applied since for all ground-based mid-IR instruments no possibility of a reliable flatfield correction exists up to now (Starck et al. 1999), and since the chopping and nodding method used to eliminate the thermal background results in a relatively flat images. For our data cosmic rays removal is not required since the number of background photons is large, making the cosmic ray’s contribution undetectable. Bad pixels were detected using the statistical variation of each pixel, extrapolated and excluded from the measurements. Three different modes for referencing and co-adding were implemented to accommodate different SNR levels. For all these modes the image peak was determined by fitting a Gaussian of appropriate size to the central airy disk:
-
•
For the brightest sources with a flux above mJy (i.e. Circinus, NGC1068, NGC253, NGC5128) the peak SNR was high enough so that each of the four images (2 positive, 2 negative) in a single frame could be separately fitted, referenced and co-added in order to get the best registration, thus compensating for possible small errors in the chopping distance.
-
•
For the intermediate sources with a core flux above mJy we assumed the chopping distance to be fixed, first combining the positive and negative images before their center point is determined.
-
•
For weak sources below 650 mJy the image pairs are first co-added with a fixed chopping distance. Images taken just before and after each image are also co-added before being fitted. This procedure first averages a subset of images, calculates the peak position and then uses this position for next subset of images, iterating until the corrections are smaller then 0.1 pixel.
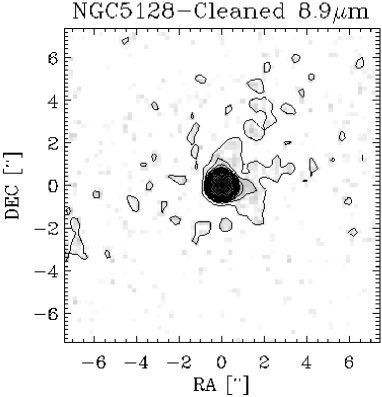
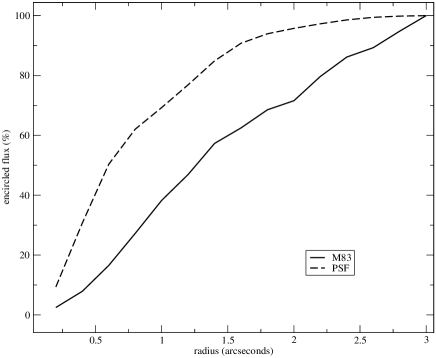
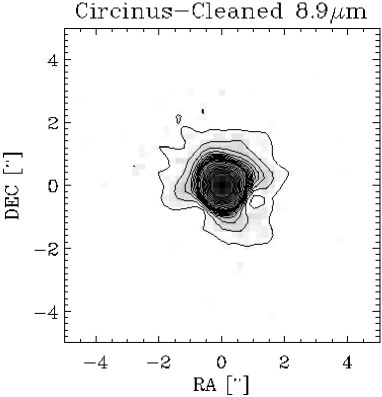
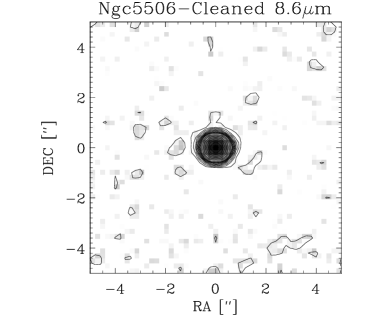
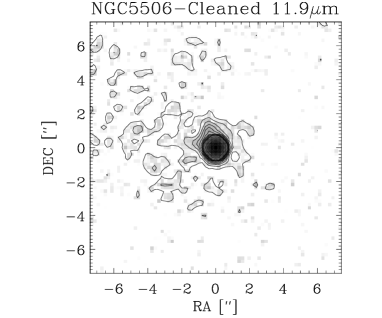
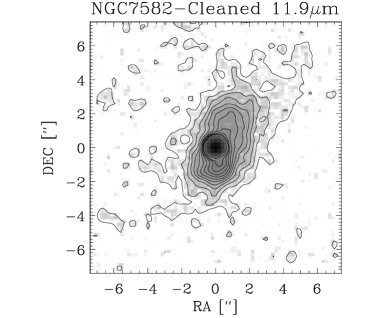
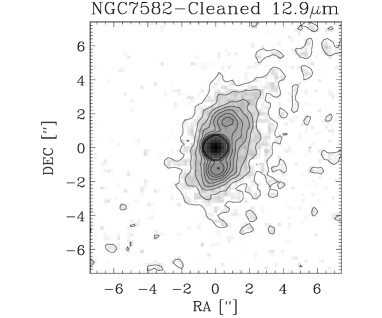
Since the transmissivity of the atmosphere is highly variable in the observed wavelengths, absolute calibration is challenging. The system is photometrically calibrated using bright stars of known flux that have been observed every two hours. Care was taken that the stars are observed at similar altitudes to the science objects. For the photometry measurement a distinction is made between objects where the nucleus is a mere point source and objects displaying extended emission. For point sources a aperture flux was taken, covering the central airy disk out to the first minimum. For extended objects the peak value was used since the PSF is well sampled with per pixel. Using the peak value minimizes contamination from extended components. For these sources the growth curve of the source and the PSF are also presented in order to make clear which part of the flux comes from an unresolved source. The peak flux corresponds to an aperture of 1.2. An exception is NGC 7582, for which the flux was measured with a aperture. In order to improve the visual appearance all images have also been deconvolved, using a simple but robust, CLEAN method, where a PSF taken from a nearby reference star is iteratively subtracted from the peak position and replaced with a Gaussian with a similar width. Flux errors are dominated by the calibration errors from the reference stars measured by estimating the fluctuations of the transmissivity of the sky by comparing the fluxes of the same objects (stars or AGNs) close in time. Accordingly, the photometric error is about 15% for all sources.
5 Results
Core flux measurements and core positions for each source are presented in Table 1. Figures 1 to 8 show high resolution contour images of eight objects out of the 21 objects observed, omitting those sources for which more recent images are available and images of unresolved sources. A brief discussion of each source is presented, along with references for other similar or complementary data. All sources show an unresolved core with little or no extended emission, with the exception of NGC 253, NGC 7582, NGC1365, and M83, which show considerable extended emission.
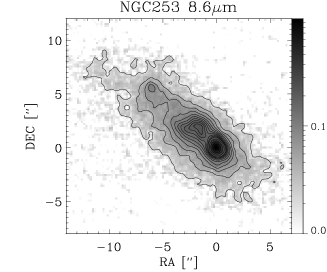
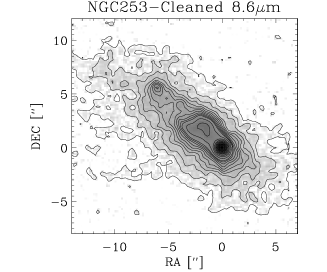
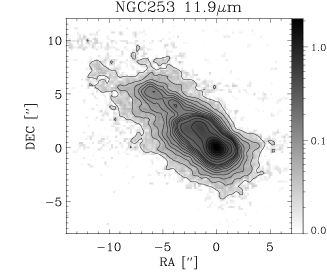
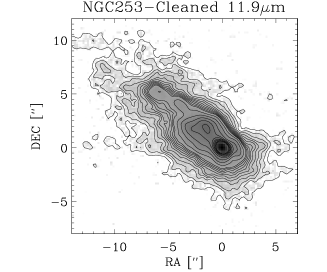
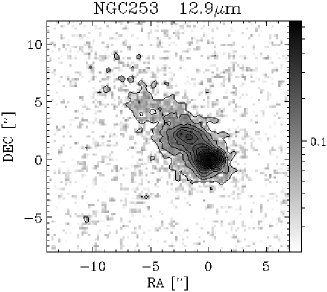
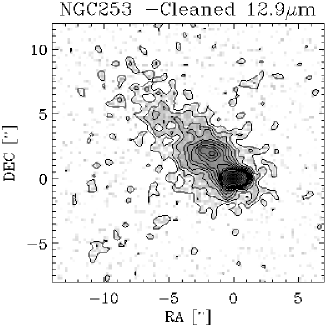
NGC 253
Figure 1. This nearby starburst galaxy shows complex extended emission in all observed wavelengths: 8.6, 11.9 and 12.9m . All images show two sources, the bright source seems to be resolved. The extended emission shows an elongation of 3” to the north east. An additional peak is seen clearly in the 8.6 m image, and to a lesser extent in the 11.9m image, and corresponds to ”peak 3” that Kalas & Wynn-Williams (1994) identify at 3.28m and is most likely to be PAH emission. The 12.9 m image, shows the structure boarded by the two peaks reported by Boeker et al. (1998) as well as other authors, and is very similar to the map of these authors and the maps of Keto et al. (1999). It is most likely to be dominated by a combination of emission and 12.7m PAH emission (Boeker et al. (1998), Förster Schreiber et al. (2003)). Since the 11.9 filter is centered on 11.66m with a FWHM of 1.16m it is likely that the 11.9m extended emission also includes 11.3m PAH emission. Galliano et al. (2005) show 11.9m deconvolved images and identify six sources, as opposed to four in our 11.9m image Comparing the two images, sources M2 and M3 of Galliano et al. (2005) coincide with our second brightest peak, and sources M5 and M6 with the two peaks to the North-East. The flux measured by Galliano et al. (2005) for the main peak (mJy) is a factor of two higher than the flux measured in this work. This discrepancy can be attributed to the 2” aperture used by Galliano et al. (2005) as opposed to out method of measuring the peak value (see §4) Identifying out second peak with M2+M3 our flux (1150 mJy) is 50 % higher than the combined flux of M2 and M3.
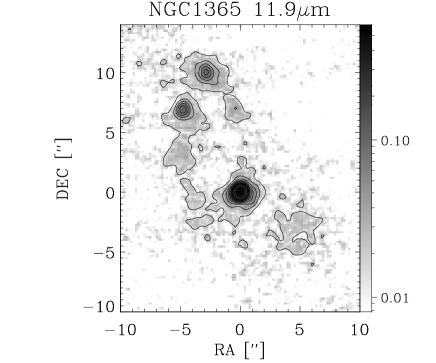
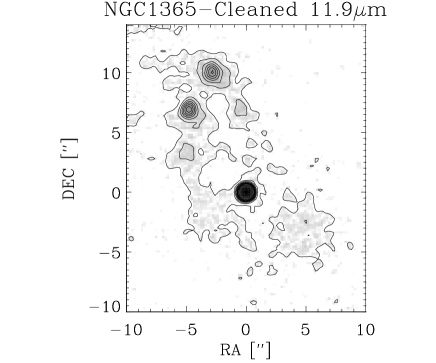
NGC 1365
Figure 2. A face-on spiral galaxy with a prominent bar. Our m image shows an unresolved nucleus and two point sources to the north east, identified by Galliano et al. (2005) as M5 and M6. This structure is surrounded by an arm like faint extended emission. In addition, the deconvolved image shows slight point like emission from sources M7 and M4 of Galliano et al. (2005). The authors identify their M4, M5 and M6 sources with radio counterparts of Saikia et al. (1994), and conclude that these sources are embedded young massive star clusters. Flux measurements of the nucleus are in excellent agreement with Galliano et al. (2005), but are higher than those of Siebenmorgen et al. (2004) who measured a flux of 400mJy at 8.5m and 460mJy at 10.4m . This discrepancy can be explained by the multi-source structure of NGC 1365, causing flux measurements very sensitive to telescope positioning. The weak extended emission to the South West of the nucleus also appears as two point sources in the 11.9 and 10.4 m deconvolved maps of Galliano et al. (2005) and is most likely not an artifact.
IRAS 05189-2524
Observations of this Seyfert 2 galaxy at show a completely unresolved core with no deviations from the PSF larger then . An unresolved core is also reported by Siebenmorgen et al. (2004) with 8.6, 10.4 and 11.9m flux densities of 420,420 and 570 mJy, respectively, and by Soifer et al. (2000), who present a 12.5m image and 12.5 24.5m fluxes.
NGC 2377
For this object we give an upper limit for the flux of 60mJy.
MCG 5-23-16
For this S0 galaxy hosting a Seyfert 1.9 nucleus we have an unresolved core with a flux of 646 mJy at 11.9m .
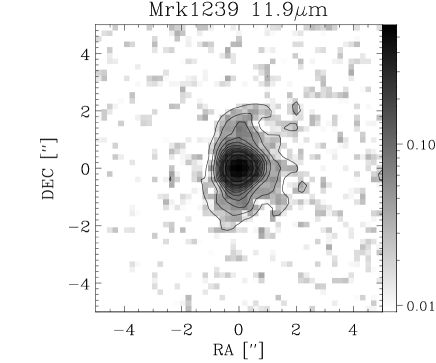
Mrk1239
NGC 3256
Our image (not presented here) of this IR-luminous merger system shows an unresolved core, In contrast to Siebenmorgen et al. (2004) who present a resolved, yet featureless image, taken with shorter exposure time. The difference may be explained by a change in seeing between the calibrator, from which the PSF is determined, and NGC 3256.
NGC 3281
For this Seyfert 2 galaxy we measure 625 mJy for 11.9 m , which is similar to the N-band flux found at Krabbe et al. (2001) mJy, measured with a 2.2m telescope, and therefore a diffraction limit 1.6 times that of our observation. A 10.5 m image of NGC 3281 dominated by a point source and marginal evidence for an extended emission component is also presented by Krabbe et al. (2001).
NGC 3758
(Mkn 739) For this double-nuclei Seyfert I/starburst galaxy a low flux of mJy is measured.
NGC 3783
NGC 3783 is a nearly face-on SBa galaxy with a very bright, highly variable, Seyfert 1 nucleus. The image shows an unresolved point source.
3C273
NGC 4594
MCG-3-34-6
The low flux measured here, mJy at 11.9m is much smaller than the 440 mJy flux measured by Maiolino et al. (1995) at 10.4m , with a aperture. The origin of the discrepancy are unclear since this object has not been studied before apart from the single measurement of Maiolino et al. (1995) mentioned above, and so it is possible that the N-band emission is variable. Our image shows an unresolved point source and therefore it is unlikely that extended emission is responsible for the discrepancy.
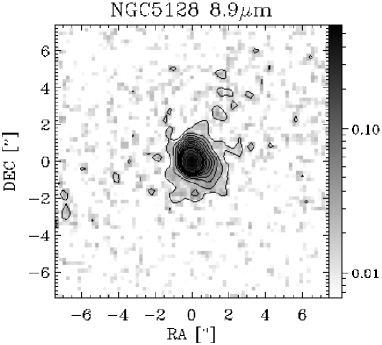
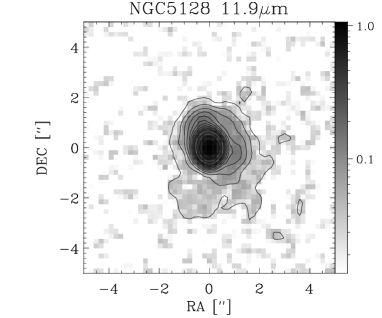
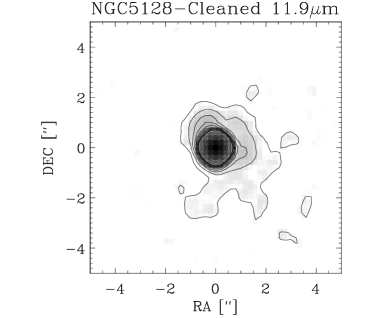
NGC 5128
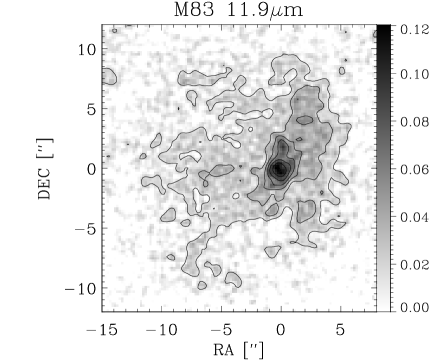
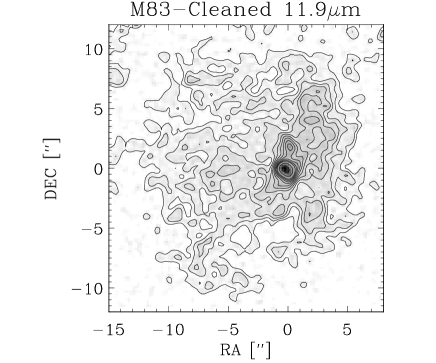
M 83
Figure 5 This near, face-on barred spiral galaxy shows mostly extended emission surrounding a faint central object. The extended emission is dominated by PAHs which account for the majority if the MIR luminosity (Vogler et al. 2005). The flux measured, mJy, is identical with the flux measured by Siebenmorgen et al. (2004). Our images, however, show a clear, although faint, central source, while Siebenmorgen et al. (2004) report only fuzzy extended emission. The LW3 filter (m ) of Vogler et al. (2005) show the emission clearly tracing the spiral arms of M83, which is not seen in our image.
ESO 445-G50
For this Seyfert I galaxy we measure 352 mJy at 11.9m . A 10.4 m flux of 640 mJy can be found at Siebenmorgen et al. (2004).
Mrk463
The image of this double-nuclei Seyfert 2 galaxy shows an unresolved core at 11.9m , measuring 338 mJy.
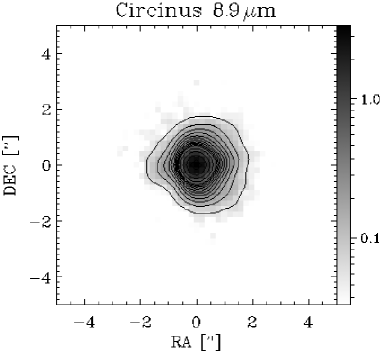
Circinus
Figure 6 Observations of this nearby spiral were made at 11.9 m and 8.6 m . The seeing at for the 11.9 m point was bad, so no statement can be made whether the central peak is resolved or not. The 8.6 m does show a slightly resolved background component yet whether this is a disk or circum-nuclear emission (reported by Krabbe et al. (2001) with a radius of is not clear. The image presented here is very similar to the one presented by Siebenmorgen et al. (2004). Recent high resolution 8.74 and 18.33m images and flux measurements are also presented by Packham05, which also find a higher 8.74m flux, 5.5-8.4 Jy, for a range of apertures from to .
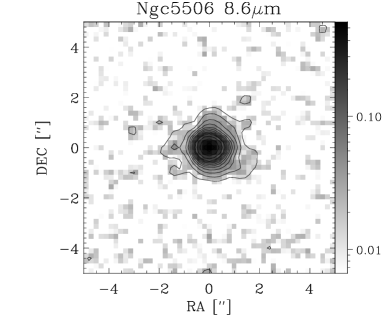
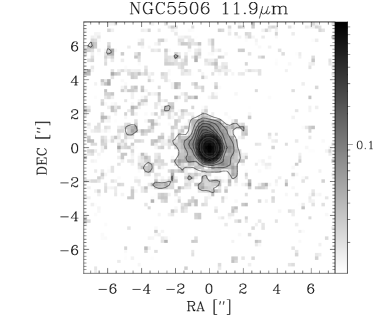
NGC 5506
Figure 7 For this edge-one irregular Seyfert 1 (S1i) galaxy ,we show here the first high resolution images at 8.6 and 11. 9m . The 8.6m image shows an unresolved core while extended emission to the north-east is seen in the image. The 11.9m flux measured, 908 mJy, is similar to the Siebenmorgen et al. (2004) measurement of 1060 mJy.
NGC 7469
For this prototypical Seyfert 1 galaxy we encountered an unknown image quality problem. Soifer et al. (2003) present a high resolution () 12.5 m image of the nucleus of NGC 7469, resolving the ring structure around the nucleus and an extended structure in the nucleus itself.
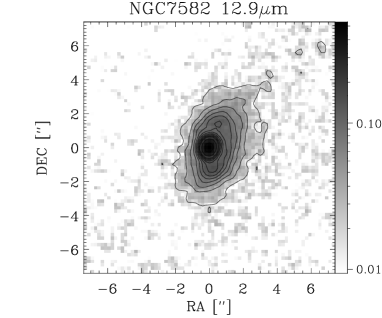
NGC 7582
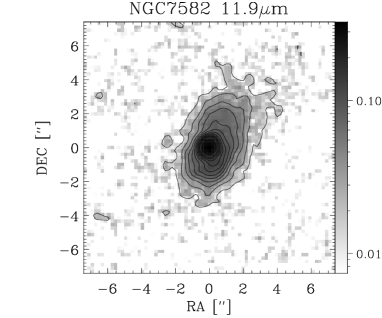
NGC 7582 is a classic Seyfert 2 galaxy which, during a period of five months in 1999 showed broad lines characteristic of a Seyfert 1 galaxy, which may indicate the presence of a patchy torus. Aretxaga et al. (1999). 50% of the flux found in extended emission with a peak offset from the center of the extended emission. The extended emission is seen elongated along the South-North direction. The 12.9m image shows two weak sources to the North and to the South of the main peak, also clearly seen in the 12.9m image of Acosta-Pulido et al. (2003). The 11.9m image shows one slightly resolved peak surrounded by extended emission. Flux at 11.9m is very similar to that of Siebenmorgen et al. (2004), although the 11.9m image they present shows considerably less extended emission. Similar extended emission can also be seen in the N1 (m ) image of Acosta-Pulido et al. (2003).
| Name | RA(J2000) | DEC(J2000) | D [Mpc] | Flux [mJy] | Date | Exp. [sec] | Apreture [”] | |
|---|---|---|---|---|---|---|---|---|
| 11.9m | 8.9m | |||||||
| N | 00 47 33.1 | -25 17 17.2 | 3.3 | 2040-2800 | 1140 | 6 Aug. 2001 | 2955 | 1.2 |
| N | 1160 | 695 | 1.2 | |||||
| N | 03 33 36.4 | -36 08 25.5 | 20.7 | 606 | - | 6 Aug. 2001 | 5373 | 1.2 |
| N | 157 | - | 1.2 | |||||
| N | 152 | - | 1.2 | |||||
| IRS 05189-2524 | 05 21 01.4 | -25 21 44.9 | 172.6 | 545 | - | 7 Aug. 2001 | 2148 | 1.6 |
| N 2377 | 07 24 56.8 | -09 39 36.9 | 31.3 | - | 8 Feb. 2002 | 752 | 1.6 | |
| MCG-5-23-16 | 09 47 40.2 | -30 56 54.2 | 31.9 | 648 | - | 8 Feb. 2002 | 2256 | 1.6 |
| Mrk 1239 | 09 52 19.1 | -01 36 43.5 | 79.7 | 638 | - | 8 Feb. 2002 | 1504 | 1.6 |
| N 3256 | 10 27 51.8 | -43 54 08.7 | 35.4 | 553 | - | 8 Feb. 2002 | 1504 | 1.6 |
| N 3281 | 10 31 52.0 | -34 51 13.3 | 40.9 | 625 | - | 8 Feb. 2002 | 1880 | 1.6 |
| N 3758 | 11 36 29.0 | +21 35 47.8 | 122 | - | 8 Feb. 2002 | 752 | 1.6 | |
| N 3783 | 11 39 01.8 | -37 44 18.7 | 37.2 | 590 | - | 7 Aug. 2001 | 1074 | 1.6 |
| 3C 273 | 12 29 06.7 | +02 03 08.5 | 649 | 345 | - | 8 Feb. 2002 | 1504 | 1.6 |
| N 4594 | 12 39 59.4 | -11 37 23.0 | 12.4 | - | 7 Aug. 2001 | 537 | 1.6 | |
| MCG-3-34-6 | 13 10 23.7 | -21 41 09.0 | 95.4 | - | 7 Aug. 2001 | 537 | 1.6 | |
| N 5128 | 13 25 27.6 | -43 01 08.8 | 5.3 | 1220 | 635 | 6 Aug. 2001 | 2149 | 1.6 |
| M 83 | 13 37 00.8 | -29 51 58.6 | 5.2 | 232 | - | 6 Aug. 2001 | 1209 | 1.2 |
| ESO 445-G50 | 13 49 19.3 | -30 18 34.4 | 64.2 | 352 | - | 6 Aug. 2001 | 2149 | 1.6 |
| Mrk 463 | 13 56 02.9 | +18 22 19.5 | 20.7 | 338 | - | 7 Aug. 2001 | 1611 | 1.6 |
| Circinus | 14 13 09.3 | -65 20 20.6 | 3.6 | 9700 | 4700 | 6 Aug. 2001 | 1074 | 1.6 |
| N 5506 | 14 13 15.0 | -03 12 27.2 | 25 | 908 | - | 7 Aug. 2001 | 1074 | 1.6 |
| N 7469 | 23 03 15.6 | +08 52 26.4 | 69.2 | 414 | - | 6 Aug. 2001 | 2687 | 1.6 |
| N 7582 | 23 18 23.5 | -42 22 14.0 | 21.3 | 670 | - | 6.Aug.2001 | 2687 | 2.6 |
able notes. Ra and Dec coordinates are core coordinates taken directly from the telescope position. Distances are from NED. RA & DEC error: . Flux errors are .
6 Conclusion
We presented new high resolution mid-infrared images and fluxes at 8.9,11.9 and 12.9m for the brightest AGN’s observable from Cerro-Paranal. Most sources show an unresolved core, with little or no extended emission. Considerable extended emission has only been detected for NGC 253, NGC 7582 and M83. For each source, a brief discussion is given along with a comparison with other relevant published data. In general we find our images and fluxes to be in agreement with previous papers.
References
- Acosta-Pulido et al. (2003) Acosta-Pulido, J. A., Pérez García, A. M., Prieto, M. A., Rodríguez-Espinosa, J. M., & Cairós, L. M. 2003, in Revista Mexicana de Astronomia y Astrofisica Conference Series, 198–201
- Aretxaga et al. (1999) Aretxaga, I., Joguet, B., Kunth, D., Melnick, J., & Terlevich, R. J. 1999, ApJ, 519, 123
- Boeker et al. (1998) Boeker, T., Krabbe, A., & Storey, J. W. V. 1998, ApJ, 498, L115+
- Förster Schreiber et al. (2003) Förster Schreiber, N. M., Sauvage, M., Charmandaris, V., et al. 2003, A&A, 399, 833
- Galliano et al. (2005) Galliano, E., Alloin, D., Pantin, E., Lagage, P. O., & Marco, O. 2005, A&A, 438, 803
- Gorjian et al. (2004) Gorjian, V., Werner, M. W., Jarrett, T. H., Cole, D. M., & Ressler, M. E. 2004, ApJ, 605, 156
- Granato et al. (1997) Granato, G. L., Danese, L., & Franceschini, A. 1997, ApJ, 486, 147
- Käufl et al. (2003) Käufl, H., Sterzik, M. F., Siebenmorgen, R., et al. 2003, in Instrument Design and Performance for Optical/Infrared Ground-based Telescopes. Edited by Iye, Masanori; Moorwood, Alan F. M. Proceedings of the SPIE, Volume 4841, pp. 117-128 (2003)., 117–128
- Kalas & Wynn-Williams (1994) Kalas, P. & Wynn-Williams, C. G. 1994, ApJ, 434, 546
- Keto et al. (1999) Keto, E., Hora, J. L., Fazio, G. G., Hoffmann, W., & Deutsch, L. 1999, ApJ, 518, 183
- Krabbe et al. (2001) Krabbe, A., Böker, T., & Maiolino, R. 2001, ApJ, 557, 626
- Leinert et al. (2004) Leinert, C., van Boekel, R., Waters, L. B. F. M., et al. 2004, A&A, 423, 537
- Lipovetsky et al. (1988) Lipovetsky, V. A., Neizvestny, S. I., & Neizvestnaya, O. M. 1988, Soobshcheniya Spetsial’noj Astrofizicheskoj Observatorii, 55, 5
- Maiolino et al. (1995) Maiolino, R., Ruiz, M., Rieke, G. H., & Keller, L. D. 1995, ApJ, 446, 561
- Meisenheimer et al. (2007) Meisenheimer, K., Tristram, K. R. W., Jaffe, W., et al. 2007, A&A, 471, 453
- Ohnaka et al. (2005) Ohnaka, K., Bergeat, J., Driebe, T., et al. 2005, A&A, 429, 1057
- Reimann et al. (2000) Reimann, H., Linz, H., Wagner, R., et al. 2000, in Proc. SPIE Vol. 4008, p. 1132-1143, Optical and IR Telescope Instrumentation and Detectors, Masanori Iye; Alan F. Moorwood; Eds., 1132–1143
- Saikia et al. (1994) Saikia, D. J., Pedlar, A., Unger, S. W., & Axon, D. J. 1994, MNRAS, 270, 46
- Siebenmorgen et al. (2004) Siebenmorgen, R., Krügel, E., & Spoon, H. W. W. 2004, A&A, 414, 123
- Sitko et al. (1982) Sitko, M. L., Stein, W. A., Zhang, Y.-X., & Wisniewski, W. Z. 1982, ApJ, 259, 486
- Soifer et al. (2003) Soifer, B. T., Bock, J. J., Marsh, K., et al. 2003, AJ, 126, 143
- Soifer et al. (2000) Soifer, B. T., Neugebauer, G., Matthews, K., et al. 2000, AJ, 119, 509
- Starck et al. (1999) Starck, J. L., Abergel, A., Aussel, H., et al. 1999, A&AS, 134, 135
- Tristram et al. (2007) Tristram, K. R. W., Meisenheimer, K., Jaffe, W., et al. 2007, A&A, 474, 837
- Vogler et al. (2005) Vogler, A., Madden, S. C., Beck, R., et al. 2005, A&A, 441, 491
Appendix A Figures