SN 2005 gj: Evidence for LBV supernovae progenitors? ††thanks: Based on observations at the European Southern Observatory with UVES on the VLT in programme 276.D-5020A and 278.D-0270.
There has been mounting observational evidence in favour of Luminous Blue Variables (LBVs) being the direct progenitors of supernovae. Here we present possibly the most convincing evidence yet for such progenitors. We find multiple absorption component P-Cygni profiles of hydrogen and helium in the spectrum of SN 2005gj, which we interpret as being an imprint of the progenitors mass-loss history. Such profiles have previously only been detected in Luminous Blue Variables. This striking resemblance of the profiles, along with wind velocities and periods consistent with LBV’s leads us to connect SN 2005gj to an LBV progenitor.
Key Words.:
supernovae: general – supernovae: individual (SN 2005gj, SN 2002ic)– circumstellar matter – stars: evolution, winds, outflow1 Introduction
In the canonical picture of the evolution of very massive () stars (e.g. Langer et al. 1994), the role of mass loss is widely accepted as being the key process which drives O and B-type stars into the luminous blue variable (LBV) phase, before entering the He-burning Wolf-Rayet (WR) stage, at the end of which, lasting at least yrs (Meynet & Maeder 2003; Eldridge & Vink 2006), the object is expected to explode as a core-collapse supernova (CcSN).
Of late, there has been a growing body of observational evidence that points to LBVs as the direct progenitors of a subset of CcSNe. Recently Kotak & Vink (2006) suggested that LBVs themselves might explode; they proposed that the quasi-periodic modulations observed in the radio light curves of some SNe were a manifestation of variable mass loss during the S Doradus phase of LBVs, during which the star exhibits brightness variations of 1-2 magnitudes. This variability is commonplace amongst LBVs (Humphreys & Davidson 1994) and is distinct from the giant outbursts such as those of P Cygni or Carina.
Interestingly, the progenitor of SN 2006jc was observed to have a giant eruption just two years prior to explosion (Nakano et al. 2006; Foley et al. 2007; Pastorello et al. 2007). Foley et al. (2007) argue that the progenitor star was of an early type (WNE) Wolf-Rayet star. Given that WR stars have never previously been observed to undergo an LBV-like eruption, Pastorello et al. (2007) suggest a massive binary system consisting of an LBV and a WR star as an alternative progenitor system for SN 2006jc. In this scenario, the pre-SN explosion coincident with SN 2006jc is attributed to the LBV, while the SN resulted from the WR companion. A simpler explanation would be to accept that a single, presumably massive star exploded during or at the very end of the LBV phase.
There are other indications that LBVs may explode. Gal-Yam et al. (2007) detected a very luminous source in pre-explosion images of SN 2005gl, but it remains to be confirmed whether or not this is a single object. Other interesting hints come from the similarities in LBV nebula morphologies and the circumstellar medium of SN 1987A (Smith 2007a). Finally, the luminous type IIn SN 2006gy, may also have undergone an Car-type eruption prior to explosion (Smith et al. 2007b).
A potential problem with a scenario in which LBVs explode is that current stellar evolution models do not predict core-collapse during or soon after the LBV phase; indeed, in most evolutionary models, the star has not even reached its core He-burning phase. In other words, in current models, the core is not evolved enough for core-collapse to occur. Pastorello et al. (2007) point out that known LBVs that have undergone outbursts still retain some hydrogen and helium while SN 2006jc showed no spectral features due to hydrogen before 65 d. However, it is not inconceivable that the pre-explosion outburst removed most of the outer layers, and/or that residual amounts of H or He may not necessarily give rise to strong lines.
Here, we present the intriguing case of SN 2005gj for which we show spectroscopic evidence to support the suggestion of Kotak & Vink (2006) that the variable mass-loss of S Dor variables betrays them as the endpoints of very massive stars.


2 Data acquisition and reduction
Optical spectra of SN 2005gj were obtained on the 17 Dec. 2005 and 1 Oct. 2006, with the Ultra-Violet Echelle Spectrograph (UVES) on the Very Large Telescope. These epochs correspond to 86 and 374 days respectively, assuming an explosion date of 22 Sep. 2005 (Aldering et al. 2006). Dichroic #2 was used to split the light into the blue and red arms of the spectrograph. The standard setup with central wavelengths at 4370 and 8600 Åwas employed, thus providing coverage in the blue of 3760-4985 Å, and in the red arms of 6705-8520 Å and 8660-10255 Å. For both epochs the target was observed for 2300 s with a slit width of and a seeing of providing resolutions of 6 and 4.5 in the blue and red arms, respectively.
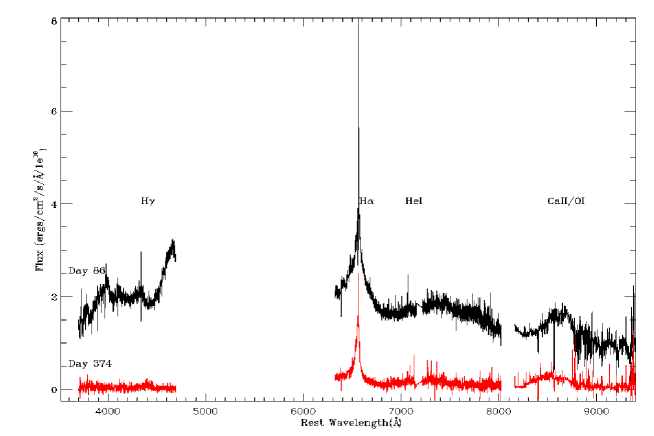
The data were reduced with the UVES pipeline implemented in the ESO-MIDAS software. Wavelength calibration was carried out using Th-Ar arcs taken on the same night as the SN 2005gj exposures, while flux calibration and telluric subtraction of the data was done with respect to the standard LTT 1020. The flux calibrated spectra extracted from each chip and corrected to the rest frame are presented in Fig. 1. A redshift of 0.0616 0.0002, as found byAldering et al. (2006), was adopted as it was consistent with our data.
3 Spectral Analysis
| Fit properties | Narrow E | NAC (a) | NAC (b) |
|---|---|---|---|
| Day 86: Hα | |||
| (Å) | 6564.290.02 | 6558.350.06 | 6561.250.06 |
| FWHM () | 128 2 | 706 | 13321 |
| L (1040 ergs s-1) | 1.610.02 | 0.140.01 | 0.20 0.02 |
| vedge () | 295 57 | 120 75 | |
| Day 86: Hγ | |||
| (Å) | 4341.390.02 | 4338.010.10 | 4340.040.10 |
| FWHM () | 97 3 | 68 5 | 115 4 |
| L (1040 ergs s-1) | 0.150.04 | 0.040.01 | 0.120.05 |
| vedge () | 286 57 | 115 64 | |
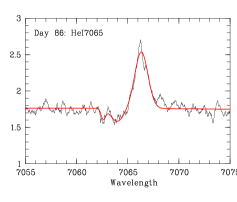
| Day 86: Hei7065 | |||
| (Å) | 7066.330.03 | 7062.610.09 | 7063.970.10 |
| FWHM () | 64 3 | 22 9 | 6215 |
| L (1040 ergs s-1) | 0.100.02 | 0.0060.001 | 0.0220.004 |
| vedge () | 160 59 | 95 57 | |
| Day 374: Hα | |||
| (Å) | 6562.600.04 | 6559.70 0.12 | |
| FWHM () | 88 10 | 110 23 | |
| L (1040 ergs s-1) | 0.18 0.09 | 0.028 0.005 | |
| vedge () | 190 64 | ||
The optical spectra of SN 2005gj are dominated by H in emission. The profile consists of a strong narrow emission component superimposed on broad emission wings (Fig. 1). Such H profiles are the hallmarks of SN IIn spectra (‘n’ standing for ‘narrow’), believed to arise from massive progenitors that have undergone substantial mass-loss prior to explosion (Schlegel 1990). The multi-component profiles are characterised by broad underlying emission due to SN ejecta, an intermediate emission resulting from shocked material at the interaction front between the ejecta and the CSM, while the narrow component presumably arises from unshocked CSM photoionised by the SN.
A striking feature of the P Cygni-like component of the H profile at 86 d is the presence of two clear absorption troughs (Fig. 1). This has previously not been observed in SN spectra. That this feature is associated with the SN is clear, given the evolution of the profile between the two epochs. Aldering et al. (2006) noted that the absorption component in the narrow P-Cygni profile was asymmetric and extended far out towards the blue edge. Due to the higher resolution of our spectra (c.f. resolutions of a few hundred Aldering et al. 2006; Prieto et al. 2007), we were able to resolve this narrow component. Careful inspection of the data revealed clear double absorption troughs in our day 86 spectrum associated with H, He i 7065 Å (Fig. 2), and also H, and He i 6078 Å albeit with poorer signal-to-noise ratios. By 400 d, the H profile had changed significantly: the intensity dropped by 1710-16 ergs-1 cm-2 s-1, a single absorption trough remained, and a broad blue shoulder had developed, probably corresponding to the emergence of [O i].
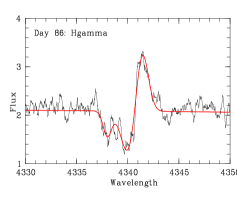
To obtain quantitative information from these profiles we have decomposed them with multiple Gaussian profiles for the individual emission and absorption peaks. The fits are shown in Figs. 1 & 2 and their physical parameters are summarised in Table 1. The H emission profiles at both epochs were fit by 3 Gaussians representing the aforementioned broad, intermediate and narrow emission components, however this intermediate component was not detected in the H & He i 7065 Å profiles. In addition to the emission peaks, the H profile from day 86 was fit with double absorption components, whilst only a single absorption trough was required for the day 374 spectra.
Due to our incomplete wavelength coverage, particularly to the blue of H, the velocities determined from the Gaussian fits to the broad emission peak are subject to large uncertainties. From the Balmer lines we determine an ejecta velocity of 30000 5000 at day 86, which is consistent with that derived by Aldering et al. from their day 11 spectra. At day 374 the velocity decreased to 15500 5000 . The intermediate H emission component was fit by a Gaussian with FWHM 2560 30 on day 86 and 1680 30 on day 374. Whilst this measurement is a good indication of the shock velocity for the symmetric profile presented at day 86, this is not the case for the asymmetric profile on day 374. In this later spectra the narrow H feature is redshifted with-respect-to the intermediate component, this has been seen in a number of Type IIn spectra such as SN 1997ab, 1997eg & the hybrid Type Ia/IIn SN 2002ic (Kotak et al. 2004). This is generally attributed to self-absorption in the intermediate component which preferentially attenuates the red wing of the profile (Salamanca et al. 1998). A better measurement of the shock velocity is therefore the velocity of the blue edge of the profile at zero intensity, which is 2850 200 . The luminosities inferred from the narrow line intensities at day 86 agree well with those derived by Aldering et al., with a significant decline in the luminosities derived from the narrow component from 1.61040 ergs-1 to 1.81039 ergs-1 by day 374.
Other, less dramatic features in the spectra comprise a broad feature at 8500 Å, probably a blend of the Ca ii infrared triplet with O i 8446. There is a weak, broad feature centered on 7300Å which, depending on the SN type, can be identified as either [Ca ii] or [Fe ii], with the latter being typically present in the late-time spectra of SNe Ia. The [Ca ii] lines however, are typically observed in the spectra of Type IIn and Ib/c SNe at 100 d.
4 SN 2005gj: Properties of the unshocked CSM
These narrow P-Cygni features which are commonly found amongst Type IIn, are thought to represent the outflow of unshocked CSM surrounding the SN event. As such, it provides insight into the environment prior to the SN explosion and on the wind properties of the SN progenitor itself. Stellar wind terminal velocities, v∞, are usually measured from the blue edge of strong resonance lines (vedge). Unfortunately, there are no such resonance lines in the optical, and so we will use the Balmer and He i lines to estimate this velocity from their absorption components. As these lines are not saturated, vedge is likely to underestimate the terminal velocity (Prinja et al. 1990). From the H narrow absorption feature, we find a vedge of 295 at 86d with an additional component at 120 whereas the component at 374d has an intermediate velocity of 190 . The H feature at day 86 gives velocities consistent with those found from H, however the bluer component of the He i profile appears at a lower velocity with a maximum vedge of 160 .
We can attempt to derive an estimate of the mass-loss rate from the H feature. Following Salamanca et al. (1998), where, is an efficiency factor that peaks at 0.1. L is the luminosity of the intermediate component, vw is the wind velocity and vs is the shocked CSM velocity. At day 86, this implies Ṁ = 6.4 and 2.6 M⊙ yr-1 from the high (295 ) and low (120 ) velocity components. At day 374, the derived Ṁ is 1.7 M⊙ yr-1 using vw = 190 and vs = 2850 , one should note that the shock velocity is a little less certain in this case (see Sect. 3). These are very large mass-loss rates but are typical of those derived from the H luminosity in supernovae which show strong interaction between the ejecta and CSM (e.g. SNe 1997ab, 2002ic Salamanca et al. 1998; Kotak et al. 2004). However, Kotak et al. found that mass-loss rates derived from dust measurements in the infrared are a magnitude lower. A similar observation can be made by comparing the mass-loss rates of SN 2005gj derived here and that of Prieto et al. from x-ray luminosities. Several caveats must be borne in mind when estimating mass loss rates via H profiles. Two of the most serious shortfalls involve the unknown ionisation conditions and uncertainties in . Realistic constraints can only be derived from detailed modelling which is beyond the scope of this work.

5 Discussion
SN 2005gj has been compared to the prototype for the hybrid Type Ia/IIn objects, SN 2002ic (Aldering et al. 2006). SN 2002ic was initially classified as a Type Ia, due to the presence of S ii lines and a blue shifted absorption feature of Si ii 6335 Å, but was quickly reclassified as a hybrid Type Ia/IIn due to the presence of multi-component Balmer lines signifying interaction with the surrounding circumstellar medium (Hamuy et al. 2003). This was an exciting discovery as the presence of circumstellar hydrogen in the spectra of a type Ia supernovae would shed light on the nature of Type Ia progenitors. One scenario put forward by Hamuy et al. is that the dense CSM could represent mass-loss from an asymptotic-giant-branch (AGB) star. Unfortunately, the true classification and interpretation of SN 2002ic remains under debate. In particular, Benetti et al. (2006) argue that it can equally well be compared to a core-collapse SN, such as the type Ic SN 2004aw. This comparison is most convincing at late epochs, in fact the resemblance of SN 2002ic to type IIn SNe had been noted earlier (e.g. Hamuy et al. 2003).
In spite of the H feature indicating CSM interaction, the early time optical spectra of SN 2002ic were undeniably Ia-like (see Fig. 3 Hamuy et al. 2003). Aldering et al. (2006) & Prieto et al. (2007) argue that SN 2005gj could be compared to the overluminous Type Ia, SN 1991T ‘diluted’ by the presence of significant CSM. However, the typical Ia spectral features due to S ii and Si ii which formed the crux of the Ia-evidence for SN 2002ic, are barely discernible in the spectra of SN 2005gj. They attribute this to stronger interaction of the SN 2005gj with the CSM than for SN 2002ic, arguing that this claim is supported by its broader light curve and higher H luminosities.
On the basis of the data presented here, we cannot verify or exclude the type Ia identification of SN 2005gj. However, we present an alternative scenario that is consistent with the observations. We focus our attention on the double absorption troughs seen in the day 86 spectrum. Only in one other SN spectra, SN 1998S, have double absorption troughs been dectected (Bowen et al. 2000; Fassia et al. 2001). However the shape of the lines differ significantly. In SN 1998S a narrow P-Cygni profile of 50 is superimposed on a broad, shallow absorption profile (Bowen et al. 2000, see Fig. 8). Additionally, this absorption decreases in relative intensity from lower to higher Balmer lines, suggestive of an optical depth dependence that is inconsistent with the SN 2005gj spectra. Chugai et al. (2002) invoke several mechanisms that could accelerate the circumstellar gas around SN 1998S. These models have been tailored to match the early-time spectra of SN 1998S and it is difficult to see how these might be tailored to the significantly later epochs of our data. This type of test may provide some insight but is beyond the scope of this letter.
Here we would like to stress the likeness of the profiles in SN 2005gj with another stellar object: Luminous Blue Variables. Multiple-absorption component H profiles have been detected in many LBVs, viz AG Carinae, R127, R81, HD160529, R66, & P-Cygni (Wolf et al. 1981; Stahl et al. 1983, 1983a, 2001, 2003; Leitherer et al. 1994). Fig. 3 shows several examples of the H profiles of LBVs gleaned from the literature. In LBVs these multiple-absorption component profiles signify their history of episodic mass-loss events. Vink & de Koter (2002) interpreted the variable mass-loss and wind velocity behaviour of LBVs as being due to a change in the ionization of the dominant wind driving ion Fe (wind bistability). This mechanism was also invoked to explain the variations in the radio lightcurves of transitional SNe (Kotak & Vink 2006). However, regardless of the mechanism the resemblance of the double-troughed LBV H profiles to that of SN 2005gj remains.
An interesting hydrodynamical simulation by van Marle et al. (2007) shows the evolution of CSM around a 60M⊙ star as it evolves from main-sequence to core-collapse via an LBV and WR phase. This simulation shows the formation of multiple absorption components from CSM shells formed by a fast WR wind running into an LBV shell. However these multiple shells occur in the very early stage of the WR-lifetime and hence if such a scenario was implied for SN 2005gj, its WR-phase would have been short-lived.
While the morphological resemblance of the line profiles observed in SN 2005gj and in LBVs is impressive enough, an even more compelling similarity is that of LBV wind velocities with those derived from the absorption components of SN 2005gj. LBV velocities lie in the 50–300 range, in strikingly good agreement with those derived from SN 2005gj (Table 1), which are larger than those observed in AGB winds (10 ) and red-supergiant winds and much lower than typical WR-star winds. Typical timescales of S Doradus mass-loss events in LBVs are on the scale of years up to 100 yrs (van Genderen 2001). From a simple calculation we can determine the timescales of the profile variations detected in SN 2005gj. Using an intermediate ejecta velocity of 22500 , a time variation of 288 days and an edge velocity of 300 we get Pw=Rejecta/vedge yrs. Thus the timescales associated with mass-loss events in LBV and SN progenitors are consistent. Note the 60 yr timescale is only an upper limit as we have not obtained a well-sampled temporal dataset of high-resolution spectra. Hence the variations are likely to be on shorter timescales still consistent with S Doradus variations. Even the change into a single absorption component (374 d) mimics the behaviour of LBVs such as AG Car which show similar variations on timescales of years (Fig. 3).
For SN 2005gj the line profiles, wind velocities and wind periodicity are remarkably reminiscent of LBVs and provide significant support for a direct link between supernovae and luminous blue variables. This may have a huge impact on our understanding of massive star evolution since current theory predicts that LBVs, which are in a short-term, intermediary phase of evolution, should not undergo core-collapse.
6 Acknowledgements
The authors acknowledge fruitful discussions with L. Dessart & N. Langer.
References
- Aldering et al. (2006) Aldering, G., Antilogus, P., Bailey, S., & et al., 2006, ApJ, 650, 510
- Benetti et al. (2006) Benetti, S., Cappellaro, E., Turatto, M., & et al., 2006, ApJL, 2, 129
- Bowen et al. (2000) Bowen, D. V., Roth, K. C., Meyer, D. M. & Blades, J. C. 2000, ApJL, 536, 225
- Chugai et al. (2002) Chugai, N. N., Blinnikov, S. I., Fassia, A., & et al., 2002, MNRAS, 330, 473
- Eldridge & Vink (2006) Eldridge, J.J., Vink, J.S., 2006, A&A, 452, 295
- Fassia et al. (2001) Fassia, A., Meikle, W. P. S., Chugai, N. N., & et al., 2001, MNRAS, 325, 907
- Foley et al. (2007) Foley, R.J., Smith, N., Ganeshalingam, M., & et al., 2007, ApJ, 657, L105
- Gal-Yam et al. (2007) Gal-Yam, A., & et al., 2007, ApJ, 656, 372
- Hamuy et al. (2003) Hamuy, M., Phillips, M. M., Suntzeff, N. B., & et al., 2003, Nature, 424, 651
- Humphreys & Davidson (1994) Humphreys, R.M., & Davidson, K., 1994, PASP, 106, 1025
- Kotak et al. (2004) Kotak, R., Meikle, W. P. S., Adamson, A., & Leggett, S. K., 2004, MNRAS, 354, L13
- Kotak & Vink (2006) Kotak, R. & Vink, J.S., 2006, A&A, 460, L5
- Langer et al. (1994) Langer, N., Hamann, W-R., Lennon, M., & et al., 1994, A&A, 290, 819
- Leitherer et al. (1994) Leitherer, C., & et al., 1994, ApJL, 428, 292
- Meynet & Maeder (2003) Meynet, G., Maeder, A., 2003, A&A, 404, 975
- Nakano et al. (2006) Nakano, S., Itagaki, K., Puckett, T., & Gorelli, R., 2006, Cent. Bur. Electron. Tel., 666, 1
- Pastorello et al. (2007) Pastorello, A., Smartt, S. J., Mattila, S., & et al., 2007, Nature, 447, 829
- Prieto et al. (2007) Prieto, J. L., Garnavich, P. M., Phillips, M. M., & et al., 2007, AJ, submitted
- Prinja et al. (1990) Prinja, R. K., Barlow, M. J., & Howarth, O. D., 1990, ApJ, 361, 607
- Salamanca et al. (1998) Salamanca, I., Cid-Fernandes, R., Tenorio-Tagle, G., & et al., 1998, MNRAS, 300, L17
- Schlegel (1990) Schlegel, E.M., 1990, MNRAS, 244, 269
- Smith (2007a) Smith, N., 2007a, AJ, 133, 1034
- Smith et al. (2007b) Smith, N., Li, W., Foley, R.J, & et al., 2007b, ApJ, 666, 1116
- Stahl et al. (1983) Stahl, O., Wolf, B., Klare, G., & et al., 1983, A&A, 127, 49
- Stahl et al. (1983a) Stahl, O., Wolf, B., Zickgraf, F.-J, & et al., A&A, 120, 287
- Stahl et al. (2001) Stahl, O., Jankovics, I., Kovács, J., & et al., 2001, A&A, 375, 54
- Stahl et al. (2003) Stahl, O., Gäng, T., Sterken, C. & et al., B, 2003, A&A, 400, 279
- Wolf et al. (1981) Wolf, B., Stahl, O., de Groot, M.J.H & Sterken, C., 1981, A&A, 99, 351
- van Genderen (2001) van Genderen, A.M., 2001, A&A, 366, 508
- van Marle et al. (2007) van Marle, A. J., Langer, N., & García-Segura, G., 2007, A&A, 469, 948
- Vink & de Koter (2002) Vink, J.S. & de Koter, J.S., 2002, A&A, 393, 543