The radio expansion and brightening of the very young supernova remnant G1903
Abstract
Recent radio observations of the small Galactic supernova remnant G1903 made at 4.86 GHz with the VLA are presented, and compared with earlier observations at 1.49 GHz which have a comparable resolution ( arcsec2). These show that the radio emission from this remnant has expanded significantly, by about 15 per cent over 23 years, with a current outer diameter of arcsec. This expansion confirms that G1903 is the youngest Galactic remnant yet identified, only about 150 years old at most. Recent, lower resolution, 1.43-GHz observations are also discussed, and the integrated flux densities from these and the 4.86-GHz observations are compared with earlier results. This shows that the integrated flux density of G1903 has been increasing recently.
keywords:
supernova remnants – ISM: individual: G1903 – radio continuum: ISM1 Introduction
The small Galactic ‘shell’ type supernova remnant (SNR) G1903 was identified by Green & Gull (1984), from Very Large Array (VLA) observations of a sample of Galactic radio sources. It was revealed as a small limb-brightened shell, brighter in the north, only just over 1 arcmin in diameter, and is the smallest catalogued Galactic SNR (Green 2004111See also: http://www.mrao.cam.ac.uk/surveys/snrs/ for an updated version (from 2006 April).). Although its distance was not known at the time of its identification, it was clear that it must be a young SNR, due to its small physical size (e.g. even at distance as large as 17 kpc – i.e. twice the distance to the Galactic Centre – its physical diameter would be pc, which is comparable to that of the remnant of Tycho’s SN of ad1572). As such G1903 is one of few ‘young but distant’ SNRs, which are missing from current catalogues, due to selection effects (e.g. Green 2005), but perhaps also indicating a true deficit (The et al., 2006). Searches for these missing young remnants have had limited success (see Green & Gull 1984; Helfand et al. 1984; Green 1985, 1989; Sramek et al. 1992; Misanovic, Cram & Green 2002, see also Saikia et al. 2004).
There are few published observations of G1903 in the literature. VLA images at 4.9-GHz and 1.5-GHz (from observations made in 1985) are presented in Green & Gull (1984) and Green (2004) respectively. Gray (1994a) presents MOST observations at 843 MHz, but these barely resolve the remnant. Nord et al. (2004) and Yusef-Zadeh, Hewitt & Cotton (2004) present VLA observations, at 330 MHz and 1.5 GHz respectively, but of limited quality or resolution. G1903 has also been detected in X-rays, with ASCA as AX J1748.72709 (Sakano et al. 2002).
| 1985 observations | 2008 observations | |
|---|---|---|
| date | 1985 April 16 | 2008 March 12 |
| VLA array | B | C |
| frequency | 1.49 GHz | 4.86 GHz |
| time on source | 25 min | 29 min |
| primary calibrator | 3C286 | 3C286 |
| assumed flux density | 14.70 Jy | 7.49 Jy |
| secondary calibrator | B1829106 | J1751251 |
| derived flux density | 0.927 Jy | 0.569 Jy |


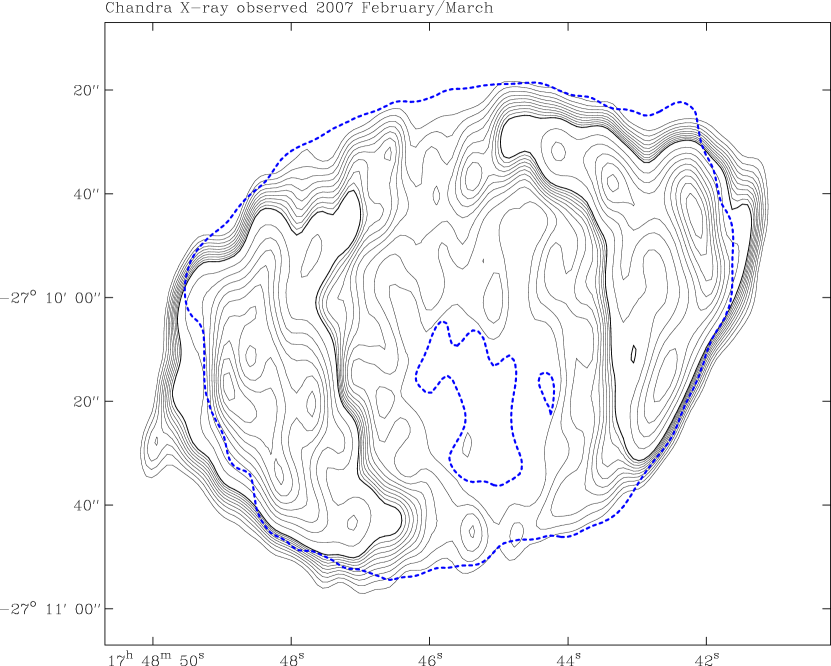
Recently Chandra observations (Reynolds et al. 2008, hereafter Paper I) have revealed that G1903 is one of the few shell SNRs that have line-free X-ray emission, dominated by synchrotron rather than thermal emission. The size of the X-ray emission observed by Chandra was, unusually, significantly larger than the then published radio observations, which were interpreted in Paper I as requiring a large expansion rate – per cent over 23 years – which implies that G1903 is a very young SNR. Here we present recent new radio observations made with the VLA, which in comparison with previous observations at a similar resolution, but a different frequency, confirm the large expansion rate, and hence youth of this remnant. We also discuss the temporal evolution of the flux density of G1903, and conclude that it has been brightening over recent decades.
2 Observations
G1903 was recently observed with the VLA at 4.86 GHz in the C-array configuration. The resolution of these observations closely match those of VLA observations made in 1985 at 1.49 GHz in the B-array configuration (results from which are shown in Green 2004). Details of these observations are given in Table 1. The new observations were processed using standard techniques in (classic) aips (see Bridle & Greisen 1994). Obviously corrupted data were flagged, the flux scale calibration was based on observations of 3C286, and antenna-based amplitude and phase calibrations from observations of calibrator source(s) made nearby in time were applied. The earlier 1.49-GHz observations were also reprocessed. Although the time spent observing G1903 was similar in each observation, the details of the -coverage for the two observations are different, due to differences in LST coverage, missing antennas, and flagging of bad data. Consequently the synthesised beams are slightly different. For expansion studies comparison images were made at a matched resolution, see Fig. 1. These images show large expansion of the radio emission from G1903, which is discussed further in Section 3.1. The positional alignment of these images was checked from the apparent position of a compact source that is about 1.4 arcmin north of the centre of the remnant. The positions of this source were found to be in agreement to better than 0.4 arcsec, which is small compared with the large changes seen between the 1985 and 2008 image of G1903. It should be noted, however, the earlier 1.49-GHz observations probably do not have sufficient short baselines to be able to fully image the largest scale emission from G1903. The VLA ‘Observational Status Summary’222Available via http://www.vla.nrao.edu/ lists the largest angular scale that ‘can be imaged reasonably well’ in a full synthesis as 2 arcmin for 1.49 GHz observations in the B-array, and notes that this value should be halved for single snapshot observations. Thus, given the angular size of G1903 is over 1 arcmin, the largest scale structure may not be fully imaged in the 1.49-GHz observations. For the 4.86-GHz C-array observations the largest angular scale well imaged with a full synthesis is 5 arcmin – since the C-array is not an exactly scaled version of B-array, but has better small baseline coverage – so even halving this for snapshot observations, the full emission from G1903 should be well imaged. Indeed, from Fig.1, the 1.49-GHz shows extended negative artefacts, which are features of the limited small baseline coverage. The 4.86-GHz image is also better than the 1.49-GHz image, in terms of its sensitivity: the nominal noise on these images, from the r.m.s. away from bright emission, are about 0.038 and 0.012 mJy beam-1 at 1.49 and 4.86 GHz respectively.
Given the problem with missing large-scale emission in the 1.49 GHz observations, we also made some short 1.43-GHz observations of G1903 in the same observation run as the 4.86-GHz observations, in order to investigate temporal variations in the flux density of G1903. These consisted of two short ( min) scans of G1903, together with adjacent calibration observations of 3C286 to set the overall flux density scale (with an assumed flux density of 14.7 Jy), and of the nearby secondary calibrator J1751253 (for which a flux density of 1.18 Jy was derived). The results from these observations are discussed below in Section 3.2.

3 Discussion
3.1 Expansion and Structure
From Fig. 1 it is clear that there is a large expansion of the radio emission seen from G1903 between 1985 and 2008. To quantify this, radial profiles of the emission from each image were constructed – see Fig. 2 – averaging over all angles, from a central position which was adjusted to maximise the peak of the radial profile from the 2008 image. (This position is , , J2000.0, which close to the geometrical centre of the remnant.) A simple re-scaling of the 1985 radial profile indicates an average expansion of 15 per cent between 1985 and 2008, i.e. 0.65 per cent yr-1, is required to match the positions of the peaks of the radial profiles (Fig. 2). This expansion rate is biased towards that appropriate to the brighter N and NE portions of the remnant, since the radial profiles are weighted by intensity.
This result confirms that a significant expansion is needed to match the extent of the X-ray emission from the recent Chandra observations to older radio observations, as found in Paper I. Assuming free expansion, this implies an age of 150 years for G1903, which makes this the youngest known Galactic SNR (but also see Morris et al. 2006 and Renaud et al. 2006 for other possible very young SNRs which have been reported). As the remnant will have undergone some deceleration, this age is an upper limit. Very high X-ray absorption (Paper I) suggests that G1903 is not much closer than the Galactic centre, while the very high expansion would indicate a very large velocity if it were much further away. Following Paper I, we adopt a nominal distance of 8.5 kpc, which for an age of years and a outer radio diameter of 92 arcsec corresponds to a mean expansion speed of km s-1.
The interpretation of the radial profiles in simple terms of just a radial scaling is, however, complicated by a variety of effects. First, recall that the -coverage of these observations differ, particularly – as noted above – that the 1.49-GHz observations may not well image the large scale emission from G1903. Second, the images are at different frequencies, so that any change in spectral index across the remnant would appear as a relative change in emission between the epochs (for example, a spectral index change of 0.05 would correspond to a relative intensity change of 6 per cent between 1.49 and 4.86 GHz). Third, there are real changes in the emission over the 23 years between the observations, so the changes seen are not just simple, self-similar expansion. In the case of G1903, we are not observing the expansion of distinct features, such as the radio knots in Cas A (see Anderson & Rudnick 1995), or the well defined outer shock of Tycho’s SNR (e.g. Tan & Gull 1985; Reynoso et al. 1997). From Fig. 1 there is evidence for changes in the shape and brightness of the radio emission between 1985 and 2008. This is particularly noticeable in the NW, where there is a clear extension outside the brighter rim of emission from the remnant in the 2008 image (labelled ‘NW’ in Fig. 1). There is some indication of extension in the 1985 image, but at a much lower level than in the 2008 image. The azimuth range of this outer extension corresponds closely to where the X-ray emission shows a bright ‘ear’ in this region (Paper I, see Fig. 3 above). In the E there is also an faint extension outside the main emission particularly in the 2008 image (labelled ‘E’), but over a much smaller azimuth range than the outer extension in the NW. Also, the ridge line of the emission in the NE clearly differs between the epochs, being concave (w.r.t. to the centre of the remnant) in the 1985 image, but slightly convex in the 2008 image (labelled ‘R’). If extrapolated, this apparently points towards the faint E extension, which corresponds to the northern edge of the X-ray emission outside the main rim in the E. Also, the peaks of the bright ridge of the radio emission change between the two epochs (e.g. the peak in the NE in the 1985 image splits into two peaks in the 2008 image).
From Figs 1 and 3, there are striking differences between the overall structure of G1903 at radio and X-ray wavelengths, which may reflect differences in particle acceleration rates or efficiencies at different locations. Although the outline of the remnant is very nearly circular in the radio, the brightness of the radio emission varies considerably in azimuth (with the bright NE rim being about fifty times brighter than the weakest emission in the S). If a local density gradient were invoked to explain the large N–S difference in radio brightness, then it is not obvious why the remnant maintains such a circular outline. On the other hand, the X-ray emission of the remnant shows a bipolar structure, brightest in the E and W, which suggests the influence of a large scale magnetic field is important for the efficiency of accelerating the particles responsible for the X-ray emission, but not for the those producing the radio emission. The brightest emission in the E and particularly in the NW corresponds to relatively faint radio emission. In the NW this is the outer extension seen in the 2008 radio image, which presumably corresponds to the region of the outer shock with the highest velocity.
| observation | reference | notes | |||
| / MHz | / Jy | / Jy | date(s) | ||
| 332 | 2.84 | 0.10 | 1986–1989 | LaRosa et al. (2000) | |
| 408 | 1.18 | 0.07 | 1969–1971 | Clark & Crawford (1974) | a |
| 843 | 1.0 | 0.05 | 1985–1991 | Gray (1994a) | b |
| 843 | 0.986 | 0.031 | 1997–2007? | Murphy et al. (2007) | |
| 1400 | 0.748 | 0.038 | 1993–1996 | Condon et al. (1998) | c,d |
| 1425 | 0.935 | 0.047 | 2008 | this work | c |
| 2695 | 0.440 | 0.044 | 1981–1984? | Reich et al. (1984) | |
| 4850 | 0.236 | 0.016 | 1990 | Griffith et al. (1994) | e |
| 4860 | 0.437 | 0.022 | 2008 | this work | c |
| 4875 | 0.20 | 0.05 | 1974–1975 | Altenhoff et al. (1979) | f |
| 5000 | 0.20 | 0.03 | 1975? | Caswell et al. (1975) | g |
Notes:
(a) The listed flux density error is based on the quoted 5.4 per cent
statistical flux scale (for 1 Jy sources), plus 2 per cent due to possible
systematic declination variations, added in quadrature.
(b) No flux density error is given, so a nominal value of 5 per cent is used; the observation dates are from Gray (1994b).
(c) These flux densities were obtained from integrations of images, from within a polygon drawn around the remnant after removing a twisted plane fitted to pixels lying around the edge of the polygon (see Green 2007). The integrated flux density was found to vary by less than one per cent when a variety of polygons were used, but to be cautious we assume a statistical error of 5 per cent.
(d) The NVSS survey. G1903 is also listed in the NVSS source catalogue (Version 2.17): arcsec2 in extent, with Jy.
(e) The flux density is from the Vizier version (see Ochsenbein, Bauer & Marcout 2000) of the PMN Tropical zone catalogue allowing for a general Gaussian width fit (see: Griffith & Wright 1993). The published flux density from a fixed width fit is Jy.
(f) The flux densities of the sources in this survey are quoted to the nearest 0.1 Jy, so a flux density error of 0.05 Jy is used.
(g) The flux density error is from adding quoted errors of 10 per cent for uncorrected gain variations, 10 per cent for positional errors (which would lead to underestimates of the true value) and noise of 0.01 Jy, added in quadrature.
3.2 Brightening
Given that G1903 is such an apparently young SNR, then an obvious question is how is its radio flux density evolving with time? Table 2 lists the available flux densities for G1903 from the literature, and from the new observations presented here. (There is also a flux density for G1903 at 365 MHz from the Texas survey, Douglas et al. 1996, but this has not been listed as it is not expected that it will represent the total flux of G1903, which is resolved by the instrument.) The available observations have been made with a variety of instruments and resolutions, and may not be on consistent flux density scales, making direct comparisons difficult. Nevertheless, there is evidence that the flux density of G1903 has been increasing over recent decades.
-
1.
Gray (1994a) noted that his 843-MHz flux density was larger than expected from extrapolation between the earlier flux densities at 408 MHz and 5.0 GHz. Gray suggested that this discrepancy was due to the fact that the earlier 408-MHz and 5.0-GHz flux densities were derived assuming the source was unresolved by the arcmin beams of both sets of observations, and so the observed peak flux density would underestimate the integrated flux density. However, even if the source were 1.2 arcmin in extent, as it was when identified by Green & Gull (1984), this effect would be less than about 10 per cent for an arcmin beam, which is not sufficient to explain this discrepancy. Also Gray noted that recent – i.e. presumably around 1994 – 4.85-GHz observations (from ‘Haynes et al. in preparation’, which we have not been able to identify in the literature) give a flux density of 0.3 Jy for G1903, which is above the earlier 5.0-GHz flux density reported by Caswell, Haynes & Clark (1975).
-
2.
The 332-MHz flux density is considerably larger than the earlier value at 408 MHz (Clark & Crawford). (Note that LaRosa et al. quote a 1.4-GHz flux density from NVSS with an implausibly large error, i.e. Jy, and hence also give very large error in their derived 332 MHz to 1.4 GHz spectral index, i.e. .)
-
3.
The integrated flux density of G1903 at 4.86 GHz from the observations described above is significantly larger than any of the values available in the literature at similar frequencies, even bearing in mind the large errors in some of the earlier flux densities at GHz, and the possibility of systematic differences in the flux density scales between the different observations.
-
4.
The 1.43-GHz flux density from our recent observations is about larger than the previously available value at 1.4 GHz from 13 years earlier, by a factor of , which implies a flux density increase of about per cent yr-1.
Combining the integrated flux densities from the contemporaneous, new 1.45 and 4.86-GHz observations gives a spectral index, , for the radio emission from G1903 (here defined in the sense that flux density scales with frequency as ) of . The error in this spectral index is using the nominal 5 per cent uncertainties in the individual flux densities, not including any possible systematic uncertainties in the relative flux density scales of the observations. However, is it difficult to reconcile this spectral index with all of the other observations in the literature. If G1903 is indeed brightening, then the spectral index between 332 MHz and 1.4 GHz would be larger than the value of obtained by LaRosa et al., as the 1.40-GHz was obtained after the 332-MHz data. Also, the two 843-MHz flux densities do not show obvious evidence for brightening. Excluding the 332-MHz flux density, it is possible to obtain a reasonable fit of a spectrum with brightening at per cent yr-1 to the available flux densities for G1903. The model fits reported in Paper I assumed a flux density at 1 GHz of 0.9 Jy. Increasing this to 1.2 Jy results in slightly steeper values of the radio-to-X-ray spectral index. However, the new values of both the spectral index and the rolloff frequency are still consistent with the earlier values at the 90 per cent confidence level.
The fact that G1903 is brightening is not unexpected if it is indeed only a hundred years or so old. Radio observations of supernovae show brightening emission over time-scales of up to a year or so after the optical SN due to decreasing opacity. Thereafter these radio supernovae (RSN) show steady decline in emission (see, for example, Weiler et al. 1986, 2002). Searches for radio emission from older RSN, up to about 80 years old (see Eck, Cowan & Branch 2002) mostly provide upper limits for the radio emission, indicating that the luminosities of these older RSNe are less than that of the brightest known Galactic SNR. Thus, in order to evolve to match the observed properties of Galactic SNRs, it is expected that radio emission from young SNRs will brighten, probably on time-scales of about a century, when they have swept up sufficient interstellar medium (e.g. Gull 1973; Cowsik & Sarkar 1984). (SN1987A is brightening at radio wavelengths, as it interacts with ring of material very near the explosion; Manchester et al. 2002.) For a current angular size of arcsec, and a 1-GHz flux density of 1.2 Jy, the surface brightness of G1903 is W m-2Hz-1sr-1. This means that G1903 is brighter than the remnant of the SN of ad 1006, somewhat fainter than the remnants of Tycho’s and Kepler’s SNe of ad 1572 and 1604, but is considerably fainter than Cas A, which is otherwise the youngest (approximately 300 hundred years old) and brightest known Galactic SNR (e.g. Green 2004).
Predictions can be made for brightness increases based on simple assumptions about particle acceleration and possible magnetic-field amplification. For power-law behaviour of source radius with time, and of ejecta and ambient density with radius, power law time dependences can be found for the relativistic particle energy density (assuming a constant efficiency, i.e. ), magnetic field (assuming either flux freezing upstream or amplification with a different efficiency), and therefore the synchrotron luminosity: . Once substantial deceleration has begun (i.e. once a reverse shock has formed, within a few years of the explosion), almost all models decrease in luminosity with time. For constant ambient density the drop is slowest; for constant ambient magnetic field as well, the luminosity can actually rise, roughly as for the type Ia SN model of Chevalier (1982); all other cases drop with time. While these are simplistic estimates, they do demonstrate that a growing radio flux density requires special conditions.
If G1.9+0.3 is now yr old, the observed flux increase by a factor of 1.25 over 13 years gives , far larger than the largest estimates above. While other explanations cannot be ruled out, the most natural explanation is that the efficiency with which shock energy goes into relativistic electrons and/or magnetic field must be increasing with time.
4 Conclusions
Comparison of VLA observations made in 1985 and 2008 confirm that G1903 has a large expansion rate of per cent yr-1. This means that this is a very young supernova remnant, at most only 150 years old, and hence the youngest known Galactic supernova remnant. There is also evidence that the this remnant has been brightening over the last few decades at radio wavelengths, suggesting that the efficiency of particle acceleration and/or magnetic-field amplification has been increasing. Further high resolution, multi-epoch radio observations are required to study G1903’s dynamics and structure in detail, and monitor the temporal evolution of its flux density.
Acknowledgements
The National Radio Astronomy Observatory is a facility of the National Science Foundation operated under cooperative agreement by Associated Universities, Inc. We are very grateful to the NRAO for the prompt scheduling of the ‘Exploratory Time’ proposal for the new VLA observations presented here. This research has made use of NASA’s Astrophysics Data System Bibliographic Services.
References
- Altenhoff et al. (1979) Altenhoff W. J., Downes D., Pauls T., Schraml J., 1979, A&AS, 35, 23
- Anderson & Rudnick (1995) Anderson M. C., Rudnick L., 1995, ApJ, 441, 307
-
Bridle & Greisen (1994)
Bridle A.H., Greisen E.W., 1994, AIPS Memo 87. Available from
http://www.aoc.nrao.edu/aips/ - Caswell, Haynes & Clark (1975) Caswell J. L., Haynes R. F., Clark D. H., 1975, AuJPh, 28, 633
- Chevalier (1982) Chevalier R. A., 1982, ApJ, 258, 790
- Clark & Crawford (1974) Clark D. H., Crawford D. F., 1974, AuJPh, 27, 713
- Condon et al. (1998) Condon J. J., Cotton W. D., Greisen E. W., Yin Q. F., Perley R. A., Taylor G. B., Broderick J. J., 1998, AJ, 115, 1693
- Cowsik & Sarkar (1984) Cowsik R., Sarkar S., 1984, MNRAS, 207, 745
- Douglas et al. (1996) Douglas J. N., Bash F. N., Bozyan F. A., Torrence G. W., Wolfe C., 1996, AJ, 111, 1945
- Eck, Cowan & Branch (2002) Eck C. R., Cowan J. J., Branch D., 2002, ApJ, 573, 306
- Gray (1994a) Gray A. D., 1994a, MNRAS, 270, 835
- Gray (1994b) Gray A. D., 1994b, PhD thesis, University of Sydney
- Green (1985) Green D. A., 1985, MNRAS, 216, 691
- Green (1989) Green D. A., 1989, AJ, 98, 1358
- Green (2004) Green D. A., 2004, BASI, 32, 335
- Green (2005) Green D. A., 2005, MmSAI, 76, 534
- Green (2007) Green D. A., 2007, BASI, 35, 77
- Green & Gull (1984) Green D. A., Gull S. F., 1984, Natur, 312, 527
- Griffith & Wright (1993) Griffith M. R., Wright A. E., 1993, AJ, 105, 1666
- Griffith et al. (1994) Griffith M. R., Wright A. E., Burke B. F., Ekers R. D., 1994, ApJS, 90, 179
- Gull (1973) Gull S. F., 1973, MNRAS, 161, 47
- Helfand et al. (1984) Helfand D. J., Chance D., Becker R. H., White R. L., 1984, AJ, 89, 819
- LaRosa et al. (2000) LaRosa T. N., Kassim N. E., Lazio T. J. W., Hyman S. D., 2000, AJ, 119, 207
- Manchester et al. (2002) Manchester R. N., Gaensler B. M., Wheaton V. C., Staveley-Smith L., Tzioumis A. K., Bizunok N. S., Kesteven M. J., Reynolds J. E., 2002, PASA, 19, 207
- Misanovic, Cram & Green (2002) Misanovic Z., Cram L., Green A., 2002, MNRAS, 335, 114
- Morris et al. (2006) Morris P. W., Stolovy S., Wachter S., Noriega-Crespo A., Pannuti T. G., Hoard D. W., 2006, ApJ, 640, L179
- Murphy et al. (2007) Murphy T., Mauch T., Green A., Hunstead R. W., Piestrzynska B., Kels A. P., Sztajer P., 2007, MNRAS, 382, 382
- Nord et al. (2004) Nord M. E., Lazio T. J. W., Kassim N. E., Hyman S. D., LaRosa T. N., Brogan C. L., Duric N., 2004, AJ, 128, 1646
- Ochsenbein, Bauer & Marcout (2000) Ochsenbein F., Bauer P., Marcout J., 2000, A&AS, 143, 23
- Reich et al. (1984) Reich W., Fürst E., Haslam C. G. T., Steffen P., Reif K., 1984, A&AS, 58, 197
- Renaud et al. (2006) Renaud M., Paron S., Terrier R., Lebrun F., Dubner G., Giacani E., Bykov A. M., 2006, ApJ, 638, 220
- Reynolds et al. (2008) Reynolds S. P., Borkowski K. J., Green D. A., Hwang U., Harrus I., Petre R., 2008, ApJ, submitted (also arXiv:0803.1487)
- Reynoso et al. (1997) Reynoso E. M., Moffett D. A., Goss W. M., Dubner G. M., Dickel J. R., Reynolds S. P., Giacani E. B., 1997, ApJ, 491, 816
- Saikia et al. (2004) Saikia D. J., Thomasson P., Roy S., Pedlar A., Muxlow T. W. B., 2004, MNRAS, 354, 827
- Sakano et al. (2002) Sakano M., Koyama K., Murakami H., Maeda Y., Yamauchi S., 2002, ApJS, 138, 19
- Sramek et al. (1992) Sramek R. A., Cowan J. J., Roberts D. A., Goss W. M., Ekers R. D., 1992, AJ, 104, 704
- Tan & Gull (1985) Tan S. M., Gull S. F., 1985, MNRAS, 216, 949
- The et al. (2006) The L.-S., et al., 2006, A&A, 450, 1037
- Weiler et al. (1986) Weiler K. W., Sramek R. A., Panagia N., van der Hulst J. M., Salvati M., 1986, ApJ, 301, 790
- Weiler et al. (2002) Weiler K. W., Panagia N., Montes M. J., Sramek R. A., 2002, ARA&A, 40, 387
- Yusef-Zadeh, Hewitt & Cotton (2004) Yusef-Zadeh F., Hewitt J. W., Cotton W., 2004, ApJS, 155, 421