The Canadian Institute for Advanced Research, Toronto, Ontario M5G 1Z8, Canada
First pacs descriptionSecond pacs description Third pacs description
Fermi surface arcs and the infrared conductivity of underdoped YBa2Cu3O6.50
Abstract
We reanalyze the data on the in-plane far infrared conductivity of underdoped orthoII YBa2Cu3O6.50 (YBCO6.50) in terms of a model in which a pseudogap opens on part of the Fermi surface with the remaining ungaped piece proportional to the temperature. The motivation for our model comes from recent angle-resolved photoemission spectroscopy data in underdoped Bi2Sr2CaCu2O8+δ (Bi-2212), which have revealed the existence of arcs on the Fermi surface. We find the optical data to be consistent with arc formation. In addition we find some evidence that the electronic states lost below the pseudogap energy are recovered in the energy region immediately above it at least for temperatures near .
pacs:
74.72.-hpacs:
74.25.Gzpacs:
74.72.BkIn going from the overdoped side of the cuprate phase diagram to the underdoped side, a new phenomenon known generally as the formation of a pseudogap is seen[1]. The pseudogap manifests itself in many properties and generally has the signature of a decrease in the electronic density of state (DOS) around the Fermi energy. There is no consensus as to its exact microscopic origin. Some observations are consistent with a preformed pair model[2] with the pseudogap associated with the binding energy of the pairs at the pseudogap temperature and the superconducting temperature the point at which phases lock in and long range order results. Another influential model is a possible competing order such as d-density[3, 4, 5, 6, 7, 8] wave which set in at and coexists with the superconducting order parameter below . In this model it may be reasonable to expect two distinct gap scales and some recent data[9, 10] have pointed to this possibility.
In the absence of consensus on microscopic origin, phenomenological models have played an important role in understanding and correlating data. An example is the specific heat data[11, 12]. The observed trend from overdoped to underdoped can be understood [11, 12] over several families of cuprates by simply introducing a gap in the DOS which obeys a mean field temperature dependence. More recently, analysis of angle-resolve photoemission spectroscopy (ARPES) data have given a more detailed picture[13] of pseudogap formation on the Fermi surface as a function of temperature. A finite pseudogap first opens at but forms only in a region around the antinodal direction leaving an ungaped Fermi surface arc around the nodal direction of length proportional to the reduced temperature . Here we confine our attention to the normal state region (above ) and study how the formation of Fermi surface arcs modifies optical properties.
Optical conductivity measurements have given a wealth of information on electron dynamics in the cuprates. While early on the pseudogap was seen clearly as a real gap in the real part of the c-axis[14, 15] optical conductivity, its signature in the ab-plane data was less clear and largely confined to a general observation that the optical scattering rate seem to show an additional decrease with decreasing temperature at low frequency as compared with overdoped samples[16]. Only recently has the situation been further clarified when the real part of the optical self-energy was analyzed in more detail[17]. Underdoped samples show a characteristic evolution with decreasing temperature quite distinct from the overdoped case[18, 19, 20]. A hat like peak structure develops at an energy of the order of the pseudogap energy, clearly seen above a smooth structureless background. It was recognized that this easily identified[17] feature could be understood in a simple DOS model with a gap below and the missing states piled up in the energy region just above the pseudogap which we will refer to here as the recovery region. These modification of the DOS show up very directly in the real and imaginary part of the optical self-energy [21, 22, 23, 24].
Consider coupling to a single Einstein mode of energy . Without a pseudogap (constant electronic DOS) the optical scattering rate will be zero till after which it rises from zero according to the law [25]. With a pseudogap it will be zero till and rise after this according to [20]. On the other hand if a recovery region is included above to conserve electronic states, there will be additional scattering in the recovery region due to the extra available states. This will make rise more rapidly than it would have without the extra states. This rapid rise in translates into the formation of a logarithmic like structure in Kramers-Kronig transform. Monitoring the growth of this structure in the real part of the optical self-energy gives us a means to trace pseudogap formation as does the steepness of above the energy of the gap plus boson.
There have been many studies of the boson spectra of the cuprates as revealed by tunneling[26], ARPES[27] and optics[20, 28, 29, 30, 31, 32, 33] in which a spectral density function is recovered, where is a coupling constant between electrons and a boson and is the bosonic spectral density. For optimally and overdoped cases, coupling to the sharp resonance at an energy corresponding to the spin-1 collective mode measured in neutron scattering is seen. This resonance starts to exist above in the underdoped case and its intensity (area under the peak) increases with decreasing temperature. For the specific case of orthoII YBCO6.50 this has been studied by Hwang et al.[20].
In this paper we reanalyze the data on orthoII YBCO6.50 allowing for the opening of a pseudogap which covers more of the Fermi surface, as the temperature is lowered below . We ask whether or not the data is consistent with a linear decrease in the length of the remaining arcs as a function of the reduced temperature as it is seen in the ARPES data in underdoped Bi-2212[13]. Our analysis of the optical data proceeds through the optical scattering rate . For a system with an energy dependent self consistent electronic density of state which is related to the imaginary part of the Green’s function by the optical scattering rate can be written approximately[22] as
| (1) |
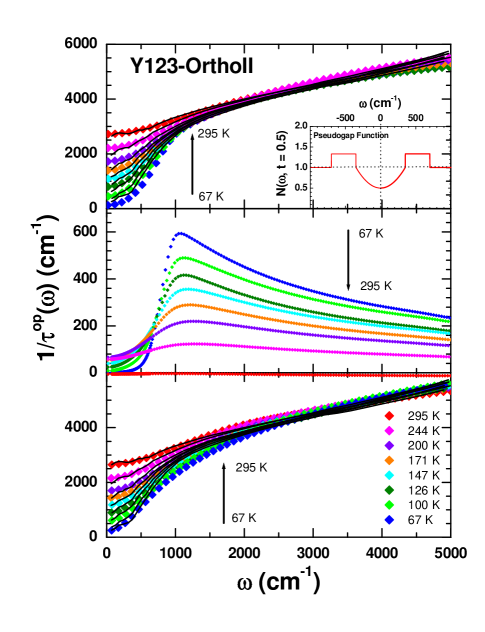
Here is the Bose-Einstein thermal distribution, the Fermi-Dirac with the inverse temperature and the chemical potential, and the electron-boson spectral density. In Eq. 1 is the symmetrized electronic density of states . Eq. 1 reduces properly to that of Shulga et al.[34] in the limit of a constant density of states. It further corresponds to the formula of Allen[35] at zero temperature. The data for at eight temperatures in the normal state of orthoII YBCO6.50 are reproduced[20] in Fig. 1 (top and bottom frames) as (dark) solid lines. In all cases the data is fit (solid diamonds of different colors as indicated in the figure) with an electron-boson spectral density consisting of a broad Millis-Monien-Pines (MMP) background[36] of the form , where is a coupling between spin fluctuation and charge carriers and is a typical spin fluctuation energy. In addition a sharp resonance peak modelled by (where is the area under the peak, is its center frequency, and is its width) is included and its position in energy fixed at 31 meV chosen to agree with the energy of the measured spin-1 resonance of inelastic neutron scattering[37]. In addition a pseudogap is included with cm-1 fixed from our previous analysis[20] and assumed temperature independent. The length of the remaining ungaped arc is modelled through the self consistent DOS which we take to be equal to for and for and 1 beyond this. The value of is temperature dependent and assumed to be proportional to the reduced temperature . This agrees with the idea that the arc closes linearly in reduced temperature as is lowered below the pseudogap temperature . Further the lost states below due to the opening of the pseudogap are taken to reappear above in the interval up to . The fitting parameters to the data are area under the resonance peak () and the background ().
The fits obtained are seen in the top frame of Fig. 1 and are seen to be excellent. They are better than the earlier fits obtained in ref. [20] where a pseudogap was included but without arcs and recovery region. These fits are reproduced in the lower frame and are clearly not as good. In particular, in the region around 1000 cm-1 the new fits capture the narrow range of variation with temperature observed in the data. This effect is a direct consequence of the temperature dependence assumed for the DOS which itself reflects the temperature dependence of the Fermi surface arcs. When the arcs become smaller with reducing normalized temperature more states are lost in the pseudogap region as a results of a reduction in the value of . But in our model for which is shown in the inset of the upper frame of Fig. 1, it is assumed that the lost states are to be found in the region between and so as to respect conservation of states in the electronic DOS. The existence of this recovery region directly leads to more scattering i.e. an increase in in this energy range than would be the case if no recovery occurred i.e. was equal to its background value of 1. This effect pushes up the curves more at low temperatures than at high temperature where the amount of extra states due to recovery is reduced and finally vanishes in our model at the pseudogap temperature . It is therefore through the effect on of the recovery region that we see in optics the arcs and their temperature dependence. The arcs have their greatest effects at low temperature as can be seen in the middle frame of Fig. 1 where we show the contribution to the optical scattering rate due to the recovery states in above . At high temperatures this contribution vanishes as becomes equal to 1 everywhere. We note that, with increasing away from , the effect of the recovery region in becomes small and we cease to be able to extract from the data any quantitative information on the arcs and on the recovery region above it.
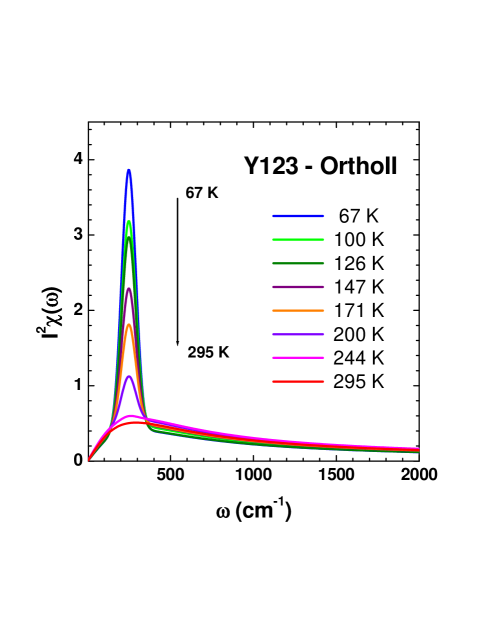
In Fig. 2 we show the results of our fits for the electron-boson spectral function as a function of frequency and temperature. At each temperature the background was allowed to vary as was the area under the resonance peak fixed at an energy of 31 meV[37]. We see that the peak disappears with increasing temperature and at 250 K and above only the background remains. Relative to the peak, the temperature dependence of the background is small.
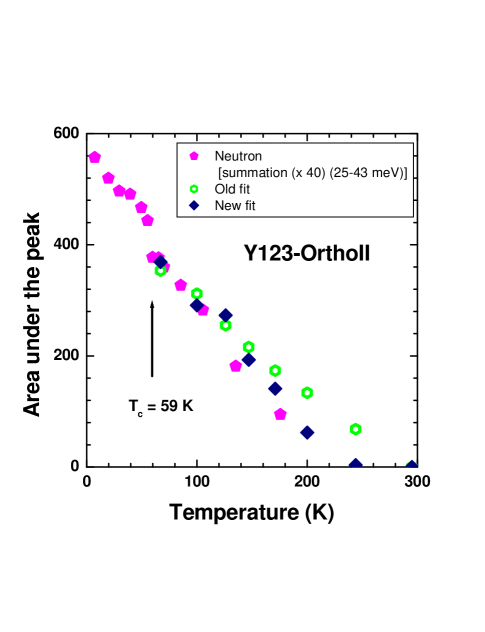
In Fig. 3 we show results for the area under the peak as a function of temperature above the superconducting 59 K i.e. in the normal state. The points are denoted by (blue) solid diamond, they are also compared with our previous results from optics (green)open hexagon[20] and with neutron results (purple) solid pentagon[37]. It is seen that the fit to the neutron data has improved as compared to our previous optically derived estimates.
Data on the optical scattering rate in orthoII YBCO6.50 show clear evidence for the formation of a pseudogap which opens at (the pseudogap temperature). We have used a model of the pseudogap with Fermi arcs with linear variation in reduced temperature as suggested in ARPES experiments on underdoped Bi-2212. The fraction of the Fermi surface which remains ungaped provides a finite but reduced value for the self consistent density of state at 0 with linear in . A quadratic dependence of in is assumed till after which point we have assumed there is a region of increased DOS which contains all the missing states so that by states are conserved. This is a reasonable assumption and certainly supported by our fit for near . At higher temperatures however, while the data remains consistent with the assumed model, details such as the extent in energy and exact amount of recovery could not be quantitatively pinned down. With this model we calculate the optical scattering time at several temperatures in the normal state with electron-boson spectral density consisting of an MMP background and resonance peak set at 31 meV to agree with the available inelastic neutron scattering data on the local magnetic susceptibility[37]. Two parameters, the amplitude of the background and the area under the resonance peak are varied to get a best least square fit to the data. The quality of the fit obtained in this way is considerably superior to an earlier fit also based on a pseudogap model but without recovery and Fermi surface arcs. We conclude that the data is more consistent with arcs than without. The effect of the arc shows up clearly in the region just above the main rise in scattering rate where all the curve bunch up together. This is properly captured in our fits while it is missing in the previous analysis. Also our new fits agree better with the neutron studies as to the temperature dependence of the area under the resonance peak which is one of the important parameter varied in our least square fit.
Acknowledgements.
This work has been supported by the Natural Science and Engineering Research Council of Canada(NSERC) and the Canadian Institute for Advanced Research (CIAR).References
- [1] \NameTimusk T. Statt B. \REVIEWRep. Prog. Phys. 62199961.
- [2] \NameEmery V. J. Kivelson S. A. \REVIEWNature (London) 3741995434.
- [3] \NameChakravarty S., Laughlin R. P., Morr D. K., Nayak C. \REVIEWPhys. Rev. B 632001094503.
- [4] \NameDora B., Virosztek A., Maki K. \REVIEWPhys. Rev. B 652002155119; \NameMaki K., Dora B., Kartsovnik M., Virosztek A., Korin-Hamzic B., Basletic M. \REVIEWPhys. Rev. Lett. 902003256402.
- [5] \NameBenfatto L. Sharapov S. \REVIEWLow Temp. Phys. 322006533.
- [6] \NameAristov D. N. Zeyher R. \REVIEWPhys. Rev. B 722005115118.
- [7] \NameKim W. Carbotte J. P. \REVIEWPhys. Rev. B 662002033104.
- [8] \NameKim W., Zhu J. X., Carbotte J. P., Ting C. S. \REVIEWPhys. Rev. B 652002064502.
- [9] \NameKrasnov V. M., Yurgens A., Winkler D., Delsing P., Claeson T. \REVIEWPhys. Rev. Lett. 8420005960.
- [10] \NameLe Tacon M., Sacuto A., Georges A., Kotliar G., Gallais Y., Colson D., Forget A. \REVIEWNature Physics 22006537.
- [11] \NameLoram J. W., Mirza K. A., Cooper J. R., Tallon J. L. \REVIEWJ. Phys. Chem. Solids 5919982091.
- [12] \NameLoram J. W., Luo J., Cooper J. R., Liang W. Y., Tallon J. L. \REVIEWJ. Phys. Chem. Solids 62200159.
- [13] \NameKanigel A., Norman M. R., Randeria M., Chatterjee U., Souma S., Kaminski A., Fretwell H. M., Rosenkranz S., Shi M., Sato T., Takahashi T., Li Z. Z., Raffy H., Kadowaki K., Hinks D., Ozyuzer L., Campuzano J. C. \REVIEWNature Physics 22006447.
- [14] \NameHomes C. C., Timusk T., Liang R., Bonn D. A., Hardy W. V. \REVIEWPhys. Rev. Lett. 7119931645.
- [15] \NameHomes C. C., Timusk T., Liang Ruixing, Bonn D. A., Hardy W. N. \REVIEWPhysica C 2541995265.
- [16] \NamePuchkov A. V., Basov D. N., Timusk T. \REVIEWJ. Phys.: Cond. Matt. 8199610049.
- [17] \NameHwang J., Carbotte J. P., Timusk T. submitted to Phys. Rev. Lett. (2007).
- [18] \NameHwang J., Timusk T., Gu G. D. \REVIEWNature (London) 4272004714.
- [19] \NameHwang J., Timusk T., Gu G. D. \REVIEWJ. Phys.: Condens. Matter 192007125208.
- [20] \NameHwang J., Yang J., Timusk T., Sharapov S. G., Carbotte J. P., Bonn D. A., Liang Ruxing, Hardy W. N. \REVIEWPhys. Rev. B 732006014508.
- [21] \NameMitrovic B. Fiorucci M. A. \REVIEWPhys. Rev. B 3119852694.
- [22] \NameSharapov S. G. Carbotte J. P. \REVIEWPhys. Rev. B 722005134506.
- [23] \NameKnigavko A. Carbotte J. P. \REVIEWPhys. Rev. B 722005035125.
- [24] \NameKnigavko A. Carbotte J. P. \REVIEWPhys. Rev. B 732006125114.
- [25] \NameCarbotte J. P., Schachinger E., Hwang J. \REVIEWPhys. Rev, B 712005054506.
- [26] \NameZasadzinski J. F., Ozyuzer L., Coffey L., Gray K. E., Hinks D. G., Kendziora C. \REVIEWPhys. Rev. Lett. 962006017004.
- [27] \NameValla T., Kidd T. E., Pan Z. -H., Fedorov A. V., Yin W.-G., Gu G. D., Johnson P. D. cond-mat/0610249 preprint, (2006).
- [28] \NameCarbotte J. P., Schachinger E., Basov D. N. \REVIEWNature (London) 4011999354.
- [29] \NameSchachinger E. Cabotte J. P. \REVIEWPhys. Rev. B 6220009054.
- [30] \NameSchachinger E., Neuber D., Carbotte J. P. \REVIEWPhys. Rev. B 732006184507.
- [31] \NameDordevic S. V., Homes C. C., Tu J. J., Valla T., Strongin M., Johnson P. D., Gu G. D., Basov D. N. \REVIEWPhys. Rev. B 712005104529.
- [32] \NameHwang J., Timusk T., Schachinger E., Carbotte J. P. \REVIEWPhys. Rev. B 752007144508.
- [33] \NameHwang J., Schachinger E., Carbotte J. P., Gao F., Tanner D.B., Timusk T. cond-mat/0710.4104 preprint, (2007).
- [34] \NameShulga S. V., Dolgov O. V., and Maksimov E. G. \REVIEWPhysica C 1781991266.
- [35] \NameAllen P. B. \REVIEWPhys. Rev. B 31971305.
- [36] \NameMillis A. J., Monien H., Pines D. \REVIEWPhys. Rev. B 421990167.
- [37] \NameStock C., Buyers W. J. L., Cowley R. A., Clegg P. S., Coldea R., Frost C. D., Liang R., Peets D., Bonn D., Hardy W. N., Birgeneau R. J. \REVIEWPhys. Rev. B 712005024522.