Correlation Strength, Gaps and Particle-Hole Asymmetry in High- Cuprates: a Dynamical Mean Field Study of the Three-Band Copper-Oxide Model
Abstract
The three-band model relevant to high temperature copper-oxide superconductors is solved using single-site dynamical mean field theory and a tight-binding parametrization of the copper and oxygen bands. For a band filling of one hole per unit cell the metal/charge-transfer-insulator phase diagram is determined. The electron spectral function, optical conductivity and quasiparticle mass enhancement are computed as functions of electron and hole doping for parameters such that the corresponding to the paramagnetic metal and charge-transfer insulator sides of the one hole per cell phase diagram. The optical conductivity is computed using the Peierls phase approximation for the optical matrix elements. The calculation includes the physics of “Zhang-Rice singlets”. The effects of antiferromagnetism on the magnitude of the gap and the relation between correlation strength and doping-induced changes in state density are determined. Three band and one band models are compared. The two models are found to yield quantitatively consistent results for all energies less than about eV, including energies in the vicinity of the charge-transfer gap. Parameters on the insulating side of the metal/charge-transfer insulator phase boundary lead to gaps which are too large and near-gap conductivities which are too small relative to data. The results place the cuprates clearly in the intermediate correlation regime, on the paramagnetic metal side of the metal/charge-transfer insulator phase boundary.
pacs:
71.27.+a, 71.10.Hf, 71.30.+h, 74.72.-hI Introduction
The interplay of band theoretic issues of hybridization and chemical bonding with the quantum chemical issue of strong local correlations is basic to the physics of many important materials. In an important paper Zaanen85 Zaanen, Sawatzky and Allen classified insulating transition metal oxides as “charge-transfer” or “Mott” insulators according to whether the physics could be discussed solely in terms of strong correlated transition metal states or whether transitions to O states were important to the low energy physics. The issue arises with particular force in the high temperature superconductors where the Cu and states are not far in energy from O states, but the Cu state is very far away in energy. In this circumstance a strong particle-hole asymmetry is expected Emery87 , with doped electrons residing on Cu sites whereas doped holes reside mainly on the O, but may be bound to Cu spins creating “Zhang-Rice singlets”.Zhang88
Quantifying this appealing physical picture requires solving an electronic structure problem with multiple scales, including a correlation energy on the Cu site eV, a Cu-O energy level difference of 2-4eV,Mila88 ; Veenendal94 and a Cu-O hybridization eV.Andersen95 In this paper we use single-site dynamical mean-field theory (DMFT) to solve a model involving both copper and oxygen orbitals, developing a comprehensive theoretical picture of the electronic structure and optical conductivity of undoped and doped cuprate materials across the charge-transfer-insulator to charge-transfer metal phase diagram, including the effect of antiferromagnetism on the spectra and optics. We use newly improved Exact Diagonalization (ED)Caffarel94 ; Capone04 and Continuous-Time Quantum Monte Carlo (CT-QMC) Werner06 impurity solvers. These methods have different sources of error and we find consistent results with the two methods.
Our work is related to previous work of Dopf et al.,Dopf92 Georges et al.,Georges93 and Zölfl et al. Zolfl98 who each studied one particular parameter value. Modern developments in computers and solvers mean that we are able to obtain much more information. Our work also has some overlap with more recent work of Macridin et al. Macridin05 who used the Dynamical Cluster Approximation on a four site cluster to study momentum dependence and the onset of superconductivity. We compare our findings to very recent work of Weber et al.Weber08 who used similar methods to study a similar model. Weber et al. focused on specific parameters; we focus on the spectral functions and conductivities over a wider energy range, varying the charge-transfer gap to explore all regions of the theoretical phase diagram and present a comparison of the low energy behavior of the copper-oxygen model to that of an effective one-band model.
We present evidence that a one-band model provides a reliable picture of the spectral functions and conductivity for frequencies less than about eV (note that this range extends about a factor of two above the charge-transfer gap in frequency). We find an electron-hole asymmetry in the self-energy. The asymmetry is much more pronounced for parameters such that the undoped material is a charge-transfer insulator (insulating even in the paramagnetic phase). The asymmetry, however, is not reflected in the Fermi velocity renormalization or the low frequency optical matrix oscillator strength, where changes in the electronic structure compensate for the differences in correlation strength. Comparison of our results to data suggests that the cuprates are on the metallic side of the single-site DMFT phase diagram, with antiferromagnetism being essential to produce the gap in the undoped material.
The rest of this paper is organized as following: in section II we describe the model, in section III we present the calculated phase diagram, spectral functions, self-energies and optical conductivities, in section IV we compare the copper-oxygen model results to those obtained from computations performed on the one-band Hubbard model. Section V contains a summary of our results and a conclusion.
II Model
We analyze the canonical two dimensional “copper-oxygen” Hamiltonian Emery87 ; Varma87 retaining the Cu and O orbitals (whose momentum () components are created by the operators ). We allow for the possibility of two-sublattice antiferromagnetism by doubling the unit cell. The Hamiltonian is therefore a 6-band model in the magnetic Brillouin zone. To write the band theoretical part we divide the lattice into two sublattices, and , distinguish the oxygen sites displaced from the Cu in the and directions, adopt the basis and write
| (1) |
where the matrices are
| (5) | |||||
| (9) |
and . Here we neglect oxygen-oxygen hopping. We use the value eV suggested by band theory calculations.Andersen95
Because only the Cu site is interacting, we may integrate out the oxygen band to obtain an effective one-orbital model, which we solve in the single-site DMFT Georges96 using EDCaffarel94 ; Capone04 and CT-QMCWerner06 methods described in the literature. In the ED calculations typically bath states were used and the results were verified by occasional large calculations; for CT-QMC temperatures studied were typically for the phase diagram and for spectral functions and conductivities. The main result of the DMFT calculation is a self-energy which, in the antiferromagnetic phase, is spin dependent and takes the form
| (10) |
with .
In the single-site DMFT method the self-energy is momentum independent so the conductivity may be computed from Millis05
where the integral is over the magnetic Brillouin zone, the spectral function is
| (12) |
the matrix Green function at frequency and chemical potential is , the current operator is
| (13) |
and is the Fermi function.
For comparison we have studied the one-band model described by with
| (14) |
eV is chosen to reproduce the non-interacting bandwidth of the Cu-O antibonding band passing through the Fermi level and fixed so as to reproduce the correlation gap.
III Results
III.1 Phase diagram
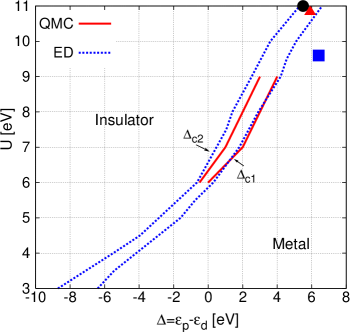
Fig. 1 shows the boundary between metallic and paramagnetic insulating solutions, calculated for one hole per CuO2 unit as a function of interaction strength and Cu-O energy level splitting () in the paramagnetic phase. As in the single-site DMFT of the one-band Hubbard model Georges96 a coexistence region is observed where both metallic and insulating solutions exist. We define the insulating and metallic boundaries of the coexistence region at fixed large to be and respectively. The phase diagram is obtained at using the ED solver; the results were verified using CT-QMC by scanning at selected values. We find almost perfect agreement for ; the CT-QMC calculation of line represents the smallest value at which a metallic phase can be found at temperature eV. The known T-dependence of the single-site DMFT boundary for the single-band Hubbard model Georges96 suggests that the discrepancy may simply be a finite-temperature effect related to the different temperatures used in the two calculations.
III.2 Spectral function
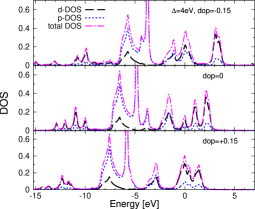
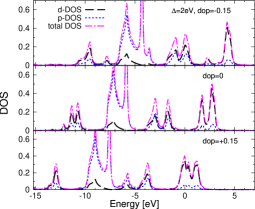
Fig. 2 presents the many body density of states (DOS) (electron removal spectrum for energy and electron addition spectrum for energy ) as well as the projections onto the Cu- and O- states calculated in the paramagnetic phase using the ED method. The zero of energy is the chemical potential. The upper panel presents results for (so within single-site DMFT the paramagnetic phase of the undoped material is metallic) while the lower panel presents results for such that the undoped material is a charge-transfer insulator. The main difference between the two spectra is the presence or absence of a gap in the undoped material.
At lowest energy (binding energy eV) a peak is seen, of mainly -character. This peak corresponds to removing one electron and leaving the Cu in the state; it is pushed down from the bare energy by a level repulsion due to hybridization with the O states. Thus it is not correct to identify the position of this peak directly with , as is sometimes done in literature.
In the binding energy range a mainly oxygen-like band is seen. The very sharp peak corresponds to the non-bonding oxygen state; it would be broadened if oxygen-oxygen hopping were taken into account (although the vanishing of the Cu-O hybridization at the point means that a singularity would remain at the bare oxygen energy). The broad structure of mixed oxygen and copper character lying below the non-bonding state may be thought of as the “bonding” linear combination of Cu and O states pushed down below the non-bonding O level by hybridization to the Cu level. This feature was identified in Ref. Weber08, as the copper upper Hubbard band corresponding to the state, but Ref. Weber08, did not present results over a wide enough range to determine if the eV peak (which we find to correspond to the state) was present in their calculations.
The structure of mixed Cu-O character at binding energies in the range corresponds to the Zhang-Rice singlet states. Calculations (not shown here) in which the Cu orbital is forced to be fully spin polarized show that these states correspond to holes with the same spin as the deep-lying removal state. The states in the electron addition spectrum are mainly of Cu character, and play the role of the upper Hubbard band.
The effect of antiferromagnetism on the magnitude of the gap in the charge-transfer insulator state has been the subject of debate, with Ref. Comanac08, arguing on the basis of Hubbard model calculations that antiferromagnetism increases the gap significantly while the conductivity calculations presented in Ref. Weber08, were interpreted as indicating no significant effect of antiferromagnetism on the gap. We have used the “quasiparticle equation” method of Ref. Wang09a, to determine the gap values at eV, eV finding that the gap in the paramagnetic insulating phase is eV while the addition of antiferromagnetism shifts the gap to eV. Some of the difference between our results and those of Ref. Weber08, may arise from the extremely small value of the calculated paramagnetic-state conductivity in the near gap region, especially for , which may have led those authors to overestimate the gap in the paramagnetic state.
Upon doping, two changes occur. First, the chemical potential moves into the Zhang-Rice band (hole doping) or the upper Hubbard band (electron doping). For the associated changes in chemical potential are substantial: the Fermi level, measured relative to the non-bonding oxygen peak, shifts by almost 2eV; for the the Fermi level changes rather less. Second, as can be seen by inspection of the Figure 2 and from Table 1, the relative strengths of the different spectral features evolve. The issue of the number of states created by doping has received some attention in the literature as a signature of “Mottness”.Meinders93 ; Phillips04 We find that the changes in the spectrum do not have a universal doping or interaction-strength dependence; however in the “charge-transfer insulating” regime , each doped hole adds roughly two states to the Zhang-Rice band and one to the upper Hubbard band, while doping with electrons does essentially the opposite. In the paramagnetic metal case the changes in electronic structure are larger.
| eV | eV |
| dop | -0.15 | 0.00 | 0.15 | -0.15 | 0.00 | 0.15 | |
|---|---|---|---|---|---|---|---|
| 0.39 | 0.53 | 0.40 | 0.50 | 0.59 | 0.41 | ||
| Z-R | 1.2 | 0.72 | 0.54 | 1.0 | 0.90 | 0.74 | |
| UHB | 0.70 | 1.0 | 1.3 | 0.80 | 0.98 | 1.23 |
III.3 Self-energy and velocity renormalization
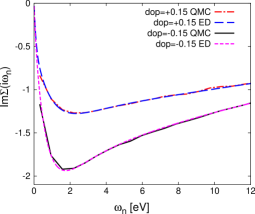
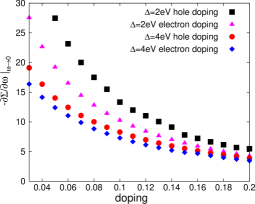
To further probe the particle-hole asymmetry we show in the upper panel of Fig. 3 the self-energy calculated on the Matsubara axis for electron and hole doping at . The near-perfect agreement between the results of ED and CT-QMC calculations serves as a test of the reliability of our results. The lower panel focuses on the low frequency behavior, presenting the doping dependence of estimated from the values of at the lowest two Matsubara points of the ED calculation for both (paramagnetic insulator) and (paramagnetic metal). At very low doping the estimate becomes unreliable because the (very small) Fermi liquid scale is not easily resolved so we do not present results. We see again that the self-energy is systematically larger for hole doping than for electron doping, with the difference being more pronounced for the paramagnetic insulator case.
However, the self-energy is not necessarily the most relevant measure of correlation strength. In a multiband model such as the one studied here, the Fermi surface is given by the solution of at . The degree to which states participate in the Fermi surface states depends on the self-energy, which of course changes across the charge-transfer gap and with doping. By expanding for near and near and defining and , we find that the physical quasiparticle velocity is given by
| (15) |
and the bare Fermi velocity by the same equation but with . The bare velocities (defined here in physical units by multiplying the result above by the lattice constant Å) have only about doping dependence on either the electron on the hole doped sides, but change substantially as one goes from electron to hole doping: at eV we have for the hole doped and for the electron doped calculation while at eV we have for hole doping and for electron doping.
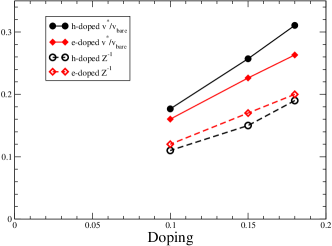
We see from Fig. 4 that for the strong coupling (eV) case the particle-hole asymmetry in is slightly overcompensated by a difference in character of the ground state wave function, so that the particle-hole asymmetry in the ratio is rather smaller in magnitude and of opposite sign, compared to that in , while in the more weakly correlated case the wave function changes induce an asymmetry in velocity renormalization which, while small, is larger than that in .

III.4 Optical conductivity
We have calculated the optical conductivity and have verified the results via comparison of the integral of our calculated conductivity to the independently calculated “kinetic energy” and to the average of the renormalized Fermi velocity over the Fermi surface. We also compared results obtained directly on the real axis from the ED calculation to results obtained by analytic continuation of the Matsubara axis self-energy obtained from CT-QMC calculations using the methods of Ref. Wang09a, .
The upper panel of Fig. 5 shows the conductivity in the near gap region for a doping of one hole per Cu-O2 unit in the antiferromagnetic phase at eV, 4eV and 4.5eV. As noted above, for parameters the gap in the antiferromagnetic phase is rather larger than the experimentally measured value eV.Uchida91 On the other hand, the gap value determined from the antiferromagnetic phase of the calculation is in reasonable agreement with data. This comparison places the materials clearly on the metallic side of the paramagnetic-metal/charge-transfer-insulator phase diagram, in agreement with previous analysis based on the one-band Hubbard model.Comanac08 However, it is important to note that the calculated conductivities in this frequency range are about a factor of 2 smaller in magnitude relative to experimental data (note that a normalization error means that the conductivity results of Ref. Comanac08, are too large by a factor of two). Some of the difference may arise from transitions to bands not included in the present calculation, but it is possible also that the Peierls phase arguments omit important interband matrix elements even within the space of states we consider. This is an important issue for further study.

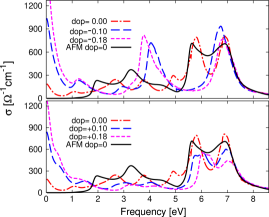
The lower panels of Fig. 5 display the doping dependence of the conductivity, calculated in the paramagnetic phase for eV. Electron or hole doping adds optical absorption strength (associated with motion of doped holes) at frequencies eV. For both values of the integrated absorption strength (up to 2eV) is found to be comparable for electron and hole doping, despite the differences in self-energy displayed in Fig. 3. In this frequency range, the optical matrix element is proportional to the Fermi velocity which depends on the renormalized Cu-O energy difference set by the parameter . The shifts in as the chemical potential is tuned from hole to electron doping leads to a bare Fermi velocity which is larger on the hole-doped side than on the electron-doped side as noted in the previous sub-section to a change in the d-character of the wave function; these effects lead to changes in the optical matrix elements which compensate to a considerable degree for the change in self-energy. One of us previously argued Millis05 that the experimentally observed similarity in low frequency optical absorption between electron and hole-doped materials implied that the correlation strength was about the same for two systems; we see that this argument must be treated with caution.
A more striking change is that hole-doping but not electron doping activates a strong transition at about 4eV between the non-bonding oxygen band and the near-Fermi-surface states. This feature is not observed experimentally; indeed a comparison of Figures 7 and 8 of Ref. Uchida91, shows that in the range eV the optical absorption in electron doped compounds is slightly larger than in hole-doped compounds. We note that in a more realistic three-band model with oxygen-oxygen hopping included the spectral weight in this peak would be spread over a wider energy range. Further experimental and theoretical investigation of this issue is important.
IV Comparison to One Band Model


A basic issue in the physics of the cuprates is the reduction of the three-band model to an effective one-band model.Emery87 ; Zhang88 ; Mila88 We test the reduction by comparing our results at to results obtained by applying the QMC solver to a one-band square-lattice Hubbard model at and eV chosen to reproduce the splitting between the centroids of the upper and lower Hubbard bands. Fig. 6 shows the comparison of spectral functions and optical conductivities. To obtain spectra for the Hubbard model we used the analytic continuation procedure described in Ref. Wang09a, , while the three-band results were obtained using the ED solver at parameters eV, eV and . All calculations are done in the paramagnetic phase.
The upper panel of Fig. 6 compares the spectral functions. One sees immediately that the one-band and three-band models provide a reasonably consistent account of the spectra within a few eV of the Fermi energy. Some differences are evident. From the upper panels one sees that the one-band model has a slightly larger bandwidth than the three-band model (the difference is most evident for the half-filled calculation). This difference may be interpreted as indicating that the three-band model at is equivalent to a one-band model at a a bit greater than .
The lower panel of Fig 6 compares the conductivities. In the half filled case the two models give a quite consistent account of the absorption above the Mott-Hubbard/charge-transfer gap edge. Note that because the lowest-lying gap excitation is not optically active, the difference in gap values noted in the previous paragraph is not easy to see in this panel. The one-band and three-band calculations are done with different methods but as can be seen, the conductivities are similar and we have verified that the spectral weight (integral of up to say eV) are similar for the two models. However, for hole doping a new feature in the three-band model appears at eV. This is associated with transitions from the non-bonding oxygen band, which is of course not present in the one-band model.
V Conclusion
In this paper we have used the single site dynamical mean field method to solve the three-band model believed to be relevant to the copper-oxide materials. The method includes the physics of Zhang-Rice singlets (doped holes reside largely on oxygen sites and have spin opposite to the copper spin), reproduces the characteristic features of the spectrum, and reveals (especially for parameters in the “charge-transfer insulator” regime) a particle-hole asymmetry in the self-energy which however is largely canceled by the difference in -content of the near-Fermi surface states, leading to very similar velocity renormalizations between electron and hole-doped compounds. One important implication of this finding is that (at least for the correlation strengths we have studied) the fact that doped holes are “Zhang-Rice singlets” while doped electrons are just conventional doubly occupied sites does not imply a significant difference in the physics and suggesting that a reduction to an effective one-band model may be reasonable. The issue of reduction to a one-band model has been considered by many previous authors; however the discussion has been largely been couched in terms related to reduction to t-J-like models. We prefer to directly compare spectral functions and conductivity. We found that for (paramagnetic insulator) a one-band model gave a quantitatively accurate description of the physics at scales below about eV (above this scale the effects of non-bonding oxygen states which are not included at all in the one-band model become visible). Similar results (not shown) are found for . It is likely that for parameters much deeper in the insulating phase (which we have not investigated) the “Zhang-Rice” effects may be more important and the reduction to a one-band model may be more problematic.
A basic question in cuprate physics is the effective correlation strength governing the physics of the low-energy particles responsible for superconductivity. We addressed this question by calculating the gap in the insulating phase. The gap is of a “charge-transfer” rather than “Mott-Hubbard” nature, as stressed by many previous workers. Our comparison to the one-band model shows that the charge-transfer gap can be used to extract an effective which, when used in a one-band model, reproduces the low energy physics reasonably well. In contrast to Ref. Weber08, we find that antiferromagnetism has a pronounced effect on the magnitude of the gap in the insulating state. We find that there is no reasonable way to obtain a gap of the physical scale (between and eV) if the materials are assumed to be paramagnetic insulating side of the phase diagram; rather they must be taken to be more moderately correlated. This conclusion is in agreement with previous results.Comanac08
Three features of the calculation suggest potentially interesting directions for future research. First, the quasiparticle band structure depends on the renormalized level energy . This quantity has (especially for stronger correlations) a noticeable dependence on doping and on which side of the charge-transfer gap the materials are on. It also changes dramatically between antiferromagnetic and paramagnetic states. Further investigation of the physical consequences of these changes would be useful. This might produce additional insight into the fundamental electronic structure dichotomy in many transition metal oxides between the dramatic evidence for strongly correlated behavior in high energy spectroscopies and the more nearly band-like behavior of the lower energy excitations.
Concerning the conductivity, as is seen most clearly in Fig. 6, the calculated insulating state conductivity is only a few hundred inverse-ohm-inverse-centimeters, rather smaller than the experimentally measured values . Some part of the discrepancy may arise from other bands, not considered in our calculation, but it may also indicate a failure of the Peierls-phase approximation to the conductivity. A further issue in the comparison of the high-frequency calculated conductivity to data is the appearance, for hole doping but not electron doping, of a strong feature relating to transitions from the non-bonding oxygen bands to the near-Fermi-surface states. This feature implies that the high energy conductivity in the 4-6eV range should be greater for hole doped than for electron doped compounds. This is not seen experimentally. Inclusion of oxygen-oxygen hopping will spread the excess spectral weight over a wider frequency range, perhaps mitigating the discrepancy with experiment. Further, one must bear in mind that the electron and hole doped materials studied experimentally have different crystal structures, introducing further uncertainties in the comparison. However, the issue warrants further study.
Acknowledgments
This collaboration was begun with support from the Columbia/Polytechnique/Science Po /Sorbonne Alliance program. AJM and XW are supported by NSF-DMR-0705847 and MC by MIUR PRIN 2005, Prot. 200522492 and MIUR PRIN 2007, Prot. 2007FW3MJX003, and LdM by the Rutgers Center for Materials Theory, NSF-DMR-0528969 and RTRA Triangle de la physique. We acknowledge helpful discussions with C. Weber which led to physics insights and to correction of an error in the normalization of the conductivity in an earlier version of this manuscript. We also thank N. Lin for helpful discussions and for aid in verifying the conductivity calculations.
References
- (1) J. Zaanen, G. A. Sawatzky, and J. W. Allen, Phys. Rev. Lett. 55 418 (1985).
- (2) V. J. Emery, Phys. Rev. Lett. 58 2794 (1987).
- (3) F. C. Zhang and T. M. Rice, Phys. Rev. B 37 3759 (1988).
- (4) F. Mila, F. C. Zhang, and T. M. Rice, Physica C 153-155 1221 (1988).
- (5) M. A. van Veenendaal, G. A. Sawatzky, and W. A. Groen, Phys. Rev. B 49 1407 (1994).
- (6) O. K. Andersen, A. I. Liechtenstein, O. Jepsen, and F. Paulsen, J. Phys. Chem. Solids 56, 1573 (1995).
- (7) M. Caffarel and W. Krauth, Phys. Rev. Lett. 72, 1545 (1994).
- (8) M. Capone, M. Civelli, S. S. Kancharla, C. Castellani, and G. Kotliar, Phys. Rev. B 69, 195105 (2004).
- (9) P. Werner, A. Comanac, L. de’ Medici, M. Troyer, and A. J. Millis, Phys. Rev. Lett. 97, 076405 (2006).
- (10) G. Dopf, A. Muramatsu, and W. Hanke, Phys. Rev. Lett. 68, 353 - 356 (1992)
- (11) A. Georges, B. G. Kotliar, and W. Krauth, Z. Phys. B 92 313 (1993).
- (12) M.B. Zölfl, T. Maier, T. Pruschke and J. Keller, European Physical Journal B 13 47 (2000)
- (13) A. Macridin, M. Jarrell, Th. Maier, and G.A. Sawatzky, Phys. Rev. B 71 134527 (2005).
- (14) C. Weber, K. Haule and G. Kotliar, Phys. Rev. B 78, 134519 (2008).
- (15) C. M. Varma, S. Schmitt-Rink, and E. Abrahams, Sol. St. Comm. 62 681 (1987).
- (16) A. Georges, B. G. Kotliar, W. Krauth, and M. Rozenberg, Rev. Mod. Phys. 68 13 (1996).
- (17) A. J. Millis, A. Zimmers, R. P. S. M. Lobo, N. Bontemps and C. C. Homes, Phys. Rev. B 72 224517 (2005).
- (18) A. Comanac, L. de’ Medici, M. Capone, and A. J. Millis, Nat. Phys. 4 287 (2008).
- (19) X. Wang, E. Gull, L. de’ Medici, M. Capone and A. J. Millis, Phys. Rev. B 80, 045101 (2009).
- (20) M. B. J. Meinders, H. Eskes, and G. A. Sawatzky, Phys. Rev. B 48 3916 (1993).
- (21) T. D. Stanescu and P. Phillips, Phys. Rev. B 69, 245104 (2004).
- (22) S. Uchida, T. Ido, H. Takagi, T. Arima, Y. Tokura and S. Tajima, Phys. Rev. B 43 7942 (1991).