A minimal model for kinetic arrest
Abstract
To elucidate slow dynamics in glassy materials, we introduce the Figure-8 model in which hard blocks undergo Brownian motion around a circuit in the shape of a figure-8. This system undergoes kinetic arrest at a critical packing fraction , and for long-time diffusion is controlled by rare, cooperative ‘junction-crossing’ particle rearrangements. We find that the average time between junction crossings , and hence the structural relaxation time, does not simply scale with the configurational volume of transition states, because also depends on the time to complete a junction crossing. The importance of these results in understanding cage-breaking dynamics in glassy systems is discussed.
pacs:
64.70.Pf, 61.43.Fs, 82.70.DdGlass transitions occur in myriad systems that span a wide range of lengthscales angell including atomic, polymeric, and colloidal systems. When cooled or compressed sufficiently fast, glass-forming materials undergo a transition from an ergodic liquid state to an amorphous solid-like glassy state pusey ; blaaderen ; weeks . Glassy dynamics is characterized by several common features debenedetti . For example, the viscosity and structural relaxation times diverge super-Arrheniusly near the glass transition, and the long-time self-diffusion constant becomes extremely small. Correspondingly, a plateau develops in the particle mean-square displacement (MSD). As the system approaches the glass transition, the plateau extends to longer and longer times doliwa ; thirumalai ; miyagawa , signaling kinetic arrest associated with the formation of cages of neighbors around each particle. Structural relaxation occurs through a series of rare cage-breaking events, in which particles in the nearest-neighbor and further shells move cooperatively so that caged particles can escape weeks .
|
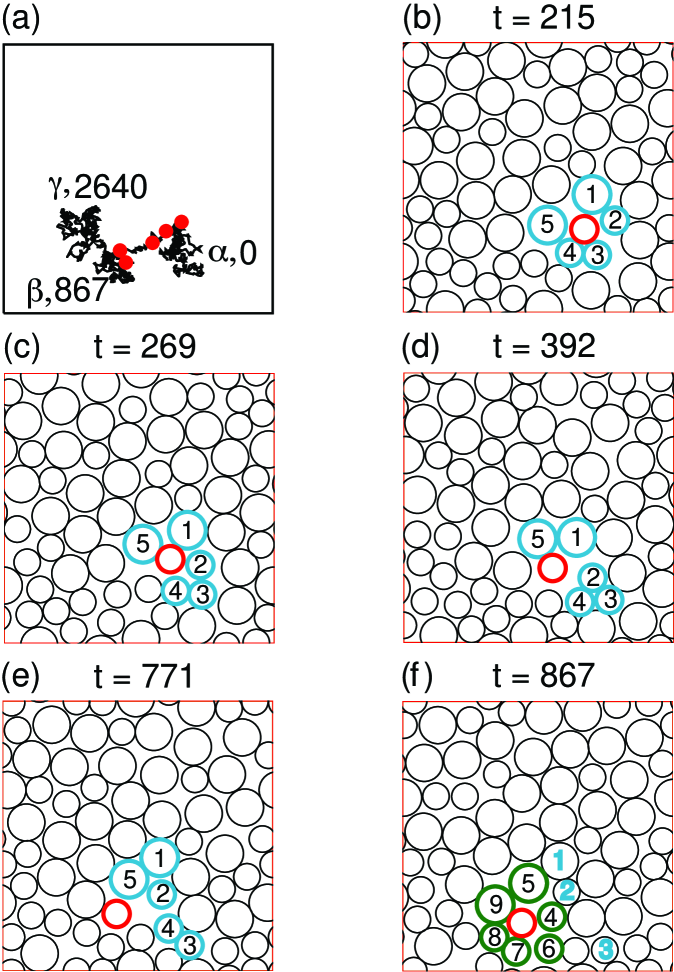
The last feature is emphasized in Fig. 1, where we show results from simulations of a 50%–50% bidisperse mixture of hard disks with diameter ratio in the supercooled liquid regime. In Fig. 1 (a), we plot displacements of a focus particle as it moves between three cages , , and . In Fig. 1 (b)-(f), we monitor the focus particle and its neighbors as it breaks out of cage and becomes trapped in . Two processes are required for cage-breaking to occur. First, an opening must appear in the shell of nearest neighbors (cf. panels (c) and (d)) and second, particles beyond the nearest-neighbor shell must make sufficient room to accommodate the escaping particle (cf. panels (d) and (e)). If the material beyond the nearest-neighbor shell behaves as a fluid, the second process occurs easily, and the first is the rate controlling step. However, at higher packing fractions structural relaxation outside the nearest-neighbor shell relies on other cage rearrangements. As the system approaches the glass transition, particles cannot escape from their cages, because the surrounding particles, trapped in their own cages, are unable to make room. Geometrically, this is similar to the mechanism responsible for rush-hour traffic jams, where cars cannot exit an intersection because there is not enough room in the street in front of them. This, in turn, prevents cars in the perpendicular direction from entering the intersection, which causes a cascade of delays, leading to a city-wide traffic jam.
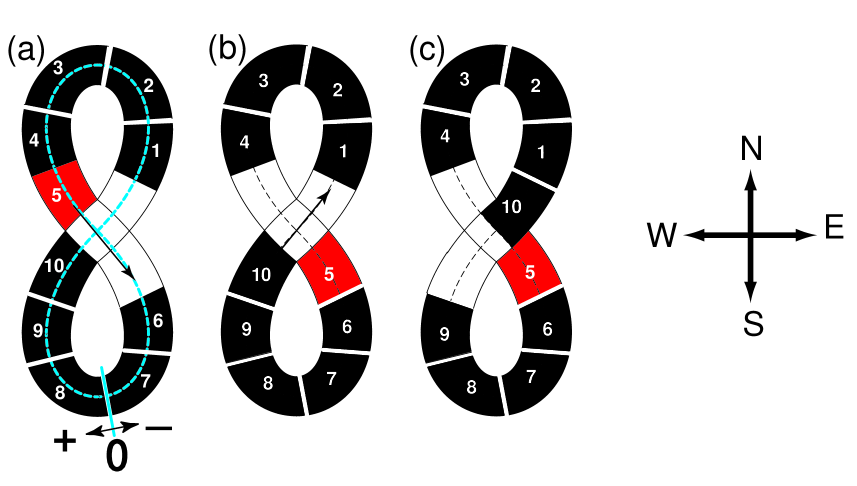
To elucidate geometrical mechanisms responsible for extremely slow dynamics in glassy materials, we introduce a ‘minimal’ Figure-8 model that captures fundamental aspects of caging and cooperative motion. As illustrated in Fig. 2, in our model hard blocks undergo single-file diffusion around a continuous course in the shape of a figure-8. Kinetic arrest at large occurs because particles moving in one direction must vacate the junction to allow those moving in the perpendicular direction to pass through the junction. The Figure-8 model has several appealing features. First, it is one of the simplest continuum models that captures kinetic arrest (and the dependence of the structural relaxation time on can thus be calculated analytically). Second, to mimic a glassy material, the Figure-8 model can be generalized to the ‘Manhattan’ model, which includes an arbitrary number of intersections and particles per lobe. Third, experimental realizations of the Figure-8 model can be performed, for example, by confining colloidal suspensions in narrow channels lutz ; lin . The Figure-8 model may provide insights into important unanswered questions concerning glassy systems: 1) What mechanisms give rise to cage-breaking events and how are they related to dynamical heterogeneities string ; ediger2 ? 2) Why does significant slowing down occur in dense particulate systems below random close packing? 3) What is the form of the divergence of the structural relaxation time near the glass transition?
We now provide a detailed description of the Figure-8 model. The upper and lower lobes of a channel of length intersect at a square junction with unit dimensions. The particles (hard blocks with length ) undergo single-file Brownian diffusion, implemented numerically using Monte-Carlo single-particle moves chosen from a Gaussian distribution. The total contour length and average gap per particle satisfy the relation . The particles are not allowed to turn at the intersection. Therefore, particles move through the junction in one of two possible modes: (1) from north west to south east and vice versa or (2) from north east to south west and vice versa. To switch modes, particles moving in one mode must vacate the junction to allow particles in the other mode to enter the junction. We focus our analysis on small systems with particles to imitate cooperative cage rearrangements in finite-size local regions in glass-forming liquids (such as those depicted in Fig. 1).
|
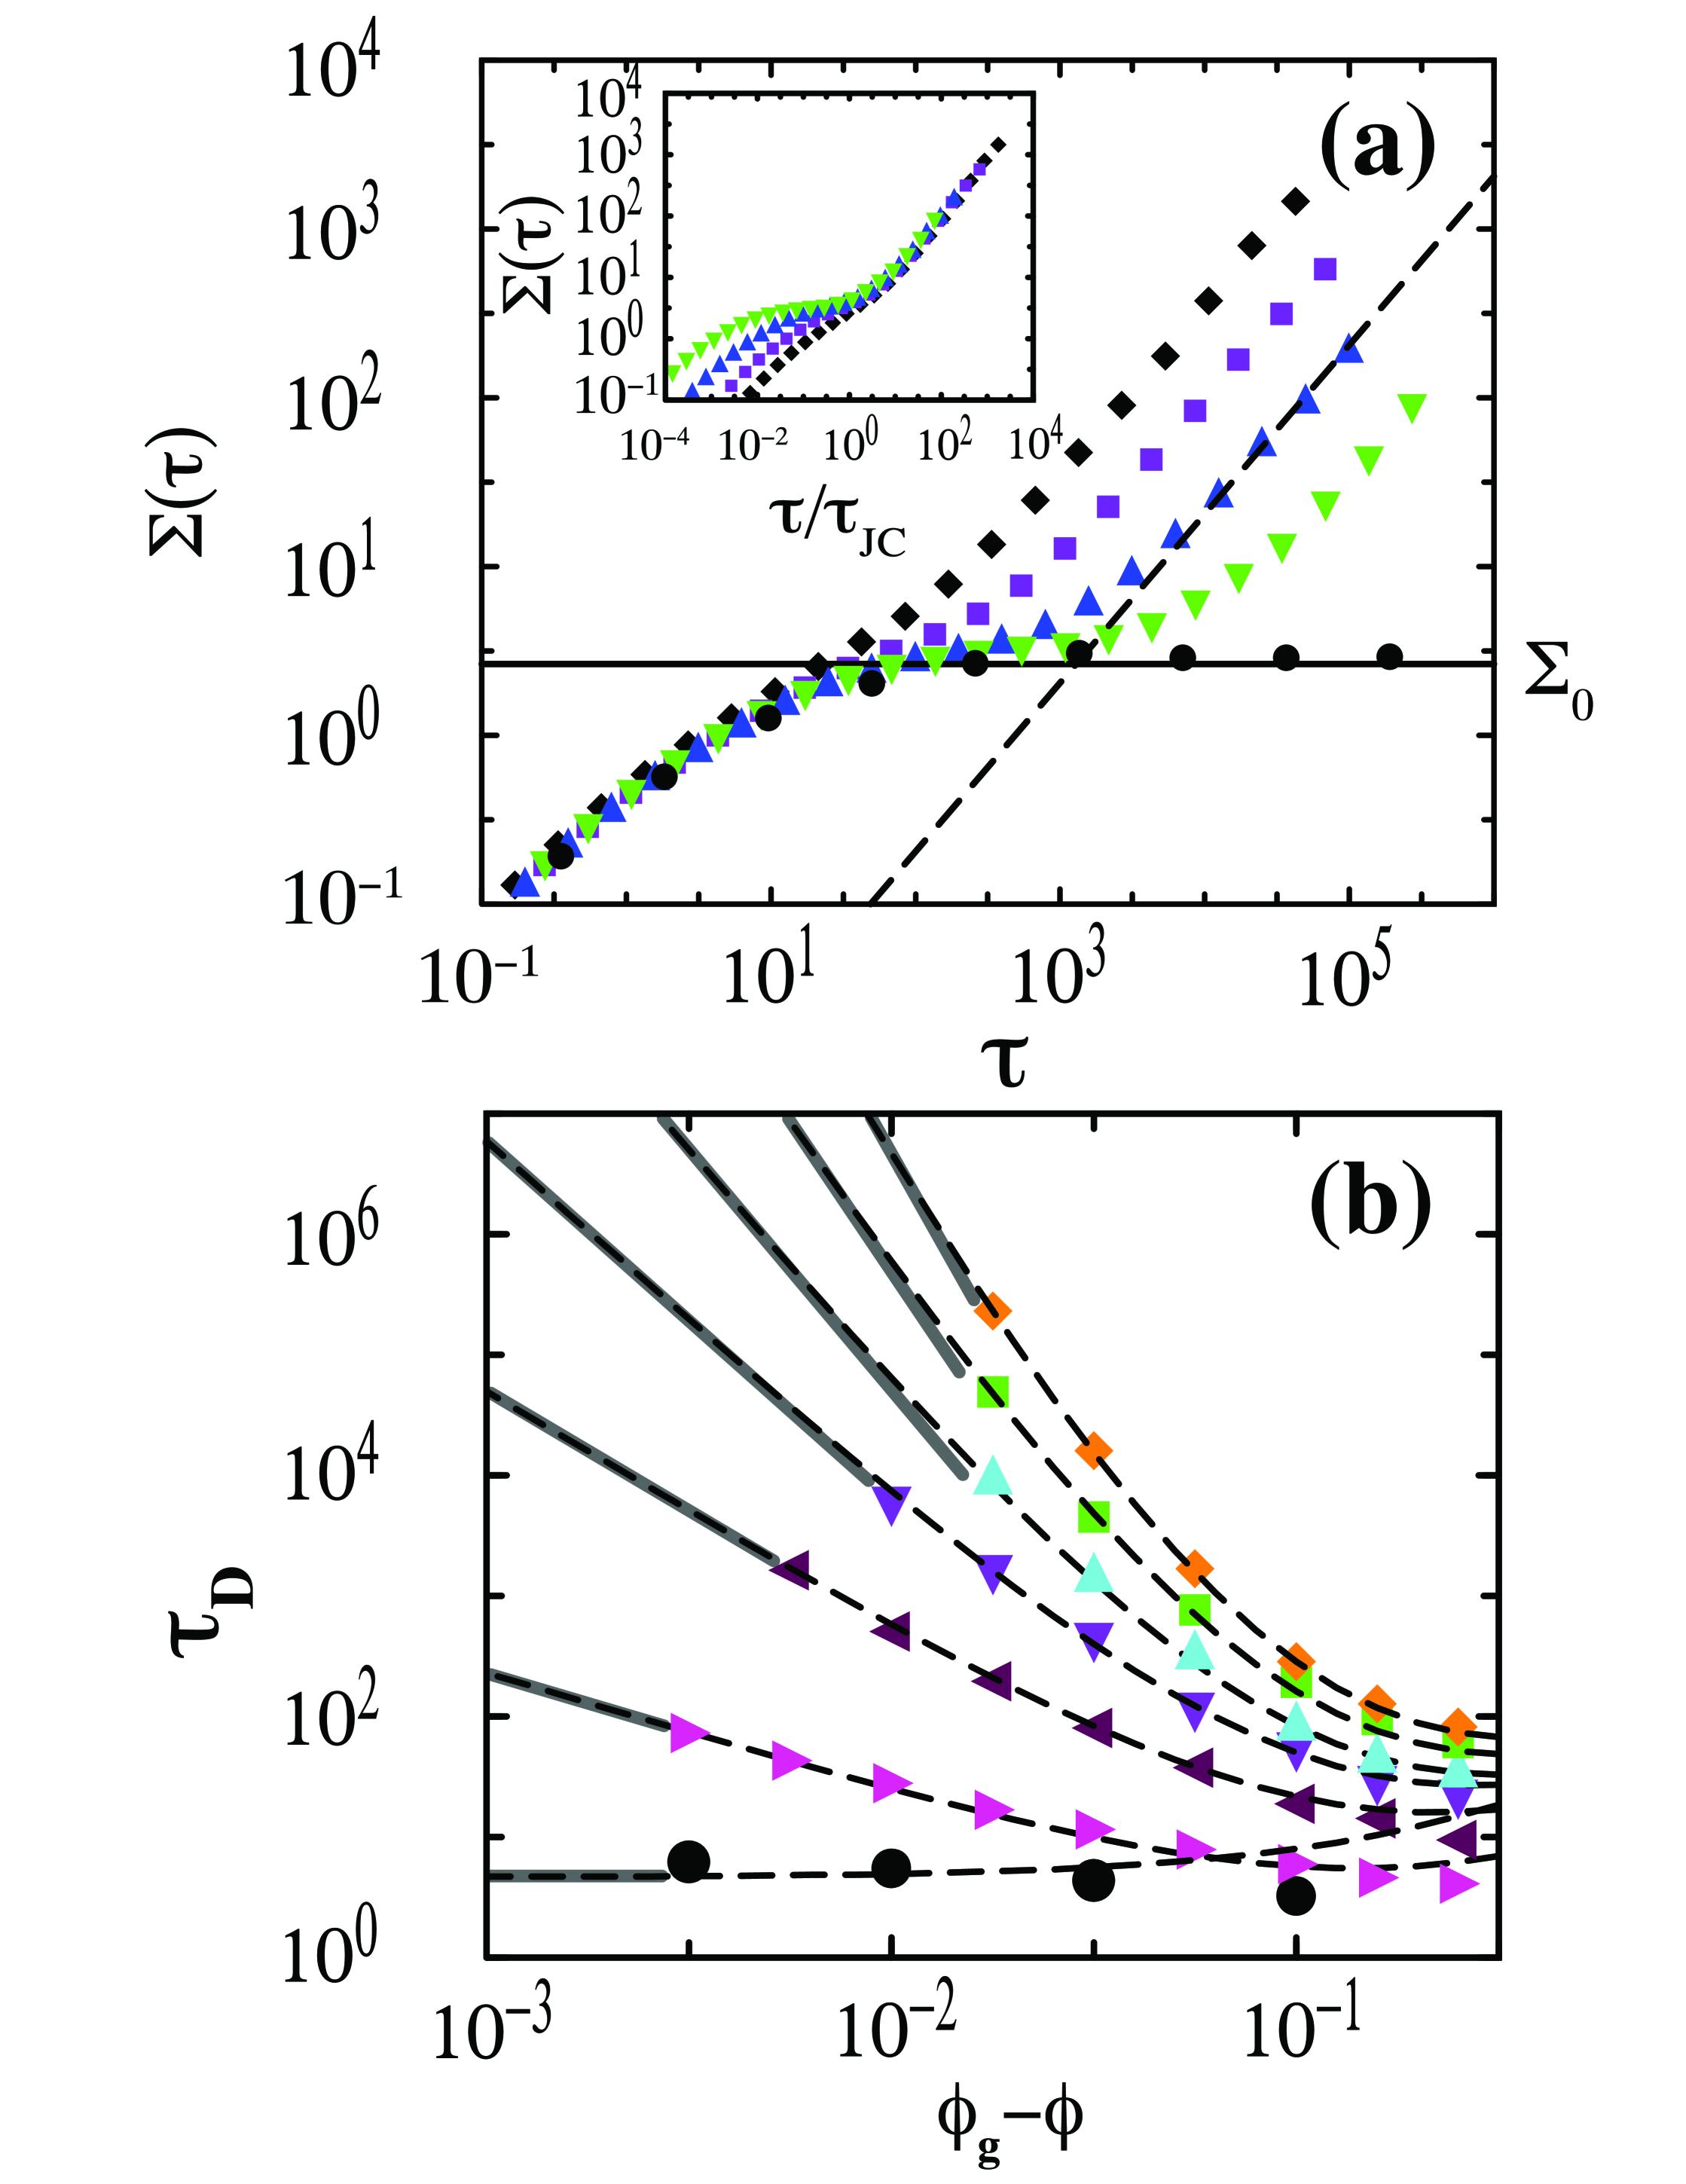
The system dynamics is monitored by measuring the MSD of the blocks, , where is the position of the center of block at time . As seen from the numerical results shown in Fig. 3 (a), for sufficiently large the MSD develops a plateau , which signals the onset of slow dynamics. The length of the plateau increases as approaches a critical value . However, for any , the MSD finally becomes diffusive, with as . This behavior mimics slow dynamics in glassy materials. The time for the system to reach the long-time diffusive regime is plotted in Fig. 3 (b) as a function of for several system sizes . The results indicate that exhibits a power-low divergence
| (1) |
for as indicated by the solid lines.
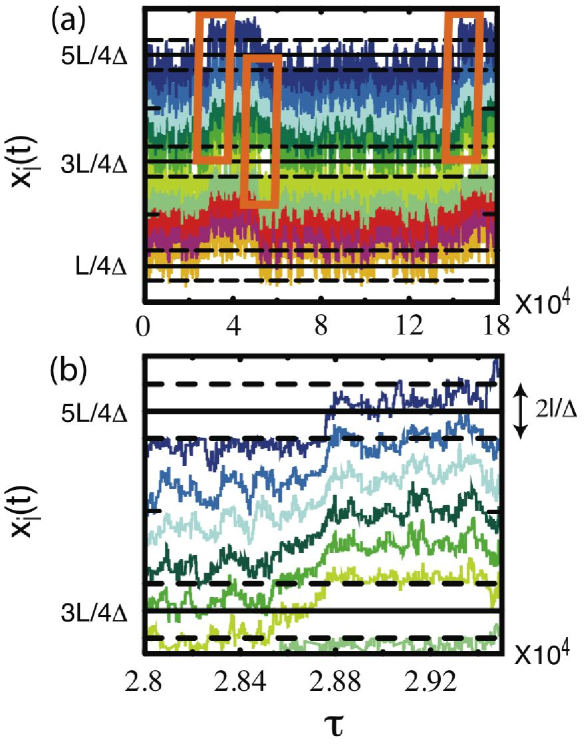
To gain insight into the system dynamics near and explain the critical behavior (1), we consider sample trajectories depicted in Fig. 4. We see that most often particles are evenly divided between the two lobes, and the junction is occupied by one or two particles in the same mode. Occasionally, the junction becomes unoccupied and the direction of motion changes. However, an analysis of the trajectories shows that not all such switches produce significant particle displacements.
On rare occasions, a switch of the direction of motion results in a significant shift of all particles. Such a junction-crossing rearrangement requires that a specific sequence of events unfolds as shown schematically in Fig. 2 and in actual trajectories in Fig. 4. First, a given particle completely crosses the intersection and enters a lobe that already has particles, thus creating a compressed lobe with particles. Next, another particle leaves the compressed lobe from the other end (which requires that the intersection is free) and enters the uncompressed lobe, so that the particles are again evenly distributed between the two lobes. Three such junction-crossing events are highlighted in Fig. 4 (a), and a closeup of one of them is shown in Fig. 4 (b).
Due to geometrical constraints, junction crossings can only occur when , which yields . In the limit , the available space in the compressed lobe goes to zero, giving rise to the slow dynamics and the resulting plateau of the MSD depicted in Fig. 3. In the inset to Fig. 3 (a), we replot the MSD curves with scaled by the average time between junction-crossing rearrangements . The rescaled MSD curves for different collapse at long times, which confirms that long-time diffusion is controlled by junction-crossing events. An analysis of the geometry of the system indicates that a junction crossing event produces an average particle shift , and thus, we find that .
|
Since the slow evolution for results from an entropic bottleneck associated with creation of a compressed lobe, we expect that the scaling behavior of with can be obtained by calculating the corresponding volume in configuration space. In equilibrium, the fraction of time the system spends in the compressed configuration can be expressed as
| (2) |
where and are configuration integrals for the compressed (uncompressed) lobe and whole system respectively. and can be written in terms of the configurational integral for a 1D gas of unit-length hard rods confined within length (Tonks gas tonks ). The compressed and uncompressed lobes correspond to a Tonks gas of length with particles. Accordingly we have
| (3a,b) |
where and denote the free space in the compressed and uncompressed regions. The configurational integral for the whole system can be expressed as a combination of Tonks-gas results,
| (4) |
where the factor of 2 corresponds to the two directions of motion for particles in the intersection, and the subtracted sum prevents double counting configurations with an empty intersection.
|
At the free space in the compressed lobe vanishes, which is the source of the kinetic arrest. The structural relaxation time for is calculated using (2) to estimate the average time between junction crossings (where is the number of crossing events). Assuming that on average during a single junction-crossing event the system spends time with one compressed and uncompressed lobe, we obtain
| (5) |
which links the structural relaxation time to the ratio of the configurational integrals (2) and (4). Using (2a), free space in the compressed lobe can be written in terms of ,
| (6) |
Thus, one might expect that , i.e. the inverse diffusion time scales with the number of transition configurations. (This assumption is frequently adopted in analyses of cooperative glassy dynamics Gibbs-Adams ). However, our numerical results do not support this hypothesis, and instead we observe a weaker singularity (1).
The anomalous behavior (1) stems from the fact that not only but also vanishes at . This can be demonstrated by noting that Brownian dynamics of a 1D gas of hard rods can be mapped onto a 1D system of point particles with interparticle distances equal to the gaps between rods in the original Tonks gas. Since a gas of point particles does not involve a characteristic lengthscale, the entire stochastic process for systems of different packing fractions (but corresponding initial conditions) can be scaled onto each other by introducing rescaled variables
| (7) |
where is an appropriate scaling factor (e.g. the average interparticle gap). In the above relations is the gap between the first particle and the position at which the boundary condition is applied; the boundary condition on the other end of the domain is represented in terms of the variable .
To apply scaling relation (7) to our system we recall that a junction-crossing event requires that the particles are divided between the compressed and uncompressed lobes. Particles in the compressed lobe evolve as a 1D Tonks gas until an interaction occurs with a particle that initially resided in the uncompressed lobe. We note that the evolution of particles in the compressed lobe can be rescaled exactly even if a particle leaves this lobe and enters the junction, because both the particle positions and boundary conditions can be rescaled. This is important because a particle on the border of a junction enters and leaves the compressed lobe multiple times before a junction-crossing event is completed.
The mapping (7) of the dynamics of the compressed lobe implies that the corresponding scaling will also hold for the average time that the system spends in the compressed configuration. Taking , we find that
| (8) |
where is a proportionality constant. Combining the above relation with (5) yields vogel
| (9) |
which, according to Eqs. (6) and (8), agrees with the observed anomalous scaling behavior (1). In Fig. 3 (b), we show that Eq. (9) accurately represents the long-time diffusive dynamics not only in the scaling regime , but also at moderate .
To summarize, we introduced the Figure-8 model, which exhibits kinetic arrest when . We showed that for long-time diffusion in our system is controlled by rare, cooperative junction-crossing events, and we determined the configuration-space volume corresponding to the transition states associated with junction crossings. We also demonstrated that the inverse structural relaxation time does not scale with the volume as , but the scaling also involves an additional singular factor associated with the accelerated evolution of compressed particle configurations in the volume . We predict that similar anomalous behavior may occur in glassy materials when a cage rearrangement requires compression of the material surrounding the cage.
There are several possible extensions of the Figure-8 model that may shed light on important features of the glass transition (such as dynamic heterogeneities and aging phenomena cianci ; makse ). We expect that these phenomena can be characterized by expanding the approach used here one . One generalization of the Figure-8 model we are now pursuing involves increasing the number of junctions and determining how depends on and in a network of cross-linked channels. Similar to the Figure-8 model, the multi-junction system exhibits kinetic arrest at below close packing. An analysis of this class of models will thus shed light on the mechanisms that give rise to slow dynamics in glass-forming materials.
Financial support from NSF grant numbers CBET-0348175 (JB), CBET-0625149 (PP), and DMR-0448838 (CO) and EPSRC grant number EP/D050952/1 (RS) is gratefully acknowledged. We thank G.-J. Gao for his input and the Aspen Center for Physics where some of this work was performed.
References
- (1) C. A. Angell, Science 267 (1995) 1924.
- (2) P. N. Pusey and W. van Megen, Nature 320 (1986) 340.
- (3) A. van Blaaderen and P. Wiltzius, Science 270 (1995) 1177.
- (4) E. R. Weeks, J.C. Crocker, A. C. Levitt, A. Schofield, and D. A. Weitz, Science 287 (2000) 627.
- (5) P. G. Debenedetti and F. H. Stillinger, Nature 410, 259 (2001).
- (6) B. Doliwa and A. Heuer, Phys. Rev. E 61, 6898 (2000).
- (7) D. Thirumalai and R. D. Mountain, Phys. Rev. E 47, 479 (1993).
- (8) H. Miyagawa, Y. Hiwatari, B. Bernu, and J. P. Hansen, J. Chem. Phys. 88, 3879 (1988).
- (9) C. Donati, J. F. Douglas, W. Kob, S. J. Plimpton, P. H. Poole, and S. C. Glotzer, Phys. Rev. Lett. 80 (1998) 2338.
- (10) M. D. Ediger, Ann. Rev. Phys. Chem. 51 (2000) 99.
- (11) G. C. Cianci, R. E. Courtland, and E. R. Weeks, Solid State Comm. 139 (2006) 599.
- (12) P. Wang, C. Song, and H. A. Makse, Nature Physics 2 (2006) 526.
- (13) C. Lutz, M. Kollmann, and C. Bechinger, Phys. Rev. Lett. 93 (2004) 026001.
- (14) B. Lin, M. Meron, B. Cui, S. A. Rice, and H. Diamant, Phys. Rev. Lett. 94 (2005) 216001.
- (15) L. Tonks, Phys. Rev. 50 (1936) 955.
- (16) G. Adam and J. H. Gibbs, J. Chem. Phys. 43 (1965) 139.
- (17) In the large- limit, for , but this limit is not the focus of our study.
- (18) R. Stinchcombe and M. Depken, Phys. Rev. Lett. 88 (2002) 125701; M. Depken and R. Stinchcombe, Phys. Rev. E 71 (2005) 065102; A. Lefévre, L. Berthier, and R. Stinchcombe, Phys. Rev. E 72 (2005) 010301(R).