Chandra Observations of the Cl1604 Supercluster at z=0.9: Evidence for an Overdensity of Active Galactic Nuclei
Abstract
We present the results of Chandra observations of the Cl1604 supercluster at . The system is the largest structure mapped at redshifts approaching unity, containing at least eight spectroscopically confirmed galaxy clusters and groups. Using two 50-ksec ACIS-I pointings we examine both the X-ray point source population and the diffuse emission from individual clusters in the system. We find a excess of point sources detected in the hard band (2-10 keV) relative to the number of sources found in blank fields observed by Chandra. No such excess is observed in the soft band (0.5-2 keV). The hard-band source density is 1.47 times greater than that of a blank field, in agreement with the previously reported correlation between overdensity amplitude and cluster redshift. Using a maximum likelihood technique we have matched 112 of the 161 detected X-ray point sources to optical counterparts and found 15 sources that are associated with the supercluster. All 15 sources have rest-frame luminosities consistent with emission from active galactic nuclei (AGN). We find that the supercluster AGN largely avoid the densest regions of the system and are instead distributed on the outskirts of massive clusters or within poorer clusters and groups. We have also detected diffuse emission from two of the eight clusters and groups in the system, clusters Cl1604+4304 and Cl1604+4314. The systems have bolometric luminosities of and erg s-1 and gas temperatures of and keV, respectively. Using updated velocity dispersions, we compare the properties of these systems to the cluster scaling relations followed by other X-ray and optically selected galaxy clusters at high redshift.
Subject headings:
galaxies: clusters: general — large-scale structure — X-rays: galaxies: clusters1. Introduction
There is an ongoing debate as to whether active galactic nuclei (AGN) are triggered in the environments around galaxy clusters in excess to what is observed in the field. A growing number of studies have reported an overdensity of X-ray point sources in the vicinity of clusters relative to blank-field observations (Henry & Briel 1991; Cappi et al. 2001; Pentericci et al. 2002; Molnar et al. 2002, Johnson et al. 2003; D’Elia et al. 2004; Ruderman & Ebeling 2005; Cappelluti et al. 2005; Hudaverdi et al. 2006; Branchesi et al. 2007), while other studies like the large Chandra archival program ChaMP (Kim et al. 2004a), using observations covering 1.1 deg2, find no significant difference between cluster and cluster-free fields (Molnar et al. 2002; Kim et al. 2004b).
Many studies which have reported overdensities find evidence that the excess sources are AGN on the outskirts of clusters and that they may trace the large-scale structure which surrounds the systems. D’Elia et al. (2004) found an asymmetric distribution of point sources around the cluster 3C 295, which the authors propose may trace a large-scale filament connected to the cluster. Johnson et al. (2003) report a overdensity of AGN in MS1054-0321 and found that the sources were preferentially located 1-2 Mpc from the cluster center. Likewise, Ruderman & Ebeling (2005) reported a statistical excess of AGN near the virial radius of clusters after combining the source counts of 51 high-redshift clusters from the MACS survey (Ebeling et al. 2001).
There is also evidence that the amplitude of the observed source overdensity increases with redshift. Cappelluti et al. (2005) recently performed the first systematic search for X-ray point source overdensities in the fields of 10 high-redshift () clusters observed with Chandra. They found that of the cluster fields showed an excess of point sources and noted a correlation between the amplitude of the overdensity in the hard band and cluster redshift. A similar conclusion was reached by Branchesi et al. (2007) who examined the fields of 18 distant clusters (). Such a correlation would be expected if AGN are indeed tracing the cosmic web near clusters, since numerical simulations tell us that a greater degree of large-scale structure should exist around dynamically younger clusters at high redshift (Colberg et al. 2000; Evrard et al. 2002).
The findings that AGN may trace the filaments which feed clusters is consistent with studies that suggest the large-scale structure surrounding clusters plays a pivotal role in driving galaxy evolution. Studies at low redshift have found that regions of intermediate density, such as the groups and filaments on the outskirts of clusters, already exhibit signs of galaxy transformation and reduced star formation rates (Lewis et al. 2002, Gomez et al. 2003). Many of the processes which have been proposed to drive this evolution, such as galaxy mergers (Barnes & Hernquist 1991) and galaxy harassment (Moore et al. 1996), may also work to funnel gas to the central regions of galaxies initiating AGN activity.
Thus far it has been difficult to conclusively establish whether AGN are triggered near clusters and to determine the processes which may be responsible because the observed overdensities are relatively mild, resulting in a limited number of confirmed, optically identified cluster AGN available for study in a single system. Superclusters offer an alternative to studying individual clusters or the AGN population of a statistical sample of clusters. These large-scale systems are comprised of several galaxy clusters and groups connected by a rich network of filamentary structure on scales of 10-100 Mpc (Bahcall & Soneira 1984; Einasto et al. 2001), thus potentially providing large samples of AGN at the same epoch. Such systems not only provide significant large-scale structure within which AGN may be preferentially found, but also a wide variety of environments and local conditions to help constrain the mechanisms most responsible for triggering their activity.
Recently Gilmour et al. (2007) used XMM-Newton observations of the Abell 901/902 supercluster at to examine the environments and optical properties of X-ray selected AGN in the system. The authors find that AGN are more prevalent in clusters than optical studies have suggested, in agreement with the results of Martini et al. (2002, 2006). They also note that AGN host galaxies are preferentially found in areas of modest galaxy density and strongly avoid the densest regions of the supercluster, concluding that there are strong correlations between AGN activity and local environment. Furthermore they find that the local densities and optical colors of the AGN host galaxies are more comparable to galaxy groups and the outskirts of clusters than filament and cluster-like environments.
While low-redshift superclusters like Abell 901/902 have been well cataloged (Bahcall & Soneira 1984; Tully et al. 1992; Einasto et al. 2001) and studied for some time (e.g. Shapley 1930), only a limited number of such systems are known at higher redshifts. These include a structure at detected in the UK Infrared Deep Survey (UKIDSS; Swinbank et al. 2007), the RCS2319+00 supercluster of three X-ray luminous clusters at (Gilbank et al. 2008), and the Lynx system at which contains at least two clusters (Nakata et al. 2005).
In this paper we report on Chandra observations of the Cl1604 supercluster at . The system is the largest supercluster mapped at redshifts approaching unity, with the most constituent clusters and groups and the largest number of spectroscopically confirmed member galaxies. We here make use of two 50 ksec pointings to examine both the diffuse emission from the system’s clusters and the properties of point sources in the two fields.
Originally detected as two rich clusters in the optical survey of Gunn et al. (1986), follow-up wide field imaging of the Cl1604 system revealed 10 distinct red galaxy overdensities within a region on the sky ( Lubin et al. 2000; Gal & Lubin 2004). Extensive spectroscopic observations confirmed that four of these overdensities were galaxy clusters with velocity dispersion greater than 500 km s-1, while an additional four were found to be poorer clusters and/or groups ( km s-1; Postman et al. 1998, 2001; Gal et al. 2005, 2008). Thus far over 1400 extragalactic redshifts have been compiled in the field of the Cl1604 system, resulting in spectra for 449 confirmed supercluster members (Gal et al. 2008).
The richest cluster in the system, Cl1604+4304, was previously observed with XMM-Newton by Lubin et al. (2004), who found the system to have a bolometric luminosity of erg s-1 and temperature of keV. The second cluster originally detected by Gunn et al. (1986), Cl1604+4321, was not detected in ROSAT observations of the system and has an luminosity upper limit in the 0.1-2.4 keV band of erg s-1 (Castander et al. 1994; Postman et al. 2001). The remaining six newly discovered clusters and groups in the supercluster have not been previously observed at X-ray wavelengths. Five of these systems fall within the field-of-view (FOV) of the Chandra observations presented here.
This study of the Cl1604 supercluster is organized as follows: In §2 we describe the X-ray observations and our data reduction procedures, as well as a summary of the optical imaging and the extensive spectroscopic dataset available for the system. §3 discusses the properties of the detected X-ray point sources, including their logN-logS distribution, optical counterparts and redshift distribution. In §4 we present the X-ray luminosities and gas temperatures of the diffuse cluster emission detected in the system, followed by a comparison of the cluster X-ray properties to cluster scaling relations. Throughout this paper we assume a CDM cosmology with , , and km s-1 Mpc-1.
2. Observations and Data Reduction
2.1. X-ray Observations
Observations of the Cl1604 supercluster were carried out with Chandra’s Advanced CCD Imaging Spectrometer (ACIS; Garmire et al. 2003) on 2006 June 23 (obsID 7343), June 25 (obsID 6933), and October 01 (obsID 6932). A summary of the observational parameters of the three datasets are listed in Table 1. The three observations consist of two pointings, one encompassing the northern portion of the system and the other the southern portion, with a overlap between the imaged regions. The aimpoints of the observations are , and , . Imaging of the northern pointing was split between two observations (obsID 7343 and 6933) with nearly identical aimpoints and roll angles, while the southern pointing was covered by a single observation (obsID 6932). Each pointing was imaged with the ACIS-I array, with the aimpoint located on the ACIS-I3 chip. The ACIS-S2 chip was also active during the observations but due to its large off-axis angle and reduced effective area we do not make use of it in this analysis. All three observations were carried out in VFAINT telemetry mode with the nominal 3.2 sec CCD frame time for a total integration of 19.4, 26.7, and 49.5 ksec for the 7343, 6933, and 6932 datasets, respectively. An examination of light curves produced in the 0.3-10 keV band shows no indication of flaring during the course of the observations.
| Target | Obs ID | Exp (s) | Obs Date | Detector |
|---|---|---|---|---|
| Cl1604-North | 6933 | 26691 | 2006 Jun 25 | ACIS-I0123 |
| Cl1604-North | 7343 | 19412 | 2006 Jun 23 | ACIS-I0123 |
| Cl1604-South | 6932 | 49478 | 2006 Oct 01 | ACIS-I0123 |
All three datasets were reprocessed and analyzed using standard CIAO 3.3 software tools and version 3.2.2 of the Chandra calibration database available through Chandra X-ray Center (CXC)111http://cxc.harvard.edu/. New level 1 event files were produced using the acis_process_events script, which makes use of the latest gain files and corrects for the effects of time-dependent variations and charge transfer inefficiencies (CTI) in the ACIS CCDs. Level 2 event files were produced by filtering on standard ASCA grades (grades=0,2,3,4,6), good status bits (status=0), and Good Time Intervals (GTIs) supplied by the pipeline. We checked the relative astrometry between the three event files using the positions of 14 high signal-to-noise sources in the overlap region between the two pointings and found the astrometric errors to be negligible. Images for use in object detection and the examination of extended cluster emission were created from the event lists in the 0.5-2 keV (soft), 2-8 keV (hard) and 0.5-8 keV (full) X-ray bands with the standard 0.492 pixel binning. To account for vignetting, CCD gaps, and telescope dither effects we created spectrally-weighted, energy dependent exposure maps in each of the three bands assuming a power-law source spectrum with a photon index set to the slope of the X-ray background in the 0.5-8 keV band, (Tozzi et al. 2001, Kushino et al. 2002).
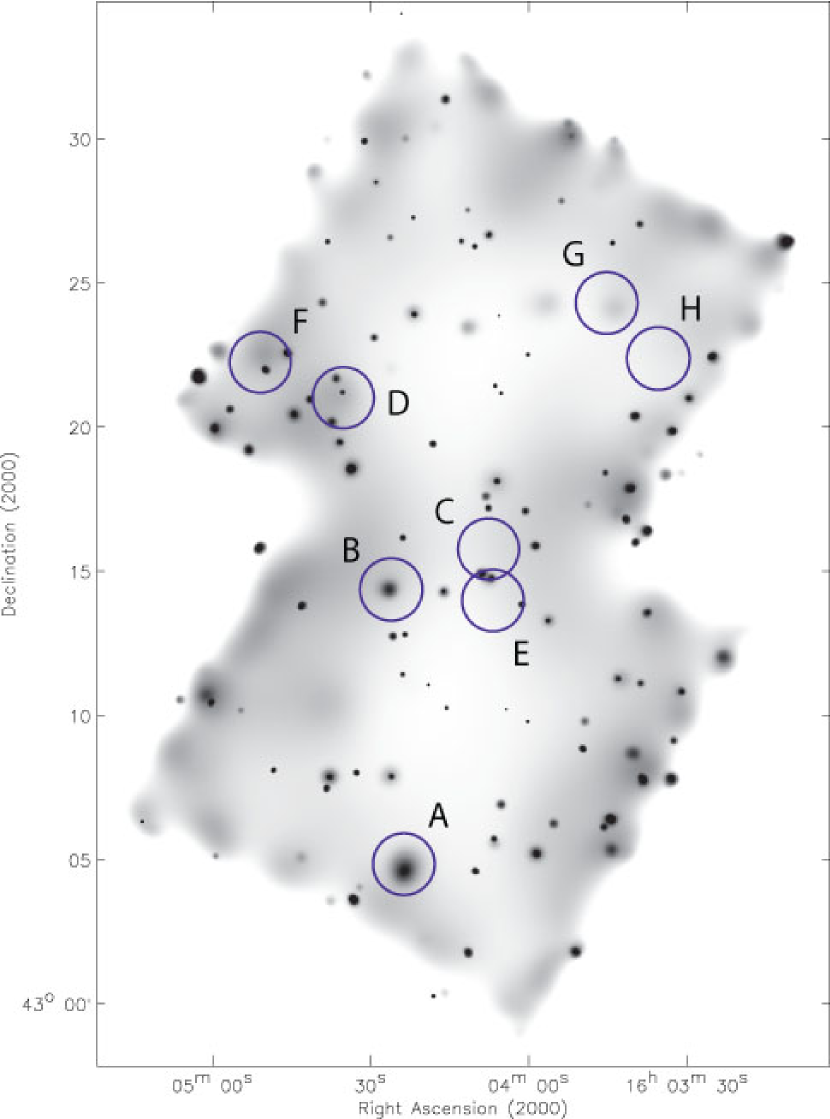
An adaptively smoothed, exposure corrected mosaic of the Cl1604 supercluster in the soft band is shown in Figure 1. The mosaic was constructed by reprojecting each event file to the tangent point , with the reproject_events task in CIAO and combining the resulting files. Exposure variations and vignetting were corrected for using a composite exposure map constructed by reprojecting and combining our individual exposure maps with the reproject_image_grid task.
It should be noted that since the aimpoints and roll-angles for the 7343 and 6933 observations are nearly identical, we have reprojected and combined the images and exposure maps of these pointings and treat the combination as a single observation throughout our analysis. Hereafter we refer to the composite pointing as Cl1604-North, while the 6932 observation will be referred to as Cl1604-South. Also, in what follows we largely work separately with the Cl1604-North and Cl1604-South datasets as opposed to the composite mosaic.
2.2. Optical Imaging
Our optical data of the system consists of two pointings of the Large Format Camera (LFC) on the Palomar 5-m telescope and 17 pointings of the higher-resolution Advanced Camera for Surveys (ACS) on the Hubble Space Telescope (HST). Details of these observations and subsequent data reduction are presented in Gal et al. (2005, 2008) and Kocevski et al. (2008) and are only briefly discussed here.
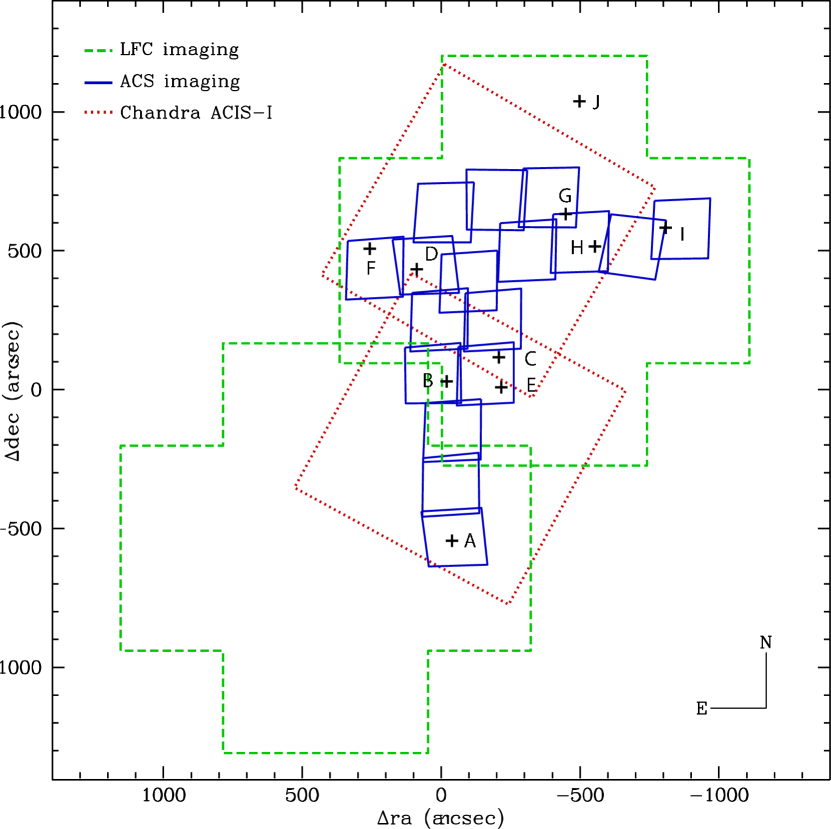
The LFC is a mosaic camera of six CCDs with a pixel scale of 0.182 ′′/pixel, resulting in an unvignetted FOV that is roughly circular with a 24′ diameter. We imaged two pointings in the field of Cl1604 using the Sloan Digital Sky Survey (SDSS) , , and filters, reaching a depth of 24.4, 24.2, and 23.2 mag in each band, respectively. The area imaged by the two LFC pointings relative to our ACIS-I imaging is shown in Figure 2. The ACS camera consists of two CCDs with a pixel scale of 0.05 ′′/pixel, resulting in a FOV. Our ACS imaging is comprised of a 17 pointing mosaic designed to image nine of the ten galaxy density peaks observed in our LFC imaging of the supercluster. An outline of the mosaic is shown in Figure 2. Observations were taken in both the F606W and F814W bands, resulting in completeness depths of mag in each band. The astrometry of the 17 pointings were fixed to that of the USNO-B catalog (Monet et al. 2002) so as to match our LFC imaging and the final images were resampled to a pixel scale of 0.03′′/pixel. Source catalogs were produced from both the LFC and ACS imaging in each of the five bands observed using the SExtractor routine (Bertin & Arnouts 1996) and cross-correlated to produce a single, composite optical catalog. An outline of the region covered by our optical imaging relative the ACIS-I observations is shown in Figure 2.
2.3. Optical Spectroscopy
The Cl1604 supercluster has been extensively mapped using the Low-Resolution Imaging Spectrograph (LRIS; Oke et al. 1995) and the Deep Imaging Multi-object Spectrograph (DEIMOS; Faber et al. 2003) on the Keck 10-m telescopes (Oke, Postman, & Lubin 1998; Postman, Lubin, & Oke 1998; Lubin et al. 1998; Gal & Lubin 2004; Gal et al. 2008). The complex target selection, spectral reduction, and redshift measurements are described in detail in Section 3 of Gal et al. (2008). The final spectroscopic catalog contains 1,618 unique objects. Redshifts derived for these objects are given a spectroscopic quality, , between 1 and 4, where 1 indicates a secure redshift could not be determined due to poor signal, lack of features or reduction artifacts, 2 is a redshift obtained from either a single feature or two marginally detected features, 3 is a redshift derived from at least one secure and one marginal feature, and 4 is assigned to spectra with redshifts obtained from several high signal-to-noise features.
In this sample, we find 202 stars and 1,381 extragalactic objects with redshifts of . A total of 449 galaxies are in the nominal redshift range of the supercluster between . This extensive spectroscopic database is larger by a factor of than that for any other known moderate-to-high redshift supercluster.
3. Point Source Properties and Number Counts
3.1. Object Detection and Photometry
We searched for point sources in the field of Cl1604 using the wavelet-based wavdetect procedure in CIAO. We employed the standard i series of wavelet pixel scales, with . These scales are the radius of a Mexican Hat function in pixels with one pixel = . We also adopted a minimum exposure threshold of 20% relative to the exposure at the aimpoint of the observation and a threshold significance for spurious detections of . The latter implies less than one false detection per ACIS chip (which contain pixels at full resolution), or roughly eight false detections over our entire field of view (Freeman et al. 2002). Object detection was carried out on the unvignetting-corrected, full resolution images of the northern and southern pointings seperately and in each of the soft, hard and full X-ray bands. The positions of the detected sources were then cross-correlated to produce a multi-band source list for each pointing. We set the final position of each source in this composite list to the measured position in the band within which the source was detected with the greatest significance. With no cut on significance, we detect a total of 99, 49, and 93 point sources in the soft, hard, and full bands, respectively, in the northern pointing and 117, 54, and 105 sources in the same bands for the southern pointing. Our detections are summarized in Table 2. In total, 265 unique sources were detected in the two pointings of the Cl1604 system, of which 161 had detection significances greater than in at least one X-ray band.
| Cl1604 | Soft1 | Hard2 | Full3 | Total Uniq. |
|---|---|---|---|---|
| Pointing | All () | All () | All () | All (4) |
| North | 99 (66) | 49 (44) | 93 (75) | 123 (85) |
| South | 117 (67) | 54 (42) | 105 (75) | 147 (90) |
| North+South | 203 (120) | 94 (77) | 184 (136) | 256 (161) |
Note. — 1 0.5-2 keV; 2 2-8 keV; 3 0.5-8 keV; 4 detection in at least one band
Properties of the detected point sources, including count rates and detection significances, were determined with follow-up aperture photometry on all sources found by wavdetect. The apertures used were defined so as to contain 95% of the flux from a given point source. As the Chandra PSF is dependent on both energy and off-axis angle, we determined the 95% enclosed energy radius, , at the position of each source using the PSF libraries in the Chandra calibration database. This was done at 1.49 and 4.51 keV for photometry in the soft and hard bands, respectively. The radius of the resulting apertures at 1.49 keV ranged from on-axis to at off-axis, the distance of our most off-axis source; the latter increased to at 4.51 keV. The background near each source was determined in an annulus extending from 1.2 to 2.4 , with appropriate masking of nearby sources when necessary. We carried out the photometry on the vignetting-corrected, soft- and hard-band images of both pointings and an aperture correction of was applied to the background-subtracted net counts of each source. Counts in the full band were then determined as a sum of the measured net counts in the soft and hard bands.

As the low number of counts for many of the detected sources are not favorable to a full spectroscopic analysis, we determined the soft- and hard-band fluxes of each source by normalizing a power-law spectral model to the net count rate measured for each source. These rates were determined by dividing the net counts measured in the vignetting-corrected images by the nominal exposure time at the aimpoint of each observation. We assumed a photon index of for the power-law model and a Galactic neutral hydrogen column density of cm-2 (Dickey & Lockman 1990), resulting in a count rate to unabsorbed-flux conversion factor of erg cm-2 cnts-1 and erg cm-2 cnts-1 in the soft and hard bands, respectively. Full-band fluxes were again determined by summing the flux in the soft and hard bands.
Properties for the 161 unique sources detected with at least a significance in the field of Cl1604 are listed in Table 3. The table includes source IDs (Column 1), right ascensions and declinations (Columns 2-3), positional errors determined using the empirical relationships of Kim et al. (2007; Column 4), aperture-corrected, net counts above the background in the soft, hard and full bands (Columns 5-7), X-ray fluxes in all three bands in units of erg s-1 cm-2 (Columns 8-10), detection significances measured as
| (1) |
(Column 11-13), hardness ratios measured as where and are the net counts in the hard and soft bands, respectively (Column 14), and a three letter string indicating the bands in which the source was detected, with S, H and F indicating the soft, hard and full bands, respectively (Column 15).
3.2. Log N - Log S
To investigate whether an excess of unresolved X-ray sources exist in the field of Cl1604 relative to fields without such a structure we have calculated the cumulative source number counts, , as described by Gioia et al. (1990) using
| (2) |
Here is the total number of detected point sources and is the sky area in square degrees sampled by the detector down to the flux of the th source. The variance of the number counts was in turn calculated as
| (3) |
Determining for a given Chandra observation is complicated by the fact that the flux limit across the ACIS-I array varies due to vignetting and PSF degradation as a function of off-axis angle. In order to calculate we constructed a flux limit map using a similar method to that employed by Johnson et al. (2003) and Cappelluti et al. (2005). First, all point sources detected by wavdetect (at all significance levels) in our two pointings were replaced with an estimate of the local background with the CIAO tool dmfilth. These images were then binned to a pixel scale of /pixel to produce a coarse background map. Given Equation 1, the flux limit, , for a point source detection in any one pixel is then
| (4) |
where is the background level in counts, is the sky area covered by one binned pixel, is the aforementioned 95% enclosed energy radius used for our aperture photometry, is a vignetting correction factor, is the count rate to flux conversion factor, and is the exposure time at the aimpoint of the observation. The values for are determined for each pixel given its off-axis angle, while is estimated by normalizing an exposure map to its maximum value at the aimpoint of the observation. Using this flux limit map we can calculate by summing the sky area covered by all pixels with equal to or greater than the flux of the th source. An important point to note is that we have not removed or masked any diffuse cluster emission and have instead treated it as an enhanced local background in constructing the flux limit map. This allows us to properly account for the fact that our flux limit for point source detection is effectively increased in the presence of diffuse emission when we calculate the corrective weights.
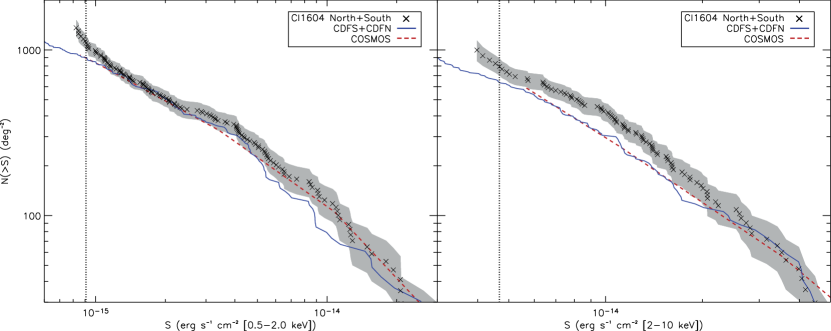
The combined cumulative source number counts for the northern and southern pointings of the Cl1604 supercluster are shown in Figure 4. The distribution is shown in the 0.5-2 keV (left panel) and 2-10 keV (right panel) bands. The latter was chosen to ease comparison with previous studies and was obtained by extrapolating our 2-8 keV fluxes to 10 keV; we refer to 2-10 keV band as the hard10 band hereafter. Also shown are the cumulative number counts measured in the COSMOS field (Scoville et al. 2007) and the combined counts obtained in the Chandra Deep Field South and North (CDFS and CDFN; Rosati et al. 2002; Brandt et al. 2002). The COSMOS results are those of Cappelluti et al. (2007) converted to a spectral index of , while the combined CDFS and CDFN counts are the result of our own reanalysis of two single pointings in each field. Data for these fields were obtained from the Chandra archive222http://cxc.harvard.edu/ and analyzed in an identical manner to that of the Cl1604 field. The two pointings used have observation ID numbers of 581 and 2232; each is a single pointing of the ACIS-I array with exposure times of roughly 130 ksec. We have combined the number counts obtained for each field separately into a unified reference field (hereafter CDF) to which we compare our source counts throughout.

In the soft band we find that the number of sources detected in the Cl1604 pointing and the composite blank field are statistically consistent ( difference) over a majority of the sampled flux range. The greatest deviation of the Cl1604 counts is observed at erg s-1 cm-2, where we find a excess in the supercluster field relative to the CDF counts. This is likely due to the underdensity of soft sources previously reported at these fluxes in the CDFS (Yang et al. 2003) which suppresses the combined CDF number counts at this flux. When our measured source density is compared to that of the COSMOS field, which covers a significantly larger area than the CDFS, we find excellent agreement at the bright end of the distribution. We also observe a deviation from both the CDF and COSMOS fields near our flux limit, but we caution that at these fluxes the source counts are heavily weighted due to a rapidly decreasing sky coverage. At a flux of erg s-1 cm-2 the effective detector area drops to 20% of the total ACIS-I FOV. As is common in the literature, we adopt this flux as our effective minimum for this analysis; the flux is denoted by a vertical dotted line in Figure 4.
Unlike the general agreement found between the supercluster and blank field counts in the soft band, we find that the source density in the hard10 band significantly surpasses the density measured in both the reference and COSMOS fields. As a result of a steeper power-law slope, the Cl1604 counts deviate from the blank field distribution near and reach a maximum excess at erg s-1 cm-2, where we find a overdensity relative to the CDF counts. Below this flux a break in the source counts is observed and the slope of the distribution flattens, reducing the difference between the supercluster and blank field counts. At our 20% FOV flux limit of erg s-1 cm-2 the excess is reduced to a deviation.
To parameterize our cumulative flux distribution, we have fit the unbinned soft- and hard10-band counts in the Cl1604 field with a power-law model of the form
| (5) |
using the maximum likelihood method described by Crawford et al. (1970) and Murdoch et al. (1973). The normalization, , was determined by requiring that the best fit slope, , reproduce the number of sources observed at the flux limit. Our best-fit single power-law model in the soft band is
In the hard10 band there is a clear break at erg s-1 cm-2, below which the slope of the distribution flattens, in qualitative agreement with previous deep Chandra and XMM surveys (Brandt & Hasinger 2005). Performing a maximum likelihood fit to the bright-end counts above the break, we obtain a power-law model of
Our best-fit slope of over the flux range of to erg s-1 cm-2 is significantly steeper than the slopes found over similar fluxes in the CDFN (; Brandt et al. 2002) and the CDFS (; Rosati et al. 2001). This difference in the slope of the cumulative distribution is responsible for building up the source excess observed at erg s-1 cm-2.
It appears that over the FOV of nearly two full ACIS-I pointings covering the Cl1604 supercluster we find no significant excess of soft X-ray sources relative to a blank field, but a clear overdensity of harder, presumably more obscured sources is detected. Cappelluti et al. (2005) previously reported a correlation between the amplitude of the overdensity observed in the hard10 band and cluster redshift. Normalizing our observed source density to the mean amplitude of their reference field counts at erg s-1 cm-2, we find the Cl1604 field exhibits a factor 1.47 overdensity of hard10-band sources. In Figure 5 we plot the overdensity amplitude as a function of cluster redshift observed by Cappelluti et al. (2005) along with the overdensity amplitude in the Cl1604 field. We find that the Cl1604 counts are in excellent agreement with their best-fit linear relation.
It has also been noted that the observed field-to-field variation in the hard band is substantially above the level expected due to Poisson noise (Cowie et al. 2002), suggesting the variations are due to intrinsic clustering of the population and their tracing of underlying large-scale structures. If the excess sources we have detected are associated with the Cl1604 supercluster then this observation, along with the fact that we do not see such an overdensity in the soft band, seems to support the notion that more obscured, harder X-ray sources are more highly biased tracers of LSS than their softer counterparts. This issue has been debated with Yang et al. (2003) and Basilakos et al. (2004) finding an increased angular clustering amplitude of hard-band sources while Gilli et al. (2005) and Yang et al. (2006) find no dependence of the clustering scale length with X-ray spectral shape (see also Miyaji et al. 2007).
Finally, it is important to stress two points regarding the nature of the observed overdensity. First, if the excess sources are at the supercluster redshift of , then their luminosities strongly suggest the sources are AGN as opposed to powerful starburst galaxies. For example, a source detected at our flux limit would have a rest-frame 0.5-8 keV luminosity of erg s-1, far above the luminosity attributable to starburst galaxies (e.g. Bauer et al. 2002), making it highly unlikely that the source overdensity is due to increased starburst activity in the supercluster. Secondly, we point out that the observed overdensity persists over nearly two full ACIS-I pointings. Previously reported source overdensities have often been presented on a chip-by-chip basis (; e.g. D’Elia et al. 2004, Cappelluti et al. 2005). On such scales Poisson noise may contribute a significant signal to fluctuations observed in the source counts (Cappelluti el al. 2007). In fact Cappelluti et al. (2005) note that their observed excesses disappear when their source counts are integrated over an entire ACIS-I FOV. This is in agreement with Kim et al. (2004b) who find no statistically significant difference between cluster and cluster-free fields on scales of . The fact that our larger FOV has not smoothed away our observed overdensity suggests the increased amplitude is not due to a statistical fluctuation, but instead due to sources which are indeed associated with the supercluster, whose constituent clusters extend over the entire FOV of the two pointings. In §3.4 we bolster this claim with evidence for a peak in the redshift distribution of X-ray sources near that of the Cl1604 system.
3.3. Matching to Optical Sources
To determine the origin of the overdensity observed in the number counts and to ascertain whether the sources are truly associated with the Cl1604 supercluster we searched for optical counterparts to all 161 unique point sources detected in the field of Cl1604 above the level in at least one of the three X-ray bands. Matching of our X-ray source list to the LFC+ACS optical catalog was carried out using the maximum likelihood technique described by Sutherland & Saunders (1992) and more recently implemented by Taylor (2005) and Gilmour et al. (2007). The method gauges the likelihood that a given optical object is matched to an X-ray source by comparing the probability of finding a genuine counterpart with the positional offset and magnitude of the optical candidate relative to that of finding a similar object by chance. The key statistic used is the known as the likelihood ratio, , which specifies the likelihood that X-ray source is associated with optical object . If we assume a Gaussian form for the probability distribution of the X-ray positional errors, it can be defined as
| (6) |
where is the positional offset between optical object and X-ray source , is the number density of optical objects brighter than object in the F814W () band in the ACS (LFC) catalog, and is the positional error associated with X-ray source .
The advantages of this approach over a simple nearest neighbor match is that takes into account the density of objects as faint as the optical counterpart as well as the distance between sources and the X-ray positional errors. This is vitally important when matching to a source list drawn from deep, high-resolution ACS imaging, which has an extremely high surface density of faint sources. Without consideration of magnitude an inordinate number of X-ray sources would be matched to optical objects near the detection limit of the catalog. Instead, when surface density is taken into account, brighter sources, which are rarer in the optical catalog, are given an increased likelihood of being a genuine counterpart to an X-ray source compared to fainter sources with the same positional offset.
We considered an optical source a candidate counterpart if it fell within the error circle of an X-ray source and calculated for each candidate-X-ray pair. Since the Chandra PSF degrades with increased distance from the aimpoint of the observation, the positional uncertainty associated with each X-ray source depends on its off-axis angle. To account for this effect we have determined the errors on our X-ray positions using the empirically derived relations of Kim et al. (2007), who find that centroiding errors increase exponentially with off-axis angle and decrease as the source counts increase with a power-law form. To simplify the calculation of we have assumed that any optical positional errors are negligible compared to the larger X-ray uncertainties, which ranged from on-axis to at off-axis for a source detected with 10 counts333The quoted errors are at the 95% confidence level.
To calculate for a given optical counterpart, we determined the magnitude distribution of sources in the same subset of the composite optical catalog from which the candidate source was drawn. If the source fell within the boundaries of the ACS mosaic, was determined from the density and magnitude distribution of ACS detected objects. A similar procedure was used for sources only detected in the LFC imaging.
While provides the likelihood that X-ray source is associated with optical object , the ratio itself does not provide an estimate of the reliability of a given match. This can be obtained by comparing the value of for a particular match to the distribution of values for chance matches. We determined the latter by randomizing the positions of each X-ray source 10000 times and recording the distribution of values for the resulting chance matches to optical sources. Again, this process was done separately for X-ray sources falling within and outside the ACS imaging. Following Gilmour et al. (2007), the reliability of a match was defined as the probability of not obtaining randomly,
| (7) |
where is the number of chance matches in our Monte Carlo simulation with likelihood ratios that exceeded . Here is essentially the binomial probability that a given match with a specific value of is a true association and not a chance match.
Given the relatively large X-ray positional uncertainties and the high source density in our ACS imaging, there are often several candidate counterparts to any given X-ray source and many of these can have high reliability estimates. Following Rutledge et al. (2000) we can use to determine which optical candidate is the genuine counterpart and the probability that there is instead no genuine counterpart. Since is the the probability that a given match is a true association, the probability that optical source is the genuine counterpart to X-ray source is
| (8) |
Here is the total number of optical candidates and is a normalization factor defined below. is simply the product of the probability that the th optical object is a true association () with the probabilities that the remaining optical candidates are not (). Likewise, the probability that there is no genuine counterpart given candidates is
| (9) |
where is a normalization factor that varies for each source to insure that the probabilities and sum to unity.
Following Gilmour et al. (2007), we consider an X-ray source with a single candidate counterpart to be matched to a given optical object if for objects in the ACS catalog (i.e. the probability for a genuine match is four times that of a null match). This cutoff was reduced to 0.75 for matches with LFC objects to include several well aligned sources near the completeness limit of the LFC catalog. For sources with more than a single candidate counterpart, the genuine optical match was defined as the source with and , where is the set of optical candidates. If no single candidate fulfilled this requirement, yet their summed probabilities exceeded 0.8, we considered all optical objects with as possible counterparts.
Using this prescription we have matched 100 X-ray sources with unique optical counterparts found in a our LFC and ACS imaging of Cl1604. An additional 11 sources were found to have two candidate counterparts, while one source is matched to three optical candidates. A remaining 49 X-ray sources were found to have no likely optical counterpart within the limits of our optical imaging. The X-ray and optical coordinates of the matched sources are listed in Table 4. The table includes source IDs (Column 1), X-ray centroids (Columns 2-3), optical centroids (Columns 4-5), the probability the given X-ray source has an optical counterpart (; Column 6), the probability that the given optical source is the genuine counterpart (; Column 7), redshift (Column 8), and the value for the derived redshift (Column 9).
3.4. Supercluster Members
As described in §2.3, our extensive spectroscopic database contains redshifts for 1381 galaxies and spectra of 202 stars in the field of the Cl1604 supercluster. Of the 125 optical sources matched to our X-ray catalog, a total of 42 have spectroscopic information available. All but two of these are sources considered genuine optical matches using the criteria put forth in §3.3, while the remaining pair are both one of two candidate counterparts to their respective X-ray source. We have derived reliable redshifts with for 35 of the 42 sources which have spectroscopy. While redshifts for all 42 sources are listed in Table 4, we only make use of the 35 redshifts for the following discussion.

We find that one of the X-ray sources has a clear stellar spectrum, while the remaining 34 sources are extragalactic covering the redshift range . The redshift distribution of the extragalactic sources is shown in Figure 6. The distribution exhibits a clear peak at z=0.9, the average redshift of the Cl1604 supercluster. A total of 9 sources have redshifts between and fall within the traditional redshift boundaries of the supercluster as defined by Gal et al. (2004). An additional 6 are found in the immediate foreground of the system between and another 2 are found immediately behind the supercluster at . The remaining sources are high redshift (10 at ) or foreground sources (9 at ) seen in projection.
We find that 4 of the 9 supercluster members have hard10-band fluxes between 1 and 2 erg s-1, the flux range where the source excess is observed. The same is true for 2 of the 6 sources in the immediate background and foreground of the supercluster, 4 of the 9 sources at and 3 of the 10 sources at . Combined, these sources account for 31% of the sources that contribute to the overdensity, leaving an additional 29 sources with hard10-band fluxes between 1 and 2 erg s-1 for which we do not yet have measured redshifts.
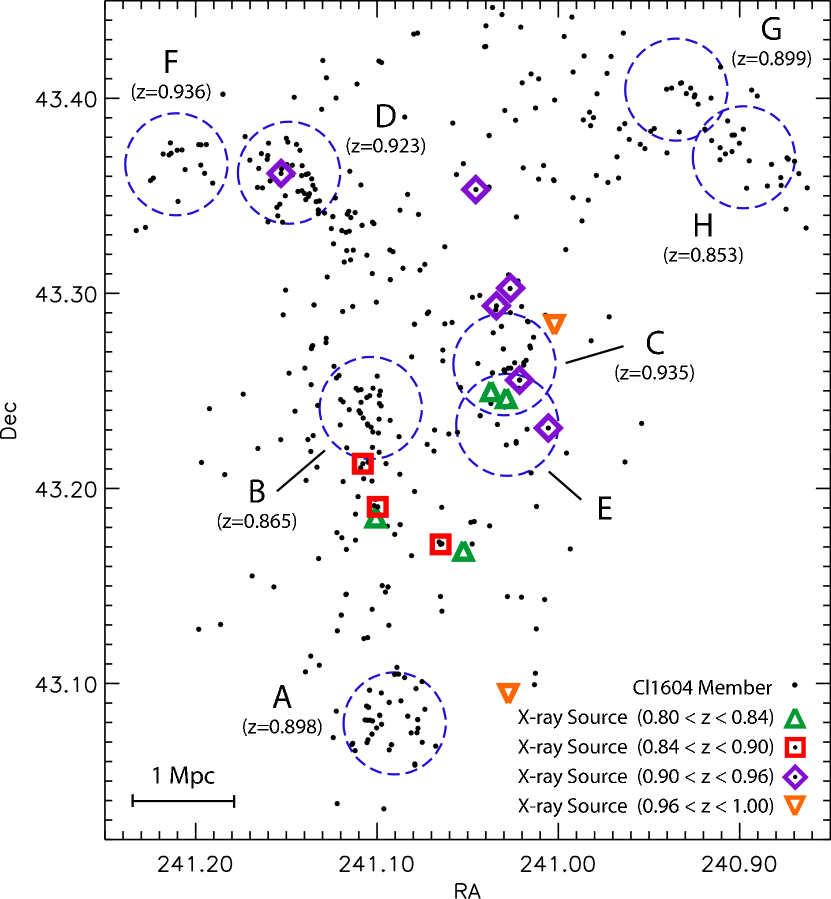
In Figure 7 we plot the spatial distribution of the 9 supercluster members and the additional 6 sources that fall in the immediate foreground and background of the supercluster which may be associated to the large-scale structure of the system. Also shown are the locations and systemic redshifts of individual clusters in the system. We find 3 supercluster members associated with Cl1604+4314 (hereafter Cluster B) at ; the two sources closest to the cluster center have nearly identical redshifts to that of the cluster (, while the one with the greatest projected distance is at a higher redshift (). The two sources found in the foreground of Cluster B are themselves clustered in redshift space at . Near Cl1604+4316 (Cluster C) at we find 4 nearby sources that are associated in redshift space having . An additional source is located in the foreground of the cluster at . In Cl1604+4321 (Cluster D) we find one source with a redshift identical to that of the systemic cluster redshift of .
Despite extensive spectroscopic coverage of Cl1604+4304 (Cluster A) we find no sources associated with the system. The cluster is the richest system in the Cl1604 association and it is also the most X-ray luminous. We also do not find any sources near the center of Cluster B, with the nearest source roughly 1 Mpc from the cluster center. As we discuss in §4, these systems are the only clusters for which we detect diffuse emission. Although this emission effectively raises our point source detection threshold in the soft band, the emission is relatively low-level and would only mask the faintest of sources. For example, in the center of Cluster A we find that the flux limit for a detection rises to erg s-1 in the soft band. Therefore, the diffuse emission from these systems does not prevent us from detecting bright point sources in the soft band, nor does it effect our ability to detect sources in the hard band, yet none are found, either with wavdetect or by visual inspection. This is quite unlike Clusters C and D, in which we find sources near the center of each system (both in projection and redshift space). This observation is consistent with the results of Gilmour et al. (2007) who found AGN avoided the densest regions of the low redshift supercluster Abell 901/902.
It is interesting to note that Gal et al. (2008) found that Clusters B and D showed evidence for velocity segregation in the redshift distribution of their member galaxies, indicating they may have undergone a recent merger event or have a significant population of actively accreting galaxies. This is quite unlike Cluster A, which is the most relaxed system in the supercluster. The difference in the dynamical activity of Clusters A and B indicate the global properties of these systems may affect the level of AGN activity observed in each cluster. In a forthcoming paper we will discuss the environments and optical properties of the supercluster members in greater detail, including the local galaxy density near the host galaxies and the global properties of the clusters within which they reside. This future study will further explore the possibility that cluster properties, such as increased dynamical activity or the presence of a significant intracluster medium (ICM), can affect the level of AGN activity observed in a system.
4. Diffuse X-ray Emission
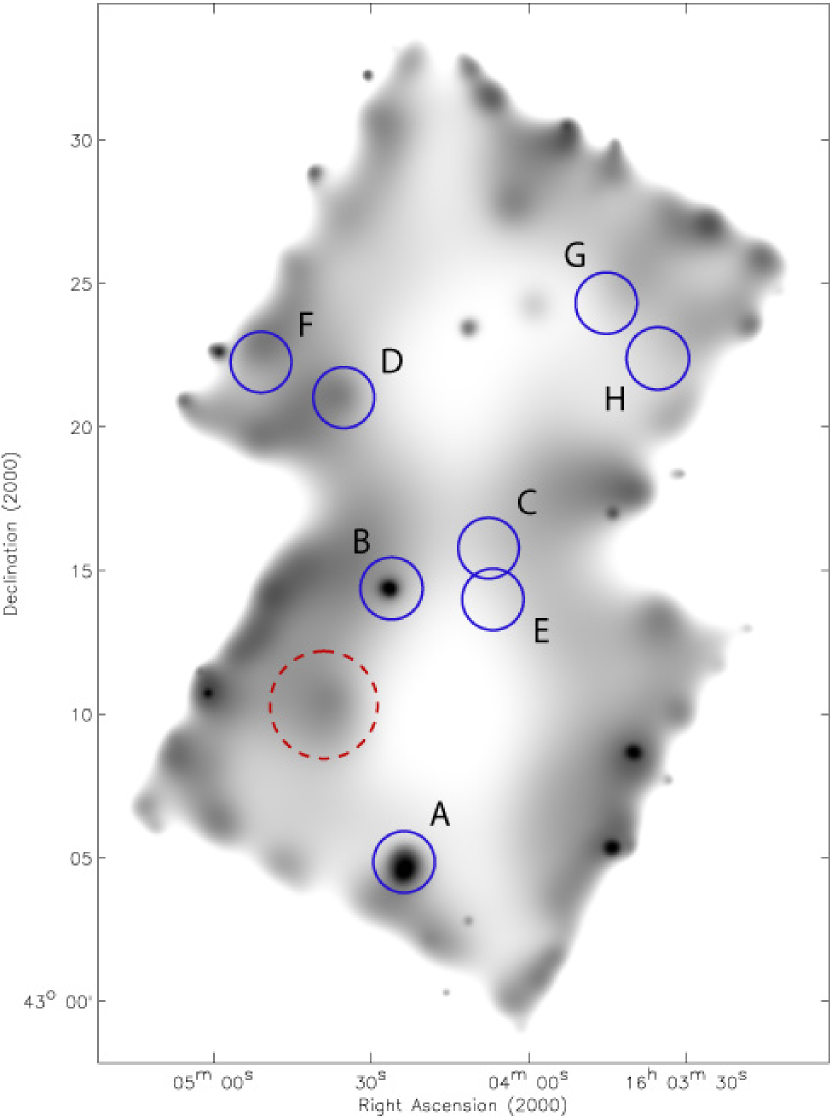
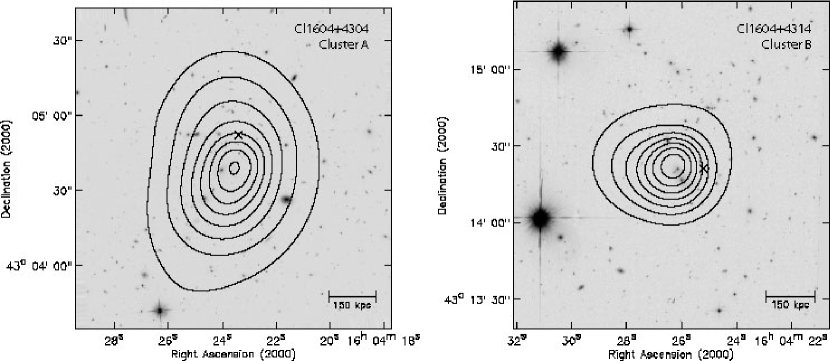

A total of 10 red galaxy overdensities were detected in our LFC imaging of the Cl1604 field (Gal et al. 2008), of which 8 fall within the FOV of our ACIS-I imaging. The optical properties and velocity dispersions of these galaxy clusters and groups are discussed in detail in Gal et al. (2005, 2008). We searched for diffuse X-ray emission at the location of each overdensity and found significant () emission above the background near clusters Clusters A and B. An increased X-ray background in the soft band was detected near Cluster D and Cl1605+4322 (hereafter Cluster F), but at a much reduced significance level. For Cluster C, Cl1604+4324 (Cluster G), and Cl1604+4322 (Cluster H), we find no emission in excess of the background. The galaxy overdensity Cl1604+4314B (system E), which is likely a superposition of supercluster members at various redshifts (see Gal et al. 2008), is also not detected as expected. The diffuse emission detected from the Cl1604 systems is shown in Figure 8, which displays an adaptively smoothed, soft-band image of the supercluster field where we have replaced all point sources detected by wavdetect with an estimate of the local background using dmfilth prior to smoothing. Contours of the X-ray emission from Clusters A and B are also plotted overtop HST-ACS imaging of the systems in the F814W-band in Figure 9.
To quantify the extent, count rate and significance above the background of the emission from Clusters A and B we employed a growth curve analysis on the soft-band counts from each cluster. Azimuthally averaged surface brightness profiles were constructed for each system by summing the counts in annuli centered on the peak of the diffuse emission. The background level of each field was then set to the median of the source-free, outer portions of the profile. A cumulative net count profile was then constructed by measuring the counts in successively larger apertures centered on the diffuse emission and subtracting an appropriately scaled background. We take the total number of counts originating from the cluster to be the level at which the cumulative profile ceases to grow. The cumulative net count profiles for the two clusters are shown in Figure 10. We detect a total of 133.9 and 76.3 net counts444The quoted values are vignetting corrected counts above the background in the soft band within an extent of and (0.62 and 0.39 Mpc) from Clusters A and B at a significance level of and , respectively.
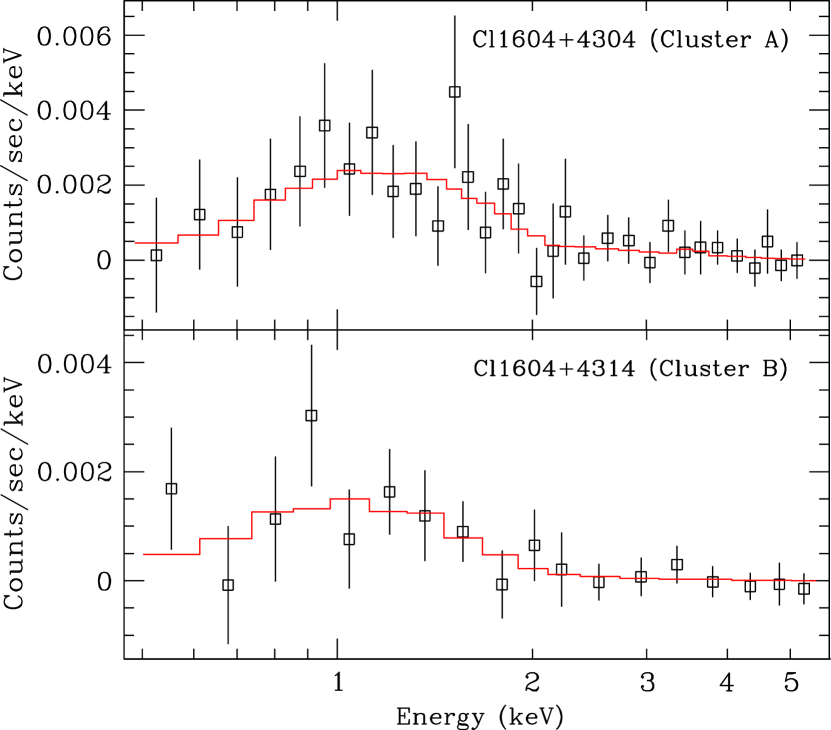
Despite the low number counts, we determined the temperature and X-ray luminosity of each system by fitting a Raymond-Smith thermal plasma model to the energy spectra of the diffuse emission. The spectra were extracted out to the measured extent of each system with the CIAO task specextract and the background was measured in a local annulus surrounding the extraction region. The spectra were grouped to contain at least 15 counts per bin and fit with the Sherpa package using a statistic with the Gehrels (1986) approximation of errors given the low number counts. The metal abundance was fixed at 0.3Z⊙ and only the temperatures of the systems were allowed to float. The fit was carried out over 0.3-8 keV, but we found our results to be robust against variations to this energy range. Our extracted spectra and resulting best-fits are shown in Figure 11. We find temperatures of and keV for Clusters A and B, respectively; the estimated confidence intervals are and were derived through projection of the statistic surface using the proj task in Sherpa. Cluster A was previously observed with XMM-Newton and we find that our best-fit temperature for the system is higher than the keV reported by Lubin et al. (2004), but consistent given the errors on both estimates. The resulting bolometric luminosities for Cluster A and B are and erg s-1, respectively, within an extent of and . If we assume the cluster surface-brightness profiles follow a -model with the canonical parameters and kpc, the measurement apertures enclose 90.9% and 70.5% of the total flux out to the radius of each cluster. We determined as using the velocity dispersions measured by Gal et al. (2008); the resulting radii are and . Extrapolating the observed emission out to , Clusters A and B have bolometric luminosities of and erg s-1, respectively. Our best-fit temperatures and the resulting fluxes and luminosities of the two clusters are summarized in Table 5.
The remaining five clusters show no statistically significant emission in excess of the background and are therefore treated as non-detections. We calculated upper limits to the counts from each system as the Poissonian fluctuation of the background measured within a 0.5 Mpc radius aperture centered on the system’s optical centroid from Gal et al. (2008). While we do observe a slightly increased background at the positions of Clusters D and F, the measured counts are less than that expected from a Poissonian fluctuation, therefore we treat both systems as non-detections. The upper limit to the counts from each cluster is listed in Table 5. We converted count rates to flux by normalizing a Raymond-Smith thermal plasma model in Sherpa to the measured upper limits for each system, with the appropriate instrument response files obtained using specextract at the location of each cluster. We assumed a metallicity and a temperature of 2 keV for all systems. The resulting upper limits to the flux and luminosities of each system are listed in Table 5. We note that had we iteratively solved for the cluster temperatures using the relationship as opposed to using a fixed 2 keV value, the resulting temperatures would have ranged from 2.4-2.6 keV. The change would reduce our luminosity upper limits by less than 1%.
4.1. Cluster Scaling Relations
It was previously reported by Lubin et al. (2004, hereafter L04) that Cluster A and the optically selected cluster Cl1324+3011 at were found to be underluminous compared to their high-redshift, X-ray selected counterparts with similar galaxy velocity dispersions. The systems were also found to deviate from the relationship at the level, exhibiting significantly cooler ICM temperatures than expected from local scaling relationships. These observations hinted at the intriguing possibility that optical cluster selection at high redshift may preferentially select younger systems that have yet to to assemble a significant ICM or undergo a major phase of non-gravitational heating. In this section we revisit this issue using the results of our Chandra observations and newly determined velocity dispersions for the Cl1604 systems from Gal et al. (2008).
The Relation
If the thermodynamics of a cluster’s ICM is governed solely by gravitational processes, the self-similar description of clusters predicts X-ray luminosity should scale with ICM temperature as , given the gas radiates via bremsstrahlung emission (Kaiser 1986). Furthermore, the evolution of this relationship is expected to follow the evolution of the Hubble parameter which goes as:
| (10) |
In actuality, several studies have shown that clusters exhibit hotter ICM temperatures than expected from the self-similar relationship, suggesting non-gravitational processes such as AGN feedback have injected energy into the systems. Low-redshift cluster surveys have found the relationship follows a form closer to (Markevitch 1998; Xue & Wu 2000; Vikhlinin et al. 2002). On the other hand, although clusters do not obey the predicted relationship, studies show the evolution of the correlation does indeed follow the expected self-similar evolution. Maughan et al. (2006) have shown that when self-similar evolution is taken into account, the properties of X-ray selected WARPS clusters out to agree with the low-redshift relationship, indicating the processes which heat the ICM beyond the self-similar prediction occur at an even earlier epoch or in dynamically younger clusters (see also Vikhlinin et al. 2002 and Hicks et al. 2006).
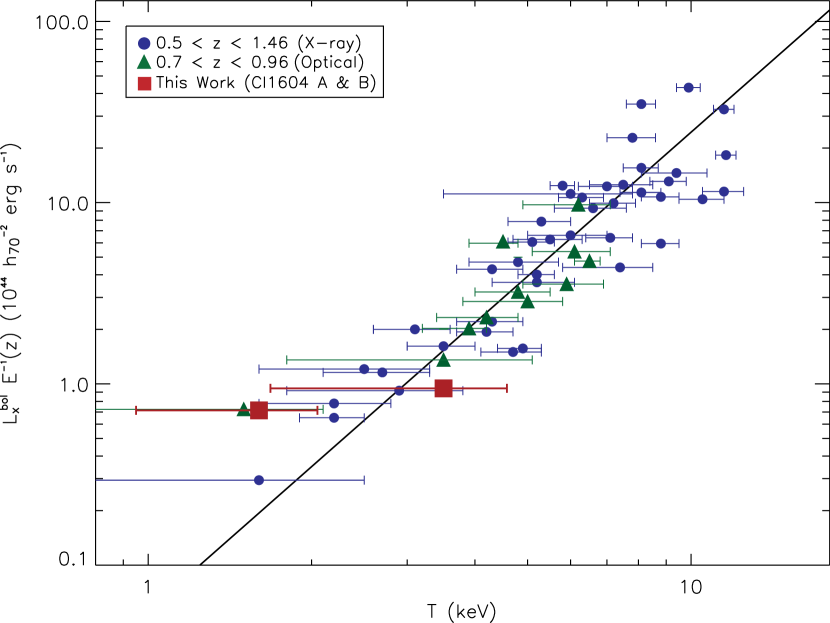
In Figure 12 we plot the bolometric X-ray luminosity of Clusters A and B extrapolated out to their radii against their ICM temperatures. Also shown are other high-redshift, X-ray and optically selected clusters drawn from the literature. We have corrected each system for the predicted self-similar evolution and overplotted the local relationship of Markevitch (1998), which has a power-law slope of 2.64. The optically selected clusters are drawn from the ESO Distant Cluster Survey (EDiscS; White et al. 2005, Johnson et al. 2006) and the Red Sequence Cluster Survey (RCS; Gladders & Yee 2000, Hicks et al. 2007), while the X-ray selected sample includes clusters from the Massive Cluster Survey (MACS; Ebeling et al. 2001, 2007) and several individual clusters drawn from a variety of studies (Borgani et al. 1999; Donahue et al. 1999; Gioia et al. 1999; Tran et al. 1999; Ebeling et al. 2001; Holden et al. 2001; Stanford et al. 2001, 2002; Vikhlinin et al. 2002; Valtchanov et al. 2004; Maughan et al. 2004; Rosati et al. 2004; Mullis et al. 2005; Hilton et al. 2007; Demarco et al. 2007).
In agreement with the results of L04 we find that the optically selected Clusters A and B are consistent with the relationship followed by high-redshift, X-ray selected systems. The same is largely true for the optically selected EDisCs and RCS clusters, as previously reported. While we find Cluster B deviates from the best-fit relationship of Markevitch (1998) at the level, it is well within the cluster-to-cluster scatter observed in the correlation. Figure 12 suggests that while optical selection of clusters at high redshift often finds clusters further down the luminosity (and hence mass) function, it does not preferentially select systems that deviate from the predicted scaling relationships between cluster X-ray properties.
The Relation
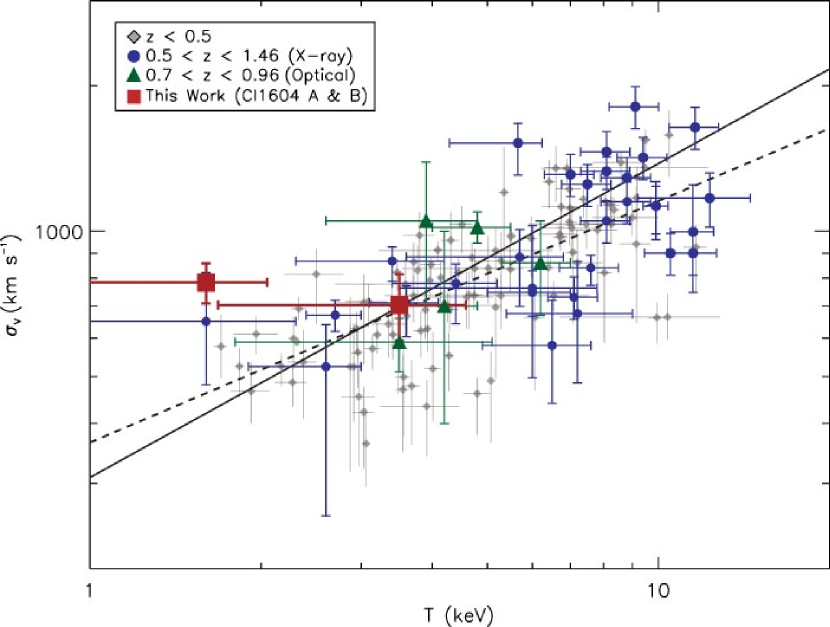
L04 found that while the X-ray properties of their optically selected clusters were consistent with X-ray-X-ray scaling relations, they strongly deviated from X-ray-optical relations, such as the correlation. If the gas which makes up the ICM shares the same dynamics as the cluster galaxies, it is expected that the ICM temperature should be related to galaxy velocity dispersion as . L04 reported that their optically selected clusters had cooler temperatures than expected given their measured velocity dispersions. The deviations were at the 4 and 5 levels for Cl1324+3011 and Cluster A, respectively. We revisit this issue with an improved velocity dispersion for Cluster A and the first ever X-ray observations of Cluster B in the Cl1604 system.
Since the publication of the L04 results, our spectroscopic dataset for Cluster A has substantially improved (see Gal et al. 2008), allowing us to update the original estimate of its velocity dispersion. Using a iterative clipping technique on 35 redshifts within 1 Mpc of the cluster center, we measure a velocity dispersion of km s-1 for the system. Our revised value is significantly lower than the L04 estimate of 1226 km s-1 determined from a sample of 22 galaxies within a region centered on the cluster. Using the same procedure on galaxies in Cluster B, we obtain a velocity dispersion of km s-1 for the system.
In Figure 13 we plot the galaxy velocity dispersion vs ICM temperature of the two detected Cl1604 clusters, as well as several high-redshift X-ray and optically selected clusters drawn from the literature. Also shown in the background are clusters from a large sample of 273 low to moderate redshift systems observed with ASCA and uniformly analyzed by Horner (2001). Their best fit relationship using this dataset is plotted as the dashed line. Alternatively the solid line shows the best fit from Xue & Wu (2000), who used a slightly larger sample of clusters drawn from the literature and observed using a variety of instruments.
Using our revised velocity dispersion for Cluster A we find the system is now in very good agreement with the relation found at low redshifts and followed by high-redshift, X-ray selected systems. The same is largely true for the two EDisCs and three RCS clusters which have published velocity dispersions. The exception to this is Cluster B which deviates significantly from both the Xue & Wu (2000) and Horner (2001) best-fit relations. The deviation is significant at roughly the level (without taking into account the observed scatter).
As our spectral fits for Cluster B found it highly unlikely that the system’s temperature is significantly greater than 2 keV, which would place the system squarely in-line with the relation, an alternative explanation for the observed deviation is that the system is not fully relaxed. In that case the assumption that the ICM shares the same dynamics as the cluster galaxies may not hold true. Gal et al. (2008) note that the redshift distribution for Cluster B does shows evidence of velocity segregation indicative of either substructure or a triaxial system. They also find that the velocity dispersions of the red vs blue galaxy populations in the cluster differ by less than , unlike the difference observed in Cluster A. The latter is the most isolated cluster in the Cl1604 supercluster with the most prominent red sequence. If the system formed at an earlier epoch than Cluster B, it is expected that the primordial red galaxy population would have had more time to fully virialize and establish a much different dispersion than any infalling blue galaxy population. The lack of a significant difference in the velocity dispersions of blue and red galaxies in Cluster B may be further evidence that the system is undergoing collapse or possible merger processes, which may drive the cluster off the relationship.
The Relation
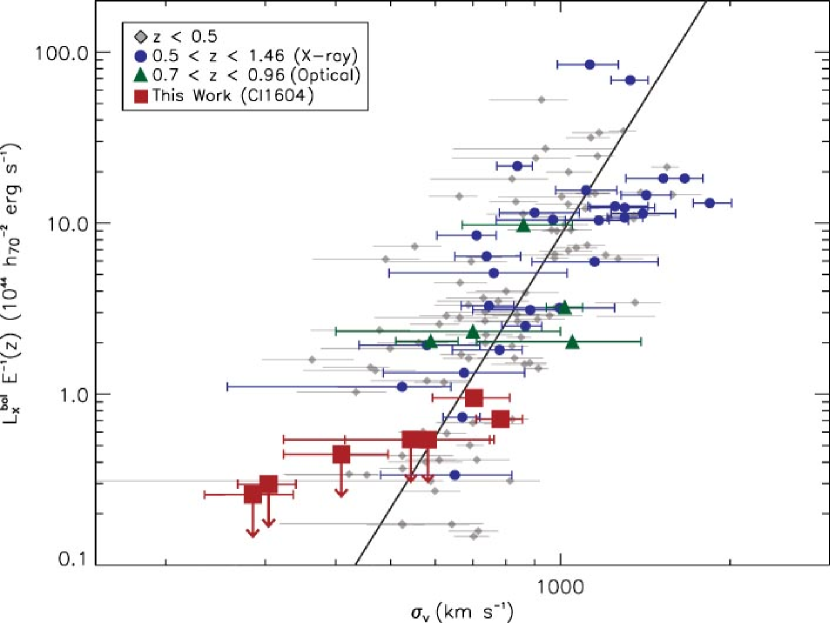
In addition to the findings of L04, Fang et al. (2007) have reported that their optically-selected clusters detected in the DEEP2 Galaxy Redshift Survey (Davis et al. 2003) are underluminous relative to their measured velocity dispersions. It is expected that the luminosity of the ICM should scale with galaxy velocity dispersion as if both the gas and galaxies are in virial equilibrium and if the gas mass is proportional to the virial mass of the system (Quintana & Melnick 1982). The L04 and Fang et al. (2007) results seem to suggest optical selection of cluster may preferentially select young systems that have not built-up a significant ICM and are therefore underluminous compared to X-ray selected systems.
In Figure 14 we plot the bolometric luminosity of the two detected Cl1604 clusters against their measured velocity dispersions. We have also plotted the upper limits obtained for each system in the supercluster that went undetected, but for which we have measured velocity dispersions of galaxies within 1 Mpc of the cluster centers. Also shown are several high-redshift X-ray and optically selected clusters drawn from the literature which have published velocity dispersions. Having corrected for the expected self-similar evolution, we compare the high redshift observations to the best-fit local relationship of Xue & Wu (2000) and the low redshift sample of Horner (2001). Using our revised velocity dispersion for Cluster A, we find the system is fully consistent with the relation. The same is true for the clusters which we did not detect in our observations given the upper limits on their X-ray luminosities. Cluster B exhibits the greatest deviation (at the level), but given the observed scatter about the best-fit, we conclude the system is consistent with the relationship.
From our results and those of other optically-selected cluster surveys summarized in Figure 14, we conclude that we do not observe a systematic deviation of optically-selected clusters from the relation. Regarding the deviation observed by Fang et al. (2007), we simply point out that the systems that deviated most significantly from the relation were also the systems whose velocity dispersions were determined using as few as three member galaxies. Given the challenges of measuring accurate velocity dispersions at high redshift with dozens of redshifts (see discussion in Gal et al. 2008), we feel these clusters require further observations before it can be conclusively determined whether they fall significantly off the relationship.
5. Conclusions
We have presented the results of Chandra observations of the Cl1604 supercluster at , the largest such structure mapped at redshifts approaching unity, with the most constituent clusters and groups and the largest number of spectroscopically confirmed member galaxies. Over nearly two ACIS-I pointings we find a excess of X-ray point sources in the hard10 band, while no such overdensity is observed in the soft band. At a flux of erg s-1 cm-2 (2-10 keV), the surface density of hard sources is 1.47 times greater than that of a blank field, in excellent agreement with the correlation between cluster redshift and source overdensity observed by Cappelluti et al. (2005). Unlike many previous reports, the overdensity persists when integrated over nearly two full ACIS-I pointings, making it unlikely the excess is solely due to statistical fluctuations in the source counts. If the excess sources are tracing substructure within the Cl1604 system, then this observation supports the notion that more obscured, harder X-ray sources are more highly biased tracers of large-scale structure than their softer counterparts.
Using a maximum likelihood technique we have matched 112 of the 161 detected X-ray point sources to optical counterparts found in our Palomar 5m-LFC and HST-ACS imaging, of which 42 have spectroscopic information available. We find 15 sources that are associated with the supercluster, all of which have rest-frame luminosities consistent with emission from AGN activity. The supercluster AGN largely avoid the densest regions of the system and are instead distributed on the outskirts of massive clusters or within poorer clusters and groups. We find a large fraction of the AGN in or near Cluster C. The system has a modest velocity dispersion ( kms -1) and we do not detect diffuse emission from the system in these observations. Despite the high density of galaxies in Cluster A and extensive spectroscopic coverage of the system, we find no AGN in or near the cluster. On the other hand sources are found on the outskirts of Cluster B, which has an equally high velocity dispersion and a luminous ICM. The primary difference between the two clusters noted by Gal et al. (2008) is that Cluster A appears fully relaxed, while Cluster B shows signs of velocity substructure indicative of a recent merger or a significant population of actively accreting galaxies. It is possible that the more complex dynamical state of Cluster B leads to increased galaxy interactions and/or mergers on the outskirts of the system which may trigger enhanced AGN activity.
We have detected diffuse emission from Clusters A and B, while the remaining five clusters and groups in the supercluster show no significant emission above the background. We find that Clusters A and B have bolometric luminosities of and erg s-1 and gas temperatures and keV, respectively. Using updated velocity dispersions from Gal et al. (2008), we find that the properties of Cluster A agree well with both X-ray-X-ray and X-ray-optical cluster scaling relations followed by high-redshift, X-ray selected galaxy clusters. On the other hand we find Clusters B deviates from the relationship at the level. This may be due to the system’s complex dynamical state, indicating the cluster is not fully relaxed and may still be in the process of forming.
| R.A. | Dec. | Error | Net Cnts † | ‡ | Sig | Detection | ||||||||
|---|---|---|---|---|---|---|---|---|---|---|---|---|---|---|
| Source Name | (J2000) | (J2000) | (′′) | (Soft) | (Hard) | (Full) | (Soft) | (Hard) | (Full) | (Soft) | (Hard) | (Full) | HR | Flag |
| J160310.5432627 | 16:03:10.5 | 43:26:27.3 | 4.83 | 99.4 | 80.9 | 180.3 | 1.26 | 3.57 | 4.82 | 20.4 | 13.4 | 25.1 | 0.10 | SHF |
| J160316.9432256 | 16:03:16.9 | 43:22:56.3 | 5.26 | 5.8 | 23.4 | 29.1 | 7.29 | 1.03 | 1.10 | 1.5 | 4.6 | 4.9 | 0.60 | HF |
| J160320.4431220 | 16:03:20.4 | 43:12:20.2 | 9.27 | 9.1 | 13.8 | 22.9 | 1.10 | 6.06 | 7.16 | 2.0 | 2.2 | 3.2 | 0.21 | SF |
| J160324.9432226 | 16:03:24.9 | 43:22:26.2 | 2.01 | 73.2 | 27.9 | 101.0 | 9.25 | 1.23 | 2.15 | 23.3 | 6.5 | 21.7 | 0.45 | SHF |
| J160329.4432059 | 16:03:29.4 | 43:20:59.5 | 2.73 | 24.6 | 11.7 | 36.3 | 3.11 | 5.14 | 8.25 | 8.2 | 3.0 | 8.5 | 0.36 | SF |
| J160330.7431049 | 16:03:30.7 | 43:10:49.9 | 2.68 | 30.5 | 23.5 | 54.0 | 3.70 | 1.03 | 1.40 | 8.0 | 4.4 | 9.0 | 0.13 | SHF |
| J160332.4431953 | 16:03:32.4 | 43:19:53.1 | 1.66 | 47.7 | 28.2 | 75.9 | 6.03 | 1.24 | 1.85 | 15.9 | 7.3 | 17.7 | 0.26 | SF |
| J160332.5430908 | 16:03:32.5 | 43:09:08.4 | 4.48 | 14.6 | 0.0 | 14.6 | 1.76 | 0.00 | 1.76 | 3.8 | 0.0 | 2.6 | 1.00 | SF |
| J160332.8430750 | 16:03:32.8 | 43:07:50.2 | 2.18 | 45.3 | 39.8 | 85.1 | 5.48 | 1.75 | 2.30 | 13.8 | 8.0 | 15.8 | 0.06 | SHF |
| J160336.9431906 | 16:03:36.9 | 43:19:06.8 | 4.01 | 11.2 | 6.3 | 17.5 | 1.42 | 2.77 | 4.19 | 4.1 | 1.7 | 4.5 | 0.28 | S |
| J160337.1431331 | 16:03:37.1 | 43:13:31.6 | 4.50 | 23.6 | 12.7 | 36.3 | 2.86 | 5.57 | 8.44 | 6.5 | 2.7 | 6.8 | 0.30 | SF |
| J160337.3431625 | 16:03:37.3 | 43:16:25.3 | 2.27 | 51.6 | 24.8 | 76.4 | 6.52 | 1.09 | 1.75 | 16.6 | 5.9 | 16.6 | 0.35 | SHF |
| J160338.3430747 | 16:03:38.3 | 43:07:47.3 | 1.15 | 91.5 | 61.9 | 153.5 | 1.11 | 2.73 | 3.84 | 26.7 | 13.3 | 29.7 | 0.19 | SHF |
| J160338.8431108 | 16:03:38.8 | 43:11:08.0 | 3.10 | 17.1 | 2.2 | 19.3 | 2.07 | 9.67 | 3.04 | 5.7 | 0.5 | 4.3 | 0.77 | SF |
| J160338.8432702 | 16:03:38.8 | 43:27:02.7 | 3.56 | 10.2 | 6.1 | 16.3 | 1.29 | 2.70 | 3.98 | 3.5 | 1.4 | 3.6 | 0.25 | SF |
| J160339.2431902 | 16:03:39.2 | 43:19:02.8 | 2.96 | 9.7 | 0.8 | 10.5 | 1.23 | 3.68 | 1.59 | 3.7 | 0.2 | 2.9 | 0.84 | SF |
| J160339.6430839 | 16:03:39.6 | 43:08:39.1 | 4.67 | 14.4 | 9.4 | 23.7 | 1.74 | 4.12 | 5.86 | 4.6 | 2.4 | 5.4 | 0.21 | F |
| J160339.6431601 | 16:03:39.6 | 43:16:01.1 | 2.26 | 38.4 | 31.8 | 70.2 | 4.85 | 1.40 | 1.89 | 11.4 | 6.8 | 13.5 | 0.09 | SHF |
| J160339.7432023 | 16:03:39.7 | 43:20:23.7 | 0.89 | 67.1 | 22.5 | 89.7 | 8.48 | 9.94 | 1.84 | 26.6 | 7.2 | 26.9 | 0.50 | SHF |
| J160340.2430853 | 16:03:40.2 | 43:08:53.8 | 3.33 | 6.2 | 11.1 | 17.3 | 7.53 | 4.88 | 5.64 | 2.1 | 2.9 | 4.0 | 0.28 | HF |
| J160340.6431752 | 16:03:40.6 | 43:17:52.4 | 1.12 | 88.5 | 40.5 | 129.0 | 1.12 | 1.79 | 2.91 | 29.6 | 10.5 | 30.4 | 0.37 | SHF |
| J160341.4431649 | 16:03:41.4 | 43:16:49.8 | 1.57 | 43.6 | 34.8 | 78.4 | 5.51 | 1.53 | 2.08 | 13.3 | 7.7 | 15.8 | 0.11 | SHF |
| J160342.8431117 | 16:03:42.8 | 43:11:17.0 | 3.09 | 18.1 | 0.0 | 18.1 | 2.19 | 0.00 | 2.19 | 5.9 | 0.0 | 4.6 | 1.00 | S |
| J160343.5431246 | 16:03:43.5 | 43:12:46.9 | 2.94 | 8.7 | 4.0 | 12.7 | 1.05 | 1.75 | 2.81 | 3.0 | 1.0 | 3.0 | 0.37 | SF |
| J160343.7433007 | 16:03:43.7 | 43:30:07.3 | 5.55 | 45.0 | 20.7 | 65.7 | 5.69 | 9.12 | 1.48 | 14.1 | 4.8 | 14.0 | 0.37 | F |
| J160343.8432622 | 16:03:43.8 | 43:26:22.7 | 1.57 | 15.1 | 18.5 | 33.6 | 1.91 | 8.16 | 1.01 | 5.7 | 5.7 | 9.4 | 0.10 | SHF |
| J160344.2430521 | 16:03:44.2 | 43:05:21.9 | 4.24 | 15.2 | 11.3 | 26.5 | 1.84 | 4.99 | 6.83 | 4.6 | 2.4 | 5.2 | 0.14 | F |
| J160344.5430625 | 16:03:44.5 | 43:06:26.0 | 1.18 | 148.5 | 83.5 | 232.0 | 1.80 | 3.68 | 5.47 | 46.4 | 19.1 | 48.3 | 0.28 | SHF |
| J160345.3431507 | 16:03:45.3 | 43:15:07.7 | 3.28 | 12.8 | 7.9 | 20.7 | 1.55 | 3.46 | 5.01 | 3.9 | 1.9 | 4.5 | 0.24 | SF |
| J160345.3431824 | 16:03:45.3 | 43:18:24.9 | 2.64 | 14.9 | 5.6 | 20.5 | 1.88 | 2.47 | 4.36 | 6.0 | 1.7 | 6.0 | 0.45 | SF |
| J160345.5432328 | 16:03:45.5 | 43:23:28.6 | 2.70 | 7.3 | 0.0 | 7.3 | 9.24 | 0.00 | 9.24 | 3.1 | 0.0 | 2.5 | 1.00 | S |
| J160345.8430608 | 16:03:45.8 | 43:06:08.0 | 3.86 | 11.5 | 0.1 | 11.6 | 1.40 | 3.12 | 1.43 | 3.8 | 0.0 | 2.6 | 0.99 | SF |
| J160348.8431717 | 16:03:48.8 | 43:17:17.3 | 2.96 | 8.1 | 6.1 | 14.1 | 1.02 | 2.67 | 3.69 | 2.9 | 1.7 | 3.6 | 0.14 | SF |
| J160349.3430947 | 16:03:49.3 | 43:09:47.6 | 2.87 | 9.5 | 6.9 | 16.3 | 1.15 | 3.02 | 4.17 | 3.8 | 2.2 | 5.0 | 0.16 | S |
| J160349.7430851 | 16:03:49.7 | 43:08:51.4 | 0.60 | 128.8 | 46.1 | 174.9 | 1.56 | 2.03 | 3.59 | 50.5 | 14.4 | 51.3 | 0.47 | SHF |
| J160350.8432123 | 16:03:50.8 | 43:21:23.1 | 1.37 | 1.2 | 17.8 | 19.1 | 1.55 | 7.87 | 8.02 | 0.6 | 7.0 | 7.2 | 0.87 | HF |
| J160351.1430148 | 16:03:51.1 | 43:01:48.3 | 3.89 | 43.5 | 29.2 | 72.6 | 5.27 | 1.28 | 1.81 | 11.0 | 5.0 | 11.2 | 0.20 | SF |
| J160351.5433007 | 16:03:51.5 | 43:30:07.7 | 4.59 | 13.3 | 17.5 | 30.9 | 1.68 | 7.73 | 9.42 | 3.6 | 3.4 | 5.4 | 0.14 | SF |
| J160353.7432752 | 16:03:53.7 | 43:27:52.2 | 2.71 | 8.3 | 5.5 | 13.8 | 1.05 | 2.42 | 3.47 | 3.4 | 1.7 | 4.0 | 0.21 | SF |
| J160354.7432105 | 16:03:54.7 | 43:21:05.8 | 1.67 | 1.1 | 6.8 | 7.9 | 1.43 | 2.98 | 3.13 | 0.6 | 3.0 | 3.4 | 0.71 | HF |
| J160355.2430616 | 16:03:55.2 | 43:06:16.0 | 1.43 | 13.3 | 24.2 | 37.5 | 1.61 | 1.07 | 1.23 | 5.5 | 7.2 | 10.6 | 0.29 | SHF |
| J160355.2432836 | 16:03:55.2 | 43:28:36.7 | 3.58 | 7.9 | 6.1 | 14.0 | 9.98 | 2.70 | 3.69 | 3.1 | 1.6 | 3.6 | 0.13 | S |
| J160356.2431317 | 16:03:56.2 | 43:13:17.9 | 1.05 | 34.3 | 10.3 | 44.6 | 4.15 | 4.55 | 8.70 | 13.2 | 3.5 | 13.7 | 0.54 | SHF |
| J160356.5431626 | 16:03:56.5 | 43:16:26.0 | 5.37 | 4.4 | 9.4 | 13.9 | 5.57 | 4.17 | 4.72 | 1.7 | 2.6 | 3.6 | 0.36 | S |
| J160356.7432358 | 16:03:56.7 | 43:23:58.9 | 0.68 | 5.1 | 29.4 | 34.5 | 6.50 | 1.29 | 1.36 | 2.4 | 12.7 | 14.1 | 0.70 | SHF |
| J160356.9430734 | 16:03:56.9 | 43:07:34.0 | 2.44 | 2.9 | 8.8 | 11.7 | 3.55 | 3.88 | 4.23 | 1.1 | 3.0 | 3.5 | 0.50 | F |
| J160356.9430950 | 16:03:56.9 | 43:09:50.9 | 1.54 | 4.1 | 8.1 | 12.1 | 4.91 | 3.56 | 4.05 | 1.8 | 3.0 | 4.3 | 0.33 | F |
| J160357.5432349 | 16:03:57.5 | 43:23:49.8 | 0.58 | 1.0 | 29.1 | 30.1 | 1.30 | 1.28 | 1.30 | 0.5 | 12.3 | 12.6 | 0.93 | HF |
| J160358.4430513 | 16:03:58.4 | 43:05:13.2 | 1.02 | 61.0 | 37.6 | 98.6 | 7.39 | 1.65 | 2.39 | 20.4 | 11.8 | 26.4 | 0.24 | SHF |
| J160358.7431553 | 16:03:58.7 | 43:15:53.6 | 2.20 | 32.1 | 7.6 | 39.7 | 4.06 | 3.34 | 7.39 | 11.3 | 1.9 | 9.2 | 0.62 | SF |
| J160359.8431934 | 16:03:59.8 | 43:19:34.6 | 1.46 | 6.8 | 1.5 | 8.3 | 8.63 | 6.41 | 1.50 | 3.3 | 0.6 | 3.3 | 0.65 | SF |
| J160359.9431142 | 16:03:59.9 | 43:11:42.7 | 1.03 | 2.1 | 19.6 | 21.6 | 2.48 | 8.62 | 8.87 | 0.9 | 7.4 | 7.7 | 0.81 | HF |
| J160400.1432231 | 16:04:00.1 | 43:22:31.3 | 0.60 | 18.4 | 8.9 | 27.3 | 2.32 | 3.93 | 6.25 | 9.1 | 4.0 | 12.4 | 0.35 | SF |
| J160400.2430947 | 16:04:00.2 | 43:09:47.9 | 1.00 | 14.0 | 8.5 | 22.5 | 1.70 | 3.73 | 5.43 | 6.2 | 3.2 | 8.1 | 0.25 | SHF |
| J160400.5431706 | 16:04:00.5 | 43:17:06.2 | 2.01 | 20.5 | 21.3 | 41.8 | 2.48 | 9.37 | 1.19 | 6.8 | 5.3 | 9.4 | 0.02 | SHF |
| J160401.0431153 | 16:04:01.0 | 43:11:53.0 | 1.32 | 0.7 | 11.6 | 12.3 | 7.94 | 5.10 | 5.18 | 0.3 | 4.3 | 4.2 | 0.89 | HF |
| J160401.3431351 | 16:04:01.3 | 43:13:51.2 | 0.88 | 36.2 | 18.9 | 55.2 | 4.39 | 8.32 | 1.27 | 15.4 | 6.7 | 18.6 | 0.31 | SHF |
| J160402.1431333 | 16:04:02.1 | 43:13:33.6 | 0.96 | 9.5 | 33.1 | 42.7 | 1.16 | 1.46 | 1.57 | 4.6 | 12.4 | 15.6 | 0.55 | SHF |
| J160403.7431136 | 16:04:03.7 | 43:11:36.5 | 2.17 | 6.2 | 4.8 | 11.0 | 7.49 | 2.13 | 2.88 | 2.9 | 2.0 | 4.3 | 0.12 | SHF |
| J160404.3431013 | 16:04:04.3 | 43:10:13.8 | 0.81 | 13.7 | 6.2 | 19.9 | 1.66 | 2.74 | 4.40 | 6.3 | 2.7 | 8.3 | 0.37 | SF |
| J160404.6432906 | 16:04:04.6 | 43:29:06.3 | 2.58 | 7.5 | 9.4 | 17.0 | 9.51 | 4.16 | 5.11 | 2.7 | 2.6 | 4.2 | 0.11 | F |
| J160405.1431519 | 16:04:05.1 | 43:15:19.4 | 2.36 | 10.5 | 3.5 | 14.0 | 1.27 | 1.56 | 2.83 | 4.0 | 1.2 | 4.2 | 0.50 | SF |
| J160405.1430654 | 16:04:05.1 | 43:06:54.4 | 2.23 | 7.7 | 5.3 | 13.0 | 9.34 | 2.34 | 3.27 | 3.3 | 2.0 | 4.6 | 0.18 | SF |
| J160405.3432110 | 16:04:05.3 | 43:21:10.7 | 0.48 | 21.7 | 20.4 | 42.1 | 2.75 | 9.00 | 1.17 | 10.7 | 8.4 | 17.5 | 0.03 | SHF |
| J160405.4431121 | 16:04:05.4 | 43:11:22.0 | 1.38 | 4.1 | 7.2 | 11.3 | 5.00 | 3.18 | 3.68 | 2.0 | 3.0 | 4.7 | 0.27 | SHF |
| J160405.6432351 | 16:04:05.6 | 43:23:51.6 | 0.47 | 33.9 | 26.1 | 60.0 | 4.29 | 1.15 | 1.58 | 17.3 | 10.7 | 25.5 | 0.13 | SHF |
| J160405.9433128 | 16:04:05.9 | 43:31:28.6 | 3.90 | 11.0 | 11.9 | 22.9 | 1.39 | 5.23 | 6.63 | 2.9 | 2.2 | 3.8 | 0.04 | F |
| J160406.0431807 | 16:04:06.0 | 43:18:07.6 | 0.83 | 32.2 | 15.3 | 47.5 | 4.08 | 6.74 | 1.08 | 13.8 | 5.7 | 16.7 | 0.36 | SHF |
| J160406.1430532 | 16:04:06.1 | 43:05:32.8 | 1.56 | 8.3 | 19.3 | 27.6 | 1.00 | 8.51 | 9.51 | 3.6 | 7.0 | 9.3 | 0.40 | HF |
| J160406.3432125 | 16:04:06.3 | 43:21:25.8 | 0.22 | 98.1 | 47.1 | 145.2 | 1.24 | 2.08 | 3.32 | 47.8 | 19.1 | 59.4 | 0.35 | SHF |
| J160406.6430545 | 16:04:06.6 | 43:05:45.3 | 1.40 | 24.9 | 8.4 | 33.4 | 3.02 | 3.72 | 6.74 | 10.9 | 2.9 | 11.1 | 0.49 | SHF |
| J160407.0431445 | 16:04:07.0 | 43:14:45.8 | 0.82 | 44.5 | 19.4 | 63.9 | 5.40 | 8.53 | 1.39 | 18.4 | 6.6 | 20.7 | 0.39 | SHF |
| J160407.5432639 | 16:04:07.5 | 43:26:40.0 | 0.49 | 72.4 | 37.4 | 109.7 | 9.15 | 1.65 | 2.56 | 32.1 | 14.9 | 41.7 | 0.32 | SHF |
| J160407.7431712 | 16:04:07.7 | 43:17:12.7 | 1.85 | 26.0 | 20.6 | 46.6 | 3.15 | 9.05 | 1.22 | 8.9 | 4.9 | 10.3 | 0.12 | SHF |
| J160408.0431736 | 16:04:08.0 | 43:17:36.4 | 2.46 | 14.4 | 18.4 | 32.9 | 1.75 | 8.12 | 9.86 | 4.7 | 4.4 | 7.1 | 0.12 | SHF |
| J160408.9431455 | 16:04:08.9 | 43:14:56.0 | 0.41 | 123.0 | 75.7 | 198.8 | 1.49 | 3.33 | 4.82 | 51.7 | 23.8 | 60.2 | 0.24 | SHF |
| J160408.9431825 | 16:04:08.9 | 43:18:25.8 | 1.51 | 2.8 | 12.7 | 15.4 | 3.51 | 5.58 | 5.93 | 1.2 | 4.8 | 5.4 | 0.64 | HF |
| J160409.0431307 | 16:04:09.0 | 43:13:07.1 | 1.64 | 5.5 | 3.5 | 9.1 | 6.72 | 1.56 | 2.23 | 2.8 | 1.4 | 3.7 | 0.22 | SF |
| J160409.4430344 | 16:04:09.4 | 43:03:44.9 | 3.19 | 10.9 | 1.7 | 12.6 | 1.32 | 7.39 | 2.06 | 4.1 | 0.4 | 3.2 | 0.73 | SF |
| J160409.7432341 | 16:04:09.7 | 43:23:41.3 | 0.88 | 3.4 | 4.8 | 8.1 | 4.26 | 2.10 | 2.53 | 1.6 | 2.1 | 3.5 | 0.17 | F |
| J160410.0430437 | 16:04:10.0 | 43:04:37.2 | 0.98 | 90.3 | 25.2 | 115.5 | 1.09 | 1.11 | 2.20 | 37.5 | 7.7 | 34.4 | 0.56 | SHF |
| J160410.2432614 | 16:04:10.2 | 43:26:14.6 | 0.46 | 77.2 | 23.7 | 100.8 | 9.76 | 1.04 | 2.02 | 37.9 | 9.4 | 40.9 | 0.53 | SHF |
| J160410.9432111 | 16:04:10.9 | 43:21:11.0 | 0.87 | 2.5 | 7.9 | 10.3 | 3.12 | 3.48 | 3.79 | 1.2 | 3.2 | 4.2 | 0.52 | F |
| J160411.4432733 | 16:04:11.4 | 43:27:33.5 | 2.17 | 9.2 | 5.7 | 14.9 | 1.16 | 2.52 | 3.69 | 3.9 | 2.1 | 5.1 | 0.23 | SF |
| J160411.5430148 | 16:04:11.5 | 43:01:48.2 | 2.14 | 69.1 | 4.5 | 73.5 | 8.37 | 1.96 | 1.03 | 20.1 | 1.0 | 14.6 | 0.88 | SF |
| J160412.6431002 | 16:04:12.6 | 43:10:02.1 | 1.61 | 4.2 | 2.5 | 6.6 | 5.05 | 1.08 | 1.59 | 2.1 | 1.1 | 3.1 | 0.26 | F |
| J160412.8432627 | 16:04:12.8 | 43:26:27.8 | 0.76 | 31.3 | 9.1 | 40.4 | 3.95 | 4.01 | 7.96 | 14.1 | 3.5 | 15.2 | 0.55 | SHF |
| J160413.1430927 | 16:04:13.1 | 43:09:27.6 | 1.32 | 7.7 | 0.0 | 7.7 | 9.30 | 0.00 | 9.30 | 3.8 | 0.0 | 3.4 | 1.00 | S |
| J160413.8432757 | 16:04:13.8 | 43:27:58.0 | 2.72 | 7.0 | 0.9 | 7.9 | 8.86 | 3.77 | 1.26 | 3.2 | 0.3 | 2.7 | 0.78 | SF |
| J160415.5431016 | 16:04:15.5 | 43:10:16.6 | 0.37 | 53.0 | 25.4 | 78.4 | 6.42 | 1.12 | 1.76 | 25.2 | 10.2 | 31.2 | 0.35 | SHF |
| J160415.6431410 | 16:04:15.6 | 43:14:10.5 | 1.16 | 5.3 | 11.6 | 16.8 | 6.39 | 5.09 | 5.73 | 2.4 | 4.4 | 6.1 | 0.37 | HF |
| J160415.8433120 | 16:04:15.8 | 43:31:20.8 | 6.93 | 16.5 | 3.1 | 19.6 | 2.09 | 1.39 | 3.47 | 5.0 | 0.6 | 3.7 | 0.68 | S |
| J160416.2431419 | 16:04:16.2 | 43:14:19.1 | 0.74 | 29.9 | 18.7 | 48.7 | 3.62 | 8.25 | 1.19 | 14.0 | 7.3 | 18.7 | 0.23 | SHF |
| J160416.6432440 | 16:04:16.6 | 43:24:40.5 | 1.14 | 5.3 | 4.2 | 9.5 | 6.73 | 1.86 | 2.53 | 2.5 | 1.9 | 4.1 | 0.12 | F |
| J160417.5433025 | 16:04:17.5 | 43:30:25.1 | 2.20 | 9.0 | 37.5 | 46.4 | 1.13 | 1.65 | 1.77 | 3.0 | 8.5 | 9.7 | 0.61 | HF |
| J160418.2430018 | 16:04:18.2 | 43:00:18.3 | 9.42 | 9.6 | 9.1 | 18.7 | 1.16 | 4.02 | 5.19 | 2.9 | 2.0 | 3.7 | 0.02 | S |
| J160418.2431925 | 16:04:18.2 | 43:19:25.5 | 0.75 | 42.5 | 0.4 | 42.9 | 5.37 | 1.77 | 5.55 | 20.5 | 0.2 | 17.2 | 0.98 | SF |
| J160419.0430700 | 16:04:19.0 | 43:07:00.9 | 1.85 | 6.8 | 0.0 | 6.8 | 8.24 | 0.00 | 8.24 | 3.3 | 0.0 | 3.0 | 1.00 | S |
| J160419.1431104 | 16:04:19.1 | 43:11:04.3 | 0.28 | 40.5 | 15.1 | 55.6 | 4.91 | 6.64 | 1.15 | 19.8 | 6.4 | 23.7 | 0.46 | SHF |
| J160419.2431600 | 16:04:19.2 | 43:16:00.5 | 2.91 | 13.0 | 2.9 | 15.9 | 1.65 | 1.27 | 2.92 | 4.5 | 0.8 | 4.0 | 0.64 | SF |
| J160420.3432651 | 16:04:20.3 | 43:26:51.4 | 2.21 | 6.7 | 0.8 | 7.5 | 8.44 | 3.57 | 1.20 | 3.1 | 0.3 | 2.7 | 0.78 | SF |
| J160421.1431521 | 16:04:21.1 | 43:15:21.4 | 2.27 | 10.0 | 1.7 | 11.6 | 1.21 | 7.39 | 1.95 | 4.2 | 0.6 | 3.7 | 0.71 | SF |
| J160421.8432354 | 16:04:21.8 | 43:23:54.7 | 0.18 | 382.3 | 246.5 | 628.8 | 4.83 | 1.09 | 1.57 | 182.5 | 100.3 | 253.9 | 0.22 | SHF |
| J160421.9432716 | 16:04:21.9 | 43:27:16.8 | 1.26 | 17.8 | 10.4 | 28.2 | 2.25 | 4.58 | 6.82 | 7.8 | 3.6 | 9.4 | 0.26 | SHF |
| J160423.5431249 | 16:04:23.5 | 43:12:49.4 | 0.72 | 11.0 | 11.9 | 22.9 | 1.33 | 5.24 | 6.57 | 5.5 | 4.9 | 9.5 | 0.04 | SHF |
| J160423.9431125 | 16:04:23.9 | 43:11:25.9 | 0.29 | 48.5 | 19.6 | 68.1 | 5.87 | 8.63 | 1.45 | 23.2 | 8.0 | 27.8 | 0.42 | SHF |
| J160423.9431610 | 16:04:23.9 | 43:16:10.3 | 1.23 | 41.7 | 12.3 | 54.0 | 5.06 | 5.41 | 1.05 | 14.8 | 3.7 | 14.8 | 0.54 | SHF |
| J160424.1431106 | 16:04:24.1 | 43:11:06.2 | 0.73 | 7.4 | 1.8 | 9.3 | 9.02 | 8.05 | 1.71 | 3.6 | 0.8 | 4.0 | 0.61 | SF |
| J160424.2433421 | 16:04:24.2 | 43:34:21.1 | 16.68 | 26.1 | 15.7 | 41.7 | 3.29 | 6.91 | 1.02 | 5.7 | 2.7 | 6.1 | 0.25 | S |
| J160424.7432208 | 16:04:24.7 | 43:22:08.8 | 1.13 | 6.7 | 1.8 | 8.4 | 8.43 | 7.80 | 1.62 | 3.1 | 0.7 | 3.4 | 0.58 | SF |
| J160425.2430133 | 16:04:25.2 | 43:01:33.5 | 4.22 | 11.6 | 8.4 | 20.0 | 1.40 | 3.70 | 5.10 | 3.3 | 1.8 | 3.8 | 0.16 | SF |
| J160425.9431245 | 16:04:25.9 | 43:12:45.2 | 0.69 | 18.4 | 7.5 | 25.9 | 2.23 | 3.31 | 5.54 | 8.3 | 3.2 | 10.4 | 0.42 | SHF |
| J160426.1430754 | 16:04:26.1 | 43:07:55.0 | 1.01 | 10.6 | 6.3 | 16.9 | 1.28 | 2.78 | 4.06 | 5.0 | 2.7 | 7.0 | 0.25 | SHF |
| J160426.3431742 | 16:04:26.3 | 43:17:42.3 | 2.84 | 5.5 | 9.5 | 14.9 | 6.91 | 4.17 | 4.87 | 2.2 | 3.2 | 4.6 | 0.27 | F |
| J160426.4432634 | 16:04:26.4 | 43:26:34.8 | 1.78 | 8.7 | 3.6 | 12.3 | 1.10 | 1.59 | 2.69 | 3.9 | 1.4 | 4.5 | 0.41 | SF |
| J160427.5432252 | 16:04:27.5 | 43:22:52.5 | 1.10 | 3.2 | 8.6 | 11.8 | 4.07 | 3.80 | 4.20 | 1.6 | 3.4 | 4.6 | 0.46 | HF |
| J160428.3430940 | 16:04:28.3 | 43:09:40.8 | 1.41 | 5.0 | 4.3 | 9.3 | 6.00 | 1.90 | 2.50 | 2.5 | 1.8 | 3.9 | 0.07 | SF |
| J160429.1432830 | 16:04:29.1 | 43:28:30.1 | 2.58 | 17.4 | 6.9 | 24.3 | 2.20 | 3.04 | 5.23 | 6.2 | 1.8 | 6.0 | 0.43 | SF |
| J160429.5432306 | 16:04:29.5 | 43:23:06.8 | 1.01 | 8.7 | 8.2 | 16.9 | 1.10 | 3.62 | 4.72 | 4.1 | 3.0 | 6.2 | 0.03 | SHF |
| J160430.7430623 | 16:04:30.7 | 43:06:23.1 | 2.03 | 7.5 | 0.0 | 7.5 | 9.10 | 0.00 | 9.10 | 3.4 | 0.0 | 2.7 | 1.00 | SF |
| J160431.4432954 | 16:04:31.4 | 43:29:54.7 | 2.10 | 34.5 | 28.1 | 62.6 | 4.36 | 1.24 | 1.68 | 10.4 | 6.2 | 12.4 | 0.10 | SHF |
| J160432.2430401 | 16:04:32.2 | 43:04:01.9 | 3.39 | 9.0 | 9.6 | 18.6 | 1.09 | 4.23 | 5.32 | 3.4 | 2.7 | 4.9 | 0.03 | SF |
| J160432.7430802 | 16:04:32.7 | 43:08:02.4 | 0.26 | 159.7 | 63.9 | 223.6 | 1.93 | 2.81 | 4.75 | 78.1 | 25.6 | 91.0 | 0.43 | SHF |
| J160433.3430339 | 16:04:33.3 | 43:03:39.4 | 0.94 | 172.3 | 29.0 | 201.3 | 2.09 | 1.27 | 3.36 | 67.7 | 8.0 | 53.6 | 0.71 | SHF |
| J160433.8431833 | 16:04:33.8 | 43:18:33.0 | 0.45 | 206.2 | 72.1 | 278.3 | 2.61 | 3.18 | 5.79 | 77.3 | 21.3 | 76.5 | 0.48 | SHF |
| J160433.8432352 | 16:04:33.8 | 43:23:52.4 | 1.31 | 4.0 | 13.1 | 17.1 | 5.10 | 5.78 | 6.29 | 1.8 | 4.7 | 5.8 | 0.53 | SHF |
| J160435.5432112 | 16:04:35.5 | 43:21:12.3 | 1.42 | 12.9 | 7.6 | 20.5 | 1.63 | 3.36 | 4.99 | 5.4 | 2.7 | 6.8 | 0.26 | SF |
| J160435.8430551 | 16:04:35.8 | 43:05:51.8 | 3.73 | 9.3 | 3.2 | 12.5 | 1.12 | 1.43 | 2.55 | 3.8 | 1.2 | 4.3 | 0.48 | S |
| J160436.0431929 | 16:04:36.0 | 43:19:29.3 | 0.84 | 33.0 | 50.9 | 83.9 | 4.18 | 2.24 | 2.66 | 13.0 | 16.9 | 25.4 | 0.21 | SHF |
| J160436.4431808 | 16:04:36.4 | 43:18:08.4 | 3.33 | 11.4 | 0.0 | 11.4 | 1.44 | 0.00 | 1.44 | 4.3 | 0.0 | 3.0 | 1.00 | SF |
| J160436.7432141 | 16:04:36.7 | 43:21:41.4 | 1.17 | 16.4 | 13.5 | 29.9 | 2.07 | 5.94 | 8.02 | 6.4 | 4.9 | 9.6 | 0.10 | SHF |
| J160437.5432010 | 16:04:37.5 | 43:20:10.2 | 1.83 | 13.4 | 2.9 | 16.3 | 1.69 | 1.29 | 2.99 | 5.3 | 1.0 | 5.2 | 0.64 | SF |
| J160437.9430753 | 16:04:37.9 | 43:07:53.0 | 0.73 | 38.3 | 14.2 | 52.5 | 4.64 | 6.25 | 1.09 | 16.8 | 5.3 | 18.9 | 0.46 | SHF |
| J160438.3432625 | 16:04:38.3 | 43:26:25.2 | 1.64 | 18.7 | 49.4 | 68.1 | 2.36 | 2.18 | 2.42 | 7.7 | 14.8 | 19.2 | 0.45 | SHF |
| J160438.4430729 | 16:04:38.4 | 43:07:29.1 | 0.47 | 87.2 | 57.4 | 144.6 | 1.06 | 2.53 | 3.58 | 40.2 | 20.3 | 50.6 | 0.21 | SHF |
| J160439.3432419 | 16:04:39.3 | 43:24:19.6 | 1.47 | 11.1 | 14.2 | 25.2 | 1.40 | 6.24 | 7.64 | 4.7 | 4.8 | 8.1 | 0.12 | SF |
| J160439.5430509 | 16:04:39.5 | 43:05:09.8 | 2.69 | 8.3 | 6.0 | 14.3 | 1.01 | 2.63 | 3.64 | 3.4 | 1.9 | 4.2 | 0.16 | SF |
| J160441.7432057 | 16:04:41.7 | 43:20:57.8 | 1.45 | 16.0 | 17.5 | 33.5 | 2.02 | 7.72 | 9.74 | 6.3 | 5.4 | 9.6 | 0.04 | SHF |
| J160443.3431348 | 16:04:43.3 | 43:13:48.2 | 0.75 | 106.3 | 33.2 | 139.5 | 1.29 | 1.46 | 2.75 | 42.5 | 10.3 | 41.1 | 0.52 | SHF |
| J160444.6432026 | 16:04:44.6 | 43:20:26.8 | 0.98 | 68.3 | 36.3 | 104.6 | 8.63 | 1.60 | 2.46 | 22.9 | 10.1 | 26.0 | 0.31 | SHF |
| J160446.0432234 | 16:04:46.0 | 43:22:34.5 | 0.54 | 164.4 | 65.7 | 230.2 | 2.08 | 2.90 | 4.98 | 61.0 | 18.1 | 59.6 | 0.43 | SHF |
| J160447.5431723 | 16:04:47.5 | 43:17:23.9 | 11.85 | 8.7 | 23.7 | 32.4 | 1.05 | 1.04 | 1.15 | 2.9 | 5.6 | 7.0 | 0.46 | H |
| J160448.4430807 | 16:04:48.4 | 43:08:07.3 | 1.17 | 34.2 | 14.1 | 48.3 | 4.14 | 6.20 | 1.03 | 13.0 | 4.0 | 12.9 | 0.42 | SHF |
| J160449.5430723 | 16:04:49.5 | 43:07:23.4 | 3.02 | 0.0 | 14.7 | 14.7 | 0.00 | 6.48 | 6.48 | 0.0 | 4.6 | 4.0 | 1.00 | HF |
| J160450.2432158 | 16:04:50.2 | 43:21:58.3 | 0.95 | 164.3 | 73.7 | 237.9 | 2.08 | 3.25 | 5.33 | 53.2 | 18.4 | 54.0 | 0.38 | SHF |
| J160451.3431548 | 16:04:51.3 | 43:15:48.8 | 1.52 | 104.5 | 47.8 | 152.3 | 1.27 | 2.10 | 3.37 | 33.9 | 11.4 | 33.4 | 0.37 | SHF |
| J160453.3431912 | 16:04:53.3 | 43:19:12.2 | 2.65 | 26.7 | 14.0 | 40.8 | 3.38 | 6.19 | 9.57 | 7.5 | 2.9 | 7.6 | 0.31 | SF |
| J160454.3431036 | 16:04:54.3 | 43:10:36.5 | 2.43 | 7.2 | 7.1 | 14.3 | 8.71 | 3.11 | 3.98 | 2.6 | 1.9 | 3.6 | 0.01 | F |
| J160454.3430829 | 16:04:54.3 | 43:08:29.1 | 3.84 | 9.0 | 0.0 | 9.0 | 1.09 | 0.00 | 1.09 | 3.3 | 0.0 | 2.4 | 1.00 | SF |
| J160454.7431013 | 16:04:54.7 | 43:10:13.7 | 5.14 | 12.1 | 0.0 | 12.1 | 1.47 | 0.00 | 1.47 | 4.4 | 0.0 | 3.1 | 1.00 | S |
| J160455.5431445 | 16:04:55.5 | 43:14:45.3 | 4.18 | 50.9 | 17.7 | 68.5 | 6.16 | 7.77 | 1.39 | 18.8 | 4.6 | 17.1 | 0.48 | SF |
| J160456.9432037 | 16:04:56.9 | 43:20:37.2 | 3.50 | 16.5 | 8.6 | 25.1 | 2.09 | 3.79 | 5.88 | 4.8 | 1.8 | 4.7 | 0.31 | SF |
| J160459.6430508 | 16:04:59.6 | 43:05:08.2 | 5.19 | 16.1 | 17.1 | 33.1 | 1.95 | 7.51 | 9.46 | 4.7 | 3.4 | 6.0 | 0.03 | F |
| J160459.8431957 | 16:04:59.8 | 43:19:57.3 | 2.51 | 54.2 | 31.2 | 85.5 | 6.86 | 1.38 | 2.06 | 14.3 | 5.5 | 13.9 | 0.27 | SHF |
| J160500.3431028 | 16:05:00.3 | 43:10:28.0 | 1.72 | 41.7 | 25.4 | 67.1 | 5.05 | 1.12 | 1.62 | 11.9 | 5.7 | 13.4 | 0.24 | SHF |
| J160501.1430724 | 16:05:01.1 | 43:07:24.1 | 2.84 | 10.5 | 22.5 | 33.0 | 1.27 | 9.90 | 1.12 | 3.2 | 5.0 | 6.5 | 0.36 | HF |
| J160501.9430914 | 16:05:01.9 | 43:09:14.5 | 2.54 | 13.2 | 15.6 | 28.8 | 1.60 | 6.86 | 8.46 | 4.0 | 3.6 | 5.9 | 0.08 | SF |
| J160502.9430602 | 16:05:02.9 | 43:06:02.8 | 6.68 | 9.4 | 9.3 | 18.7 | 1.14 | 4.07 | 5.22 | 2.4 | 2.0 | 3.4 | 0.01 | S |
| J160503.0432144 | 16:05:03.0 | 43:21:44.0 | 0.93 | 269.6 | 308.9 | 578.6 | 3.41 | 1.36 | 1.70 | 73.3 | 60.7 | 101.3 | 0.07 | SHF |
| J160505.1430632 | 16:05:05.1 | 43:06:32.5 | 6.70 | 7.6 | 10.1 | 17.7 | 9.19 | 4.44 | 5.36 | 2.0 | 2.0 | 3.1 | 0.14 | S |
| J160506.5431032 | 16:05:06.5 | 43:10:32.7 | 5.72 | 11.1 | 11.4 | 22.5 | 1.34 | 5.04 | 6.38 | 3.5 | 2.6 | 4.6 | 0.02 | S |
Note. — † Net Cnts = Aperture Corrected Net Counts; ‡ in units of erg cm-2 s-1; Soft = 0.5-2 keV, Hard = 2-8 keV, Full = 0.5-8 keV
| X-ray RA | X-ray Dec | Optical RA | Optical Dec | Spect | ||||
|---|---|---|---|---|---|---|---|---|
| Source Name | (J2000) | (J2000) | (J2000) | (J2000) | Qual | |||
| J160310.5432627 | 16:03:10.5 | 43:26:27.3 | 16:03:10.3 | 43:26:27.7 | 0.951 | 0.951 | ||
| J160316.9432256 | 16:03:16.9 | 43:22:56.3 | 16:03:16.9 | 43:22:54.7 | 0.972 | 0.833 | ||
| J160324.9432226 | 16:03:24.9 | 43:22:26.2 | 16:03:24.8 | 43:22:26.3 | 0.997 | 0.990 | 1.118 | 4 |
| J160329.4432059 | 16:03:29.4 | 43:20:59.5 | 16:03:29.3 | 43:21:00.1 | 0.963 | 0.766 | 0.004 | 2 |
| J160332.4431953 | 16:03:32.4 | 43:19:53.1 | 16:03:32.5 | 43:19:53.0 | 0.944 | 0.944 | ||
| J160337.1431331 | 16:03:37.1 | 43:13:31.6 | 16:03:37.2 | 43:13:31.4 | 0.882 | 0.882 | ||
| J160337.3431625 | 16:03:37.3 | 43:16:25.3 | 16:03:37.2 | 43:16:26.4 | 0.901 | 0.901 | ||
| J160338.8431108 | 16:03:38.8 | 43:11:08.0 | 16:03:38.7 | 43:11:08.2 | 0.807 | 0.807 | ||
| J160339.2431902 | 16:03:39.2 | 43:19:02.8 | 16:03:39.1 | 43:19:03.4 | 0.785 | 0.785 | ||
| J160339.6431601 | 16:03:39.6 | 43:16:01.1 | 16:03:39.6 | 43:16:02.4 | 0.962 | 0.962 | ||
| J160339.7432023 | 16:03:39.7 | 43:20:23.7 | 16:03:39.7 | 43:20:24.4 | 0.966 | 0.966 | 0.270 | 3 |
| J160340.6431752 | 16:03:40.6 | 43:17:52.4 | 16:03:40.6 | 43:17:52.2 | 0.984 | 0.984 | ||
| J160341.4431649 | 16:03:41.4 | 43:16:49.8 | 16:03:41.5 | 43:16:49.7 | 0.973 | 0.973 | ||
| J160342.8431117 | 16:03:42.8 | 43:11:17.0 | 16:03:42.8 | 43:11:16.9 | 0.993 | 0.993 | ||
| J160343.7433007 | 16:03:43.7 | 43:30:07.3 | 16:03:43.7 | 43:30:07.0 | 0.886 | 0.479 | ||
| J160343.7433007 | 16:03:44.0 | 43:30:03.6 | 0.886 | 0.200 | ||||
| J160343.7433007 | 16:03:44.2 | 43:30:08.3 | 0.886 | 0.207 | ||||
| J160345.3431824 | 16:03:45.3 | 43:18:24.9 | 16:03:45.5 | 43:18:23.6 | 0.833 | 0.473 | ||
| J160345.3431824 | 16:03:45.4 | 43:18:25.1 | 0.833 | 0.360 | ||||
| J160345.3431507 | 16:03:45.3 | 43:15:07.7 | 16:03:45.0 | 43:15:07.4 | 0.993 | 0.993 | ||
| J160348.8431717 | 16:03:48.8 | 43:17:17.3 | 16:03:48.7 | 43:17:17.8 | 0.918 | 0.918 | ||
| J160350.8432123 | 16:03:50.8 | 43:21:23.1 | 16:03:50.8 | 43:21:23.2 | 0.955 | 0.955 | ||
| J160353.7432752 | 16:03:53.7 | 43:27:52.2 | 16:03:53.7 | 43:27:52.0 | 0.982 | 0.982 | ||
| J160356.2431317 | 16:03:56.2 | 43:13:17.9 | 16:03:56.2 | 43:13:18.0 | 0.989 | 0.989 | 0.593 | 4 |
| J160356.7432358 | 16:03:56.7 | 43:23:58.9 | 16:03:56.7 | 43:23:59.0 | 0.997 | 0.997 | ||
| J160356.9430734 | 16:03:56.9 | 43:07:34.0 | 16:03:56.9 | 43:07:34.5 | 0.945 | 0.945 | ||
| J160356.9430950 | 16:03:56.9 | 43:09:50.9 | 16:03:56.9 | 43:09:50.6 | 0.984 | 0.984 | ||
| J160357.5432349 | 16:03:57.5 | 43:23:49.8 | 16:03:57.4 | 43:23:49.9 | 0.998 | 0.998 | ||
| J160358.4430513 | 16:03:58.4 | 43:05:13.2 | 16:03:58.5 | 43:05:14.1 | 0.981 | 0.981 | ||
| J160359.9431142 | 16:03:59.9 | 43:11:42.7 | 16:03:59.9 | 43:11:42.9 | 0.990 | 0.990 | 0.777 | 4 |
| J160400.1432231 | 16:04:00.1 | 43:22:31.3 | 16:04:00.1 | 43:22:31.4 | 0.990 | 0.508 | ||
| J160400.1432231 | 16:04:00.1 | 43:22:30.9 | 0.990 | 0.482 | 1.399 | 4 | ||
| J160400.2430947 | 16:04:00.2 | 43:09:47.9 | 16:04:00.2 | 43:09:47.9 | 0.985 | 0.985 | ||
| J160400.5431706 | 16:04:00.5 | 43:17:06.2 | 16:04:00.6 | 43:17:06.6 | 0.948 | 0.948 | 0.979 | 4 |
| J160401.0431153 | 16:04:01.0 | 43:11:53.0 | 16:04:01.0 | 43:11:53.3 | 0.930 | 0.930 | 1.237 | 4 |
| J160401.3431351 | 16:04:01.3 | 43:13:51.2 | 16:04:01.3 | 43:13:51.4 | 0.989 | 0.989 | 0.927 | 4 |
| J160402.1431333 | 16:04:02.1 | 43:13:33.6 | 16:04:02.1 | 43:13:33.5 | 0.998 | 0.998 | 0.349 | 4 |
| J160404.3431013 | 16:04:04.3 | 43:10:13.8 | 16:04:04.3 | 43:10:13.6 | 0.985 | 0.985 | ||
| J160404.6432906 | 16:04:04.6 | 43:29:06.3 | 16:04:04.7 | 43:29:06.5 | 0.993 | 0.993 | ||
| J160405.1431519 | 16:04:05.1 | 43:15:19.4 | 16:04:05.1 | 43:15:19.8 | 0.968 | 0.968 | 0.935 | 4 |
| J160405.3432110 | 16:04:05.3 | 43:21:10.7 | 16:04:05.3 | 43:21:11.2 | 0.990 | 0.990 | 1.208 | 4 |
| J160405.4431122 | 16:04:05.4 | 43:11:22.0 | 16:04:05.4 | 43:11:22.0 | 0.914 | 0.914 | ||
| J160405.6432351 | 16:04:05.6 | 43:23:51.6 | 16:04:05.6 | 43:23:51.9 | 0.992 | 0.912 | 1 | |
| J160405.9433128 | 16:04:05.9 | 43:31:28.6 | 16:04:06.0 | 43:31:28.6 | 0.909 | 0.909 | ||
| J160406.0431807 | 16:04:06.0 | 43:18:07.6 | 16:04:06.1 | 43:18:08.0 | 0.976 | 0.811 | 0.913 | 3 |
| J160406.1430532 | 16:04:06.1 | 43:05:32.8 | 16:04:06.1 | 43:05:31.8 | 0.985 | 0.985 | ||
| J160406.3432125 | 16:04:06.3 | 43:21:25.8 | 16:04:06.3 | 43:21:26.1 | 0.999 | 0.999 | 2.040 | 4 |
| J160406.6430545 | 16:04:06.6 | 43:05:45.3 | 16:04:06.6 | 43:05:44.5 | 0.982 | 0.982 | 0.970 | 4 |
| J160407.0431445 | 16:04:07.0 | 43:14:45.8 | 16:04:07.0 | 43:14:46.0 | 0.997 | 0.997 | 0.808 | 4 |
| J160407.5432640 | 16:04:07.5 | 43:26:40.0 | 16:04:07.5 | 43:26:40.3 | 0.993 | 0.993 | 1.285 | 4 |
| J160408.0431736 | 16:04:08.0 | 43:17:36.4 | 16:04:08.2 | 43:17:36.9 | 0.988 | 0.947 | 0.937 | 4 |
| J160408.9431456 | 16:04:08.9 | 43:14:56.0 | 16:04:08.9 | 43:14:56.2 | 0.999 | 0.999 | 0.809 | 4 |
| J160408.9431825 | 16:04:08.9 | 43:18:25.8 | 16:04:08.9 | 43:18:26.5 | 0.971 | 0.971 | 1.285 | 4 |
| J160409.0431307 | 16:04:09.0 | 43:13:07.1 | 16:04:08.9 | 43:13:05.6 | 0.994 | 0.994 | 0.131 | 4 |
| J160409.7432341 | 16:04:09.7 | 43:23:41.3 | 16:04:09.7 | 43:23:41.6 | 0.946 | 0.946 | ||
| J160410.0430437 | 16:04:10.0 | 43:04:37.2 | 16:04:10.0 | 43:04:37.6 | 0.989 | 0.989 | 1.025 | 2 |
| J160410.2432614 | 16:04:10.2 | 43:26:14.6 | 16:04:10.2 | 43:26:15.0 | 0.999 | 0.999 | ||
| J160410.9432111 | 16:04:10.9 | 43:21:11.0 | 16:04:10.9 | 43:21:10.6 | 0.994 | 0.624 | ||
| J160410.9432111 | 16:04:10.9 | 43:21:11.0 | 0.994 | 0.342 | 0.935 | 4 | ||
| J160411.4432733 | 16:04:11.4 | 43:27:33.5 | 16:04:11.5 | 43:27:33.2 | 0.858 | 0.858 | 0.101 | 2 |
| J160411.5430148 | 16:04:11.5 | 43:01:48.2 | 16:04:11.6 | 43:01:49.7 | 0.999 | 0.957 | ||
| J160412.6431002 | 16:04:12.6 | 43:10:02.1 | 16:04:12.7 | 43:10:02.2 | 0.975 | 0.975 | 0.829 | 4 |
| J160412.8432627 | 16:04:12.8 | 43:26:27.8 | 16:04:12.8 | 43:26:28.4 | 0.999 | 0.999 | ||
| J160413.1430927 | 16:04:13.1 | 43:09:27.6 | 16:04:13.2 | 43:09:27.2 | 0.982 | 0.982 | 0.600 | 4 |
| J160415.5431016 | 16:04:15.5 | 43:10:16.6 | 16:04:15.6 | 43:10:16.8 | 0.994 | 0.994 | 0.899 | 4 |
| J160415.6431410 | 16:04:15.6 | 43:14:10.5 | 16:04:15.6 | 43:14:10.8 | 0.950 | 0.496 | ||
| J160415.6431410 | 16:04:15.5 | 43:14:10.7 | 0.950 | 0.454 | ||||
| J160415.8433120 | 16:04:15.8 | 43:31:20.8 | 16:04:16.0 | 43:31:22.3 | 0.851 | 0.797 | ||
| J160416.2431419 | 16:04:16.2 | 43:14:19.1 | 16:04:16.2 | 43:14:19.3 | 0.998 | 0.998 | -0.004 | 4 |
| J160416.6432440 | 16:04:16.6 | 43:24:40.5 | 16:04:16.6 | 43:24:41.1 | 0.963 | 0.890 | ||
| J160417.5433025 | 16:04:17.5 | 43:30:25.1 | 16:04:17.5 | 43:30:25.8 | 0.982 | 0.982 | ||
| J160418.2430018 | 16:04:18.2 | 43:00:18.3 | 16:04:18.7 | 43:00:12.4 | 0.977 | 0.929 | ||
| J160418.2431925 | 16:04:18.2 | 43:19:25.5 | 16:04:18.2 | 43:19:26.2 | 0.999 | 0.999 | ||
| J160419.1431104 | 16:04:19.1 | 43:11:04.3 | 16:04:19.1 | 43:11:04.4 | 0.996 | 0.996 | 1.424 | 4 |
| J160419.2431600 | 16:04:19.2 | 43:16:00.5 | 16:04:19.3 | 43:16:01.1 | 0.972 | 0.968 | 0.004 | 2 |
| J160421.1431521 | 16:04:21.1 | 43:15:21.4 | 16:04:21.1 | 43:15:22.0 | 0.887 | 0.887 | ||
| J160421.8432354 | 16:04:21.8 | 43:23:54.7 | 16:04:21.8 | 43:23:55.0 | 0.998 | 0.998 | 0.055 | 4 |
| J160423.9431125 | 16:04:23.9 | 43:11:25.9 | 16:04:23.9 | 43:11:25.9 | 0.996 | 0.996 | 0.867 | 4 |
| J160423.9431610 | 16:04:23.9 | 43:16:10.3 | 16:04:23.9 | 43:16:10.6 | 0.976 | 0.976 | 2.304 | 4 |
| J160424.1431106 | 16:04:24.1 | 43:11:06.2 | 16:04:24.1 | 43:11:06.6 | 0.992 | 0.992 | 0.824 | 4 |
| J160424.2433421 | 16:04:24.2 | 43:34:21.1 | 16:04:23.0 | 43:34:20.9 | 0.992 | 0.834 | ||
| J160425.2430133 | 16:04:25.2 | 43:01:33.5 | 16:04:25.3 | 43:01:31.3 | 0.939 | 0.845 | 0.255 | 4 |
| J160425.9431245 | 16:04:25.9 | 43:12:45.2 | 16:04:25.9 | 43:12:45.5 | 0.996 | 0.996 | 0.871 | 4 |
| J160426.1430755 | 16:04:26.1 | 43:07:55.0 | 16:04:26.1 | 43:07:54.7 | 0.986 | 0.986 | 1.035 | 4 |
| J160426.3431742 | 16:04:26.3 | 43:17:42.3 | 16:04:26.4 | 43:17:43.5 | 0.982 | 0.586 | ||
| J160426.3431742 | 16:04:26.4 | 43:17:43.0 | 0.982 | 0.288 | ||||
| J160427.5432252 | 16:04:27.5 | 43:22:52.5 | 16:04:27.5 | 43:22:53.1 | 0.999 | 0.999 | 0.278 | 4 |
| J160428.3430940 | 16:04:28.3 | 43:09:40.8 | 16:04:28.3 | 43:09:41.2 | 0.901 | 0.901 | ||
| J160429.1432830 | 16:04:29.1 | 43:28:30.1 | 16:04:29.1 | 43:28:30.2 | 0.947 | 0.947 | ||
| J160429.5432306 | 16:04:29.5 | 43:23:06.8 | 16:04:29.5 | 43:23:06.9 | 0.921 | 0.617 | ||
| J160429.5432306 | 16:04:29.5 | 43:23:07.2 | 0.921 | 0.304 | ||||
| J160431.4432954 | 16:04:31.4 | 43:29:54.7 | 16:04:31.3 | 43:29:55.2 | 0.947 | 0.947 | ||
| J160432.7430802 | 16:04:32.7 | 43:08:02.4 | 16:04:32.8 | 43:08:02.7 | 0.998 | 0.998 | ||
| J160433.3430339 | 16:04:33.3 | 43:03:39.4 | 16:04:33.3 | 43:03:39.5 | 0.994 | 0.994 | ||
| J160433.8431833 | 16:04:33.8 | 43:18:33.0 | 16:04:33.8 | 43:18:33.5 | 0.999 | 0.999 | ||
| J160433.8432352 | 16:04:33.8 | 43:23:52.4 | 16:04:33.8 | 43:23:52.5 | 0.957 | 0.957 | ||
| J160435.5432112 | 16:04:35.5 | 43:21:12.3 | 16:04:35.5 | 43:21:12.2 | 0.984 | 0.606 | ||
| J160435.5432112 | 16:04:35.5 | 43:21:13.3 | 0.984 | 0.203 | ||||
| J160435.8430551 | 16:04:35.8 | 43:05:51.8 | 16:04:35.9 | 43:05:51.7 | 0.872 | 0.773 | ||
| J160436.0431929 | 16:04:36.0 | 43:19:29.3 | 16:04:36.0 | 43:19:29.6 | 0.996 | 0.970 | ||
| J160436.7432141 | 16:04:36.7 | 43:21:41.4 | 16:04:36.7 | 43:21:41.3 | 0.998 | 0.998 | 0.923 | 4 |
| J160437.5432010 | 16:04:37.5 | 43:20:10.2 | 16:04:37.5 | 43:20:11.4 | 0.997 | 0.997 | ||
| J160438.3432625 | 16:04:38.3 | 43:26:25.2 | 16:04:38.3 | 43:26:24.1 | 0.872 | 0.872 | ||
| J160438.4430729 | 16:04:38.4 | 43:07:29.1 | 16:04:38.5 | 43:07:29.3 | 0.990 | 0.990 | ||
| J160441.7432057 | 16:04:41.7 | 43:20:57.8 | 16:04:41.7 | 43:20:58.2 | 0.978 | 0.807 | 0.991 | 2 |
| J160443.3431348 | 16:04:43.3 | 43:13:48.2 | 16:04:43.3 | 43:13:48.3 | 0.997 | 0.997 | ||
| J160444.6432026 | 16:04:44.6 | 43:20:26.8 | 16:04:44.6 | 43:20:27.4 | 0.999 | 0.500 | ||
| J160444.6432026 | 16:04:44.6 | 43:20:27.0 | 0.999 | 0.500 | ||||
| J160446.0432234 | 16:04:46.0 | 43:22:34.5 | 16:04:46.0 | 43:22:34.8 | 0.998 | 0.998 | 0.002 | 2 |
| J160448.4430807 | 16:04:48.4 | 43:08:07.3 | 16:04:48.5 | 43:08:07.2 | 0.995 | 0.995 | ||
| J160449.5430723 | 16:04:49.5 | 43:07:23.4 | 16:04:49.5 | 43:07:23.4 | 0.780 | 0.780 | ||
| J160450.2432158 | 16:04:50.2 | 43:21:58.3 | 16:04:50.2 | 43:21:58.8 | 0.999 | 0.999 | ||
| J160451.3431548 | 16:04:51.3 | 43:15:48.8 | 16:04:51.3 | 43:15:49.2 | 0.979 | 0.979 | ||
| J160453.3431912 | 16:04:53.3 | 43:19:12.2 | 16:04:53.3 | 43:19:11.6 | 0.947 | 0.947 | ||
| J160455.5431445 | 16:04:55.5 | 43:14:45.3 | 16:04:55.5 | 43:14:42.4 | 0.967 | 0.602 | ||
| J160455.5431445 | 16:04:55.6 | 43:14:44.9 | 0.967 | 0.365 | ||||
| J160456.9432037 | 16:04:56.9 | 43:20:37.2 | 16:04:56.8 | 43:20:34.2 | 0.809 | 0.464 | ||
| J160456.9432037 | 16:04:57.0 | 43:20:37.3 | 0.809 | 0.247 | ||||
| J160459.6430508 | 16:04:59.6 | 43:05:08.2 | 16:04:59.6 | 43:05:07.2 | 0.830 | 0.454 | ||
| J160459.6430508 | 16:04:59.5 | 43:05:11.9 | 0.830 | 0.376 | ||||
| J160459.8431957 | 16:04:59.8 | 43:19:57.3 | 16:04:59.9 | 43:19:58.0 | 0.855 | 0.855 | ||
| J160500.3431028 | 16:05:00.3 | 43:10:28.0 | 16:05:00.3 | 43:10:27.9 | 0.994 | 0.994 | ||
| J160501.1430724 | 16:05:01.1 | 43:07:24.1 | 16:05:01.1 | 43:07:23.8 | 0.780 | 0.780 | ||
| J160505.1430632 | 16:05:05.1 | 43:06:32.5 | 16:05:05.2 | 43:06:32.3 | 0.909 | 0.669 | ||
| J160506.5431032 | 16:05:06.5 | 43:10:32.7 | 16:05:06.6 | 43:10:36.2 | 0.985 | 0.985 |
| RA | Dec | Extent | (0.5-2 keV) | (Bol) | (Bol) | ||||
|---|---|---|---|---|---|---|---|---|---|
| Cluster | (J2000)† | (J2000)† | ( kpc / arcsec) | Net Cnts | (keV) | ()‡ | ()∗ | (; )∗∗ | |
| Cl1604+4304 (A) | 241.097473 | 43.081150 | 0.898 | 623 / | 134 | ||||
| Cl1604+4314 (B) | 241.105011 | 43.239220 | 0.865 | 385 / | 76 | ||||
| Cl1604+4316 (C) | 241.031623 | 43.263130 | 0.935 | 500 / | 2 | ||||
| Cl1604+4321 (D) | 241.138651 | 43.353430 | 0.923 | 500 / | 2 | ||||
| Cl1605+4322 (F) | 241.213137 | 43.370908 | 0.936 | 500 / | 2 | ||||
| Cl1604+4324 (G) | 240.937542 | 43.405199 | 0.899 | 500 / | 2 | ||||
| Cl1604+4322 (H) | 240.896481 | 43.373087 | 0.853 | 500 / | 2 |
Note. — † Cluster centroids determined as the median redshift of member galaxies within 1 Mpc; ‡ in units of erg s-1 cm-2; ∗ in units of erg s-1; ∗∗ in units of erg s-1; assuming and = 180 kpc
References
- Bahcall & Soneira (1984) Bahcall, N. A. & Soneira, R. M. 1984, ApJ, 277, 27
- Barnes & Hernquist (1991) Barnes, J. E. & Hernquist, L. E. 1991, ApJ, 370, L65
- Basilakos, Georgakakis, Plionis, & Georgantopoulos (2004) Basilakos, S., Georgakakis, A., Plionis, M., & Georgantopoulos, I. 2004, ApJ, 607, L79
- Bauer, Alexander, Brandt, Hornschemeier, Vignali,Garmire, & Schneider (2002) Bauer, F. E., Alexander, D. M., Brandt, W. N., Hornschemeier, A. E., Vignali, C., Garmire, G. P. & Schneider, D. P. 2002, AJ, 124, 2351
- Bertin & Arnouts (1996) Bertin, E. & Arnouts, S. 1996, A&AS, 117, 393
- Borgani, Rosati, Tozzi, & Norman (1999) Borgani, S., Rosati, P., Tozzi, P., & Norman, C. 1999, ApJ, 517, 40
- Branchesi, Gioia, Fanti, Fanti, & Cappelluti (2007) Branchesi, M., Gioia, I. M., Fanti, C., Fanti, R., & Cappelluti, N. 2007, A&A, 462, 449
- Brandt, Alexander, Hornschemeier, Garmire, Schneider, Barger, Bauer, Broos, Cowie, Townsley, Burrows, Chartas, Feigelson, Griffiths, Nousek, & Sargent (2001) Brandt, W. N., Alexander, D. M., Hornschemeier, A. E., Garmire, G. P., Schneider, D. P., Barger, A. J., Bauer, F. E., Broos, P. S., et al. 2001, AJ, 122, 2810
- Brandt & Hasinger (2005) Brandt, W. N. & Hasinger, G. 2005, ARA&A, 43, 827
- Cappelluti, Cappi, Dadina, Malaguti, Branchesi, D’Elia, & Palumbo (2005) Cappelluti, N., Cappi, M., Dadina, M., Malaguti, G., Branchesi, M., D’Elia, V., & Palumbo, G. G. C. 2005, A&A, 430, 39
- Cappelluti, Hasinger, Brusa, Comastri, Zamorani, Böhringer, Brunner, Civano, Finoguenov, Fiore, Gilli, Griffiths, Mainieri, Matute, Miyaji, & Silverman (2007) Cappelluti, N., Hasinger, G., Brusa, M., Comastri, A., Zamorani, G., Böhringer, H., Brunner, H., Civano, F., et al. 2007, ApJS, 172, 341
- Cappi, Mazzotta, Elvis, Burke, Comastri, Fiore, Forman, Fruscione, Green, Harris, Hooper, Jones, Kaastra, Kellogg, Murray, McNamara, Nicastro, Ponman, Schlegel, Siemiginowska, Tananbaum, Vikhlinin, Virani, & Wilkes (2001) Cappi, M., Mazzotta, P., Elvis, M., Burke, D. J., Comastri, A., Fiore, F., Forman, W., Fruscione, A., et al. 2001, ApJ, 548, 624
- (13) Castander, F. J., Ellis, R. S., Frenk, C. S., Dressler, A., & Gunn, J. E. ApJ, 424, L79
- Colberg, White, Yoshida, MacFarland, Jenkins, Frenk, Pearce, Evrard, Couchman, Efstathiou, Peacock, Thomas, & The Virgo Consortium (2000) Colberg, J. M., White, S. D. M., Yoshida, N., MacFarland, T. J., Jenkins, A., Frenk, C. S., Pearce, F. R., Evrard, A. E., et al. 2000, MNRAS, 319, 209
- Cowie, Garmire, Bautz, Barger, Brandt, & Hornschemeier (2002) Cowie, L. L., Garmire, G. P., Bautz, M. W., Barger, A. J., Brandt, W. N., & Hornschemeier, A. E. 2002, ApJ, 566, L5
- Crawford, Jauncey, & Murdoch (1970) Crawford, D. F., Jauncey, D. L., & Murdoch, H. S. 1970, ApJ, 162, 405
- Davis, Faber, Newman, Phillips, Ellis, Steidel, Conselice, Coil, Finkbeiner, Koo, Guhathakurta, Weiner, Schiavon, Willmer, Kaiser, Luppino, Wirth, Connolly, Eisenhardt, Cooper, & Gerke (2003) Davis, M., Faber, S. M., Newman, J., Phillips, A. C., Ellis, R. S., Steidel, C. C., Conselice, C., Coil, A. L., et al. 2003, in Presented at the Society of Photo-Optical Instrumentation Engineers (SPIE) Conference, Vol. 4834, Discoveries and Research Prospects from 6- to 10-Meter-Class Telescopes II. Edited by Guhathakurta, Puragra. Proceedings of the SPIE, Volume 4834, pp. 161-172 (2003)., ed. P. Guhathakurta, 161–172
- D’Elia, Fiore, Elvis, Cappi, Mathur, Mazzotta, Falco, & Cocchia (2004) D’Elia, V., Fiore, F., Elvis, M., Cappi, M., Mathur, S., Mazzotta, P., Falco, E., & Cocchia, F. 2004, A&A, 422, 11
- Demarco, Rosati, Lidman, Girardi, Nonino, Rettura, Strazzullo, van der Wel, Ford, Mainieri, Holden, Stanford, Blakeslee, Gobat, Postman, Tozzi, Overzier, Zirm, Benítez, Homeier, Illingworth, Infante, Jee, Mei, Menanteau, Motta, Zheng, Clampin, & Hartig (2007) Demarco, R., Rosati, P., Lidman, C., Girardi, M., Nonino, M., Rettura, A., Strazzullo, V., van der Wel, A., et al. 2007, ApJ, 663, 164
- Dickey & Lockman (1990) Dickey, J. M. & Lockman, F. J. 1990, ARA&A, 28, 215
- Donahue, Voit, Scharf, Gioia, Mullis, Hughes, & Stocke (1999) Donahue, M., Voit, G. M., Scharf, C. A., Gioia, I. M., Mullis, C. R., Hughes, J. P., & Stocke, J. T. 1999, ApJ, 527, 525
- Dressler & Shectman (1988) Dressler, A. & Shectman, S. A. 1988, AJ, 95, 985
- Ebeling, Barrett, Donovan, Ma, Edge, & van Speybroeck (2007) Ebeling, H., Barrett, E., Donovan, D., Ma, C.-J., Edge, A. C., & van Speybroeck, L. 2007, ApJ, 661, L33
- (24) Ebeling, H., Edge, A. C., & Henry, J. P. 2001a, ApJ, 553, 668
- (25) Ebeling, H., Jones, L. R., Fairley, B. W., Perlman, E., Scharf, C., & Horner, D. 2001b, ApJ, 548, L23
- Einasto, Einasto, Tago, Müller, & Andernach (2001) Einasto, M., Einasto, J., Tago, E., Müller, V., & Andernach, H. 2001, AJ, 122, 2222
- Evrard, MacFarland, Couchman, Colberg, Yoshida, White, Jenkins, Frenk, Pearce, Peacock, & Thomas (2002) Evrard, A. E., MacFarland, T. J., Couchman, H. M. P., Colberg, J. M., Yoshida, N., White, S. D. M., Jenkins, A., Frenk, C. S., et al. 2002, ApJ, 573, 7
- Faber, Phillips, Kibrick, Alcott, Allen, Burrous, Cantrall, Clarke, Coil, Cowley, Davis, Deich, Dietsch, Gilmore, Harper, Hilyard, Lewis, McVeigh, Newman, Osborne, Schiavon, Stover, Tucker, Wallace, Wei, Wirth, & Wright (2003) Faber, S. M., Phillips, A. C., Kibrick, R. I., Alcott, B., Allen, S. L., Burrous, J., Cantrall, T., Clarke, D., et al. 2003, in Presented at the Society of Photo-Optical Instrumentation Engineers (SPIE) Conference, Vol. 4841, Instrument Design and Performance for Optical/Infrared Ground-based Telescopes. Edited by Iye, Masanori; Moorwood, Alan F. M. Proceedings of the SPIE, Volume 4841, pp. 1657-1669 (2003)., ed. M. Iye & A. F. M. Moorwood, 1657–1669
- Fang, Gerke, Davis, Newman, Davis, Nandra, Laird, Koo, Coil, Cooper, Croton, & Yan (2007) Fang, T., Gerke, B. F., Davis, D. S., Newman, J. A., Davis, M., Nandra, K., Laird, E. S., Koo, D. C., et al. 2007, ApJ, 660, L27
- Freeman, Kashyap, Rosner, & Lamb (2002) Freeman, P. E., Kashyap, V., Rosner, R., & Lamb, D. Q. 2002, ApJS, 138, 185
- Gal, Lemaux, Lubin, Kocevksi, & Squires (2008) Gal, R. R., Lemaux, B. C., Lubin, L. M., Kocevksi, D., & Squires, G. K. 2008, ArXiv e-prints, 0803.3842
- Gal & Lubin (2004) Gal, R. R. & Lubin, L. M. 2004, ApJ, 607, L1
- Gal, Lubin, & Squires (2005) Gal, R. R., Lubin, L. M., & Squires, G. K. 2005, AJ, 129, 1827
- Garmire, Bautz, Ford, Nousek, & Ricker (2003) Garmire, G. P., Bautz, M. W., Ford, P. G., Nousek, J. A., & Ricker, Jr., G. R. 2003, in X-Ray and Gamma-Ray Telescopes and Instruments for Astronomy. Edited by Joachim E. Truemper, Harvey D. Tananbaum. Proceedings of the SPIE, Volume 4851, pp. 28-44 (2003)., ed. J. E. Truemper & H. D. Tananbaum, 28–44
- Gilli, Daddi, Zamorani, Tozzi, Borgani, Bergeron, Giacconi, Hasinger, Mainieri, Norman, Rosati, Szokoly, & Zheng (2005) Gilli, R., Daddi, E., Zamorani, G., Tozzi, P., Borgani, S., Bergeron, J., Giacconi, R., Hasinger, G., et al. 2005, A&A, 430, 811
- Gilmour, Gray, Almaini, Best, Wolf, Meisenheimer, Papovich, & Bell (2007) Gilmour, R., Gray, M. E., Almaini, O., Best, P., Wolf, C., Meisenheimer, K., Papovich, C., & Bell, E. 2007, MNRAS, 380, 1467
- Gioia, Henry, Mullis, Ebeling, & Wolter (1999) Gioia, I. M., Henry, J. P., Mullis, C. R., Ebeling, H., & Wolter, A. 1999, AJ, 117, 2608
- Gioia, Maccacaro, Schild, Wolter, Stocke, Morris, & Henry (1990) Gioia, I. M., Maccacaro, T., Schild, R. E., Wolter, A., Stocke, J. T., Morris, S. L., & Henry, J. P. 1990, ApJS, 72, 567
- Gladders & Yee (2005) Gladders, M. D. & Yee, H. K. C. 2005, ApJS, 157, 1
- Gómez, Nichol, Miller, Balogh, Goto, Zabludoff, Romer, Bernardi, Sheth, Hopkins, Castander, Connolly, Schneider, Brinkmann, Lamb, SubbaRao, & York (2003) Gómez, P. L., Nichol, R. C., Miller, C. J., Balogh, M. L., Goto, T., Zabludoff, A. I., Romer, A. K., Bernardi, M., et al. 2003, ApJ, 584, 210
- Gunn, Hoessel, & Oke (1986) Gunn, J. E., Hoessel, J. G., & Oke, J. B. 1986, ApJ, 306, 30
- Henry & Briel (1991) Henry, J. P. & Briel, U. G. 1991, A&A, 246, L14
- Hicks, Ellingson, Bautz, Cain, Gilbank, Gladders, Hoekstra, Yee, & Garmire (2007) Hicks, A. K., Ellingson, E., Bautz, M., Cain, B., Gilbank, D., Gladders, M. D., Hoekstra, H., Yee, H., et al. 2007, ArXiv e-prints, 0710.5513
- Hicks, Ellingson, Hoekstra, & Yee (2006) Hicks, A. K., Ellingson, E., Hoekstra, H., & Yee, H. K. C. 2006, ApJ, 652, 232
- Hilton, Collins, Stanford, Lidman, Dawson, Davidson, Kay, Liddle, Mann, Miller, Nichol, Romer, Sabirli, Viana, & West (2007) Hilton, M., Collins, C. A., Stanford, S. A., Lidman, C., Dawson, K. S., Davidson, M., Kay, S. T., Liddle, A. R., et al. 2007, ApJ, 670, 1000
- Holden, Stanford, Rosati, Squires, Tozzi, Fosbury, Papovich, Eisenhardt, Elston, & Spinrad (2001) Holden, B. P., Stanford, S. A., Rosati, P., Squires, G., Tozzi, P., Fosbury, R. A. E., Papovich, C., Eisenhardt, P., et al. 2001, AJ, 122, 629
- Homeier, Mei, Blakeslee, Postman, Holden, Ford, Bradley, Demarco, Franx, Illingworth, Jee, Menanteau, Rosati, van der Wel, & Zirm (2006) Homeier, N. L., Mei, S., Blakeslee, J. P., Postman, M., Holden, B., Ford, H. C., Bradley, L. D., Demarco, R., et al. 2006, ApJ, 647, 256
- Horner (2001) Horner, D. J. 2001, PhD thesis, University of Maryland College Park
- Hudaverdi, Kunieda, Tanaka, Haba, Furuzawa, Tawara, & Ercan (2006) Hudaverdi, M., Kunieda, H., Tanaka, T., Haba, Y., Furuzawa, A., Tawara, Y., & Ercan, E. N. 2006, PASJ, 58, 931
- Johnson, Best, Zaritsky, Clowe, Aragón-Salamanca, Halliday, Jablonka, Milvang-Jensen, Pelló, Poggianti, Rudnick, Saglia, Simard, & White (2006) Johnson, O., Best, P., Zaritsky, D., Clowe, D., Aragón-Salamanca, A., Halliday, C., Jablonka, P., Milvang-Jensen, B., et al. 2006, MNRAS, 371, 1777
- Johnson, Best, & Almaini (2003) Johnson, O., Best, P. N., & Almaini, O. 2003, MNRAS, 343, 924
- Kaiser (1986) Kaiser, N. 1986, MNRAS, 222, 323
- (53) Kim, D.-W., Cameron, R. A., Drake, J. J., Evans, N. R., Freeman, P., Gaetz, T. J., Ghosh, H., Green, P. J., et al. 2004a, ApJS, 150, 19
- (54) Kim, D.-W., Wilkes, B. J., Green, P. J., Cameron, R. A., Drake, J. J., Evans, N. R., Freeman, P., Gaetz, T. J., et al. 2004b, ApJ, 600, 59
- Kim, Kim, Wilkes, Green, Kim, Anderson, Barkhouse, Evans, Ivezić, Karovska, Kashyap, Lee, Maksym, Mossman, Silverman, & Tananbaum (2007) Kim, M., Kim, D.-W., Wilkes, B. J., Green, P. J., Kim, E., Anderson, C. S., Barkhouse, W. A., Evans, N. R., et al. 2007, ApJS, 169, 401
- Kocevksi, Fassnacht, Lubin, Lemaux, Gal, & Squires (2008) Kocevksi, D., Lubin, L. M., Lemaux, B. C., Gal, R. R., Fassnacht, C. D., & Squires, G. K. 2008, in prep
- Kushino, Ishisaki, Morita, Yamasaki, Ishida, Ohashi, & Ueda (2002) Kushino, A., Ishisaki, Y., Morita, U., Yamasaki, N. Y., Ishida, M., Ohashi, T., & Ueda, Y. 2002, PASJ, 54, 327
- Lewis, Balogh, De Propris, Couch, Bower, Offer, Bland-Hawthorn, Baldry, Baugh, Bridges, Cannon, Cole, Colless, Collins, Cross, Dalton, Driver, Efstathiou, Ellis, Frenk, Glazebrook, Hawkins, Jackson, Lahav, Lumsden, Maddox, Madgwick, Norberg, Peacock, Percival, Peterson, Sutherland, & Taylor (2002) Lewis, I., Balogh, M., De Propris, R., Couch, W., Bower, R., Offer, A., Bland-Hawthorn, J., Baldry, I. K., et al. 2002, MNRAS, 334, 673
- Lubin, Brunner, Metzger, Postman, & Oke (2000) Lubin, L. M., Brunner, R., Metzger, M. R., Postman, M., & Oke, J. B. 2000, ApJ, 531, L5
- Lubin, Mulchaey, & Postman (2004) Lubin, L. M., Mulchaey, J. S., & Postman, M. 2004, ApJ, 601, L9
- Lubin, Postman, Oke, Ratnatunga, Gunn, Hoessel, & Schneider (1998) Lubin, L. M., Postman, M., Oke, J. B., Ratnatunga, K. U., Gunn, J. E., Hoessel, J. G., & Schneider, D. P. 1998, AJ, 116, 584
- Markevitch (1998) Markevitch, M. 1998, ApJ, 504, 27
- Martini, Kelson, Kim, Mulchaey, & Athey (2006) Martini, P., Kelson, D. D., Kim, E., Mulchaey, J. S., & Athey, A. A. 2006, ApJ, 644, 116
- Martini, Kelson, Mulchaey, & Trager (2002) Martini, P., Kelson, D. D., Mulchaey, J. S., & Trager, S. C. 2002, ApJ, 576, L109
- Maughan, Jones, Ebeling, & Scharf (2004) Maughan, B. J., Jones, L. R., Ebeling, H., & Scharf, C. 2004, MNRAS, 351, 1193
- Maughan, Jones, Ebeling, & Scharf (2006) —. 2006, MNRAS, 365, 509
- Miyaji, Zamorani, Cappelluti, Gilli, Griffiths, Comastri, Hasinger, Brusa, Fiore, Puccetti, Guzzo, & Finoguenov (2007) Miyaji, T., Zamorani, G., Cappelluti, N., Gilli, R., Griffiths, R. E., Comastri, A., Hasinger, G., Brusa, M., et al. 2007, ApJS, 172, 396
- Molnar, Hughes, Donahue, & Joy (2002) Molnar, S. M., Hughes, J. P., Donahue, M., & Joy, M. 2002, ApJ, 573, L91
- Monet, Levine, Casian, & et al. (2002) Monet, D. G., Levine, S. E., Casian, B., & et al. 2002, VizieR Online Data Catalog, 1284, 0
- Moore, Katz, Lake, Dressler, & Oemler (1996) Moore, B., Katz, N., Lake, G., Dressler, A., & Oemler, A. 1996, Nature, 379, 613
- Mullis, Rosati, Lamer, Böhringer, Schwope, Schuecker, & Fassbender (2005) Mullis, C. R., Rosati, P., Lamer, G., Böhringer, H., Schwope, A., Schuecker, P., & Fassbender, R. 2005, ApJ, 623, L85
- Murdoch, Crawford, & Jauncey (1973) Murdoch, H. S., Crawford, D. F., & Jauncey, D. L. 1973, ApJ, 183, 1
- (73) Nakata, F., Kodama, T., Shimasaku, K., Doi, M., Furusawa, H., Hamabe, M., Kimura, M., & Komiyama, Y. ApJ, 357, 1357
- Oke, Cohen, Carr, Cromer, Dingizian, Harris, Labrecque, Lucinio, Schaal, Epps, & Miller (1995) Oke, J. B., Cohen, J. G., Carr, M., Cromer, J., Dingizian, A., Harris, F. H., Labrecque, S., Lucinio, R., et al. 1995, PASP, 107, 375
- Oke, Postman, & Lubin (1998) Oke, J. B., Postman, M., & Lubin, L. M. 1998, AJ, 116, 549
- Pentericci, Kurk, Carilli, Harris, Miley, & Röttgering (2002) Pentericci, L., Kurk, J. D., Carilli, C. L., Harris, D. E., Miley, G. K., & Röttgering, H. J. A. 2002, A&A, 396, 109
- Postman, Lubin, & Oke (1998) Postman, M., Lubin, L. M., & Oke, J. B. 1998, AJ, 116, 560
- Postman, Lubin, & Oke (2001) —. 2001, AJ, 122, 1125
- Quintana & Melnick (1982) Quintana, H. & Melnick, J. 1982, AJ, 87, 972
- Rosati, Tozzi, Ettori, Mainieri, Demarco, Stanford, Lidman, Nonino, Borgani, Della Ceca, Eisenhardt, Holden, & Norman (2004) Rosati, P., Tozzi, P., Ettori, S., Mainieri, V., Demarco, R., Stanford, S. A., Lidman, C., Nonino, M., et al. 2004, AJ, 127, 230
- Rosati, Tozzi, Giacconi, Gilli, Hasinger, Kewley, Mainieri, Nonino, Norman, Szokoly, Wang, Zirm, Bergeron, Borgani, Gilmozzi, Grogin, Koekemoer, Schreier, & Zheng (2002) Rosati, P., Tozzi, P., Giacconi, R., Gilli, R., Hasinger, G., Kewley, L., Mainieri, V., Nonino, M., et al. 2002, ApJ, 566, 667
- Ruderman & Ebeling (2005) Ruderman, J. T. & Ebeling, H. 2005, ApJ, 623, L81
- Rutledge, Brunner, Prince, & Lonsdale (2000) Rutledge, R. E., Brunner, R. J., Prince, T. A., & Lonsdale, C. 2000, ApJS, 131, 335
- Sarazin (2002) Sarazin, C. L. 2002, in Astrophysics and Space Science Library, Vol. 272, Merging Processes in Galaxy Clusters, ed. L. Feretti, I. M. Gioia, & G. Giovannini, 1–38
- Scoville, Aussel, Brusa, Capak, Carollo, Elvis, Giavalisco, Guzzo, Hasinger, Impey, Kneib, LeFevre, Lilly, Mobasher, Renzini, Rich, Sanders, Schinnerer, Schminovich, Shopbell, Taniguchi, & Tyson (2007) Scoville, N., Aussel, H., Brusa, M., Capak, P., Carollo, C. M., Elvis, M., Giavalisco, M., Guzzo, L., et al. 2007, ApJS, 172, 1
- Shapley (1930) Shapley, H. 1930, Harvard College Observatory Bulletin, 874, 9
- Stanford, Holden, Rosati, Eisenhardt, Stern, Squires, & Spinrad (2002) Stanford, S. A., Holden, B., Rosati, P., Eisenhardt, P. R., Stern, D., Squires, G., & Spinrad, H. 2002, AJ, 123, 619
- Stanford, Holden, Rosati, Tozzi, Borgani, Eisenhardt, & Spinrad (2001) Stanford, S. A., Holden, B., Rosati, P., Tozzi, P., Borgani, S., Eisenhardt, P. R., & Spinrad, H. 2001, ApJ, 552, 504
- Sutherland & Saunders (1992) Sutherland, W. & Saunders, W. 1992, MNRAS, 259, 413
- Swinbank, Edge, Smail, Stott, Bremer, Sato, van Breukelen, Jarvis, Waddington, Clewley, Bergeron, Cotter, Dye, Geach, Gonzalez-Solares, Hirst, Ivison, Rawlings, Simpson, Smith, Verma, & Yamada (2007) Swinbank, A. M., Edge, A. C., Smail, I., Stott, J. P., Bremer, M., Sato, Y., van Breukelen, C., Jarvis, M., et al. 2007, MNRAS, 379, 1343
- Taylor, Mann, Efstathiou, Babbedge, Rowan-Robinson, Lagache, Lawrence, Mei, Vaccari, Héraudeau, Oliver, Dennefeld, Perez-Fournon, Serjeant, González-Solares, Puget, Dole, & Lari (2005) Taylor, E. L., Mann, R. G., Efstathiou, A. N., Babbedge, T. S. R., Rowan-Robinson, M., Lagache, G., Lawrence, A., Mei, S., et al. 2005, MNRAS, 361, 1352
- Tozzi, Rosati, Nonino, Bergeron, Borgani, Gilli, Gilmozzi, Hasinger, Grogin, Kewley, Koekemoer, Norman, Schreier, Szokoly, Wang, Zheng, Zirm, & Giacconi (2001) Tozzi, P., Rosati, P., Nonino, M., Bergeron, J., Borgani, S., Gilli, R., Gilmozzi, R., Hasinger, G., et al. 2001, ApJ, 562, 42
- Tran, Kelson, van Dokkum, Franx, Illingworth, & Magee (1999) Tran, K.-V. H., Kelson, D. D., van Dokkum, P., Franx, M., Illingworth, G. D., & Magee, D. 1999, ApJ, 522, 39
- Tully, Scaramella, Vettolani, & Zamorani (1992) Tully, R. B., Scaramella, R., Vettolani, G., & Zamorani, G. 1992, ApJ, 388, 9
- Valtchanov, Pierre, Willis, Dos Santos, Jones, Andreon, Adami, Altieri, Bolzonella, Bremer, Duc, Gosset, Jean, & Surdej (2004) Valtchanov, I., Pierre, M., Willis, J., Dos Santos, S., Jones, L., Andreon, S., Adami, C., Altieri, B., et al. 2004, A&A, 423, 75
- Vikhlinin, VanSpeybroeck, Markevitch, Forman, & Grego (2002) Vikhlinin, A., VanSpeybroeck, L., Markevitch, M., Forman, W. R., & Grego, L. 2002, ApJ, 578, L107
- White, Clowe, Simard, Rudnick, De Lucia, Aragón-Salamanca, Bender, Best, Bremer, Charlot, Dalcanton, Dantel, Desai, Fort, Halliday, Jablonka, Kauffmann, Mellier, Milvang-Jensen, Pelló, Poggianti, Poirier, Rottgering, Saglia, Schneider, & Zaritsky (2005) White, S. D. M., Clowe, D. I., Simard, L., Rudnick, G., De Lucia, G., Aragón-Salamanca, A., Bender, R., Best, P., et al. 2005, A&A, 444, 365
- Xue & Wu (2000) Xue, Y.-J. & Wu, X.-P. 2000, ApJ, 538, 65
- Yang, Mushotzky, Barger, & Cowie (2006) Yang, Y., Mushotzky, R. F., Barger, A. J., & Cowie, L. L. 2006, ApJ, 645, 68
- Yang, Mushotzky, Barger, Cowie, Sanders, & Steffen (2003) Yang, Y., Mushotzky, R. F., Barger, A. J., Cowie, L. L., Sanders, D. B., & Steffen, A. T. 2003, ApJ, 585, L85