11email: azurita@ugr.es 22institutetext: Instituto Carlos I de Física Teórica y Computación 33institutetext: Kapteyn Astronomical Institute, University of Groningen, Postbus 800, Groningen 9700 AV, the Netherlands
33email: isa@astro.rug.nl
Where are the stars of the bar of NGC 1530 forming?
Abstract
Aims. NGC 1530 has one of the strongest bars ever observed and recent star formation sites are distributed across its bar. Our aim is to study the photometric properties of the bar and its H ii regions, to elucidate the conditions under which H ii regions form and their spatial relation to the principal dynamical features of the bar.
Methods. We obtained and H photometry of the H ii regions of the bar in NGC 1530. Broad–band integrated colours and H equivalent widths were carefully measured and analysed as a function of position with respect to the main dust–lanes of the bar.
Results. We measured differences in the H equivalent widths of the H ii regions that are located in the trailing and leading sides of the bar dust–lane. The possible factors that could produce this difference, such as [N ii] contamination, Lyman–continuum–photon dust–extinction, escape of ionizing radiation, metallicity, IMF and age, were carefully analysed. Age differences were confirmed to be the most plausible explanation. This implies that H ii regions that are located further away from the bar dust–lane in its leading side, downstream from the main bar dust–lane, are older than the rest by Myr. In addition, a clear spatial correlation has been found between: location of H ii regions, dust spurs on the trailing side of the bar dust–lane, and the loci of maximum velocity gradients parallel to the bar major axis (possibly tracing gas flow towards the main bar dust–lane).These results support the hypothesis that massive stars are forming on the trailing side of the bar dust–lane, and age as they cross the bar, on a timescale that is compatible with the bar dynamics timescale.
Key Words.:
Galaxies: general – Galaxies: individual (NGC 1530) – Galaxies: ISM – Galaxies: spiral– Galaxies: kinematics and dynamics – ISM: HII regions –1 Introduction
It is commonly believed that the presence or absence of star formation (SF) along bars is determined by the bar strength. Fluid–dynamic simulations of bars (e.g. Athanassoula 1992, 2000) support this statement because they predict that the highest gas–density loci, typically bar dust lanes, are also the loci of strong shocks and high shear in strong bars, which could prevent the collapse of molecular clouds and formation of stars. Therefore, t is frequently stated that SF is not expected to occur within bars of strongly–barred galaxies, which is supported by the prototypical example NGC 1300 (e.g. Jogee et al. 2002; Tubbs 1982). There are however several examples of well–known galaxies with strong bars and SF along their bars, such as NGC 1530, NGC 1365, and NGC 7479, which all have bar strengths 0.5, as measured by Block et al. (2004).
The inhibition of SF due to the high velocity of the molecular clouds relative to the bar was studied numerically by Tubbs (1982). It is supported by observations of the spatial anti–correlation between the sites of recent SF, which are traced by H ii regions, and the sites of highest shear along the bar (Zurita et al. 2004; Reynaud & Downes 1998). However, there is observational evidence that even if SF can be inhibited or suppressed along the dust–lanes of strong bars, in some galaxies H ii regions can be present in other locations of the bar structure and not only at the galaxy centres and bar ends (e.g. Martin & Friedli 1997; Sheth et al. 2002; Zurita et al. 2004 and this paper). What determines the presence of star–forming regions along the bar of certain galaxies, and their absence in others? H ii regions are observed in the bars of some galaxies, which implies that suitable conditions may exist for SF at locations within the entire bar structure that are not related to the highest density loci predicted by current models of bars.
The extreme physical conditions within bars, which are sites of for example strong shear, shocks and non-circular velocities (e.g. Pence & Blackman 1984; Athanassoula 1992; Reynaud & Downes 1998; Zurita et al. 2004), and significant magnetic–field strength (e.g. Beck 2002), make them excellent laboratories for studying the physical parameters that, in general, trigger and inhibit star formation. This is because there appears to be no obvious differences between the H ii regions of bars and discs (Martin & Friedli 1999): their physical properties, dust extinction, and equivalent widths are all similar. Observational indications for differences between H ii regions of bars and discs have only been found in the degree of ionization (Martin & Friedli 1999), and the H luminosity function (Rozas et al. 1999), the latter for only one galaxy, NGC 7479, which has suffered a minor–merger event (Laine & Heller 1999; Martin, Lelievre, Roy 2000).
| Band | Date | Telescope | Instrument | Filter | Detector | Exp. Time | Seeing111In final combined image | Reference |
|---|---|---|---|---|---|---|---|---|
| B | 3 Feb 2006 | 2.56m NOT | ALFOSC | Bessel B (#74) | EEV42-40 2Kx2K | 3300s | 0.8′′ | (a) |
| V | 3 Feb 2006 | 2.56m NOT | ALFOSC | Bessel V (#75) | EEV42-40 2Kx2K | 3300s | 0.7′′ | (a) |
| R | 3 Feb 2006 | 2.56m NOT | ALFOSC | Bessel R (#76) | EEV42-40 2Kx2K | 4300s | 0.8′′ | (a) |
| Ks | 7,8 Oct 2001 | 4.2m WHT | INGRID | Ks | Rockwell HgCdTe 1Kx1K | 2820s | 1.8′′ | (b) |
| H | 4 Aug 2001 | 1m JKT | JAG | Ha6626/44 | SITe2 2Kx2K | 41200s | 1.3′′ | (c) |
| 1 As measured in the final combined image |
| References: This paper; Block et al. (2004); Relaño et al. (2005) |
The places and physical conditions that offer suitable conditions for star formation inside bars are not yet well understood. Most of our current knowledge on the location, distribution, and properties of star–forming regions in bars has been derived from a handful of papers centred on their physical properties (Martin & Friedli 1999), and on the general morphology of the H emission (e.g. Phillips 1996; Verley et al. 2007b), and on its relation with the molecular gas (e.g. Sheth et al. 2000, 2002) or with the stellar bar (Martin & Friedli 1997; Verley et al. 2007b).
Recent SF has a range of spatial distributions in bars, which can be traced by H emission. When H is detected in a bar, it appears to originate in: (1) H ii regions distributed along the bar; (2) the nuclear or circumnuclear region with little or no emission from the bar, or (3) the bar and the nuclear region, i.e. an intermediate case between (1) and (2), (Martin & Friedli 1997; Verley et al. 2007b). The second distribution appears to be more common in spirals, and its frequency appears to be rather constant (40%) for different Hubble types from Sa to Sc (Verley et al. 2007b), in contrast to the earlier results of Phillips (1996) for a smaller sample of galaxies. Martin & Friedli (1997) interpreted the different H bar morphologies as stages of an evolutionary sequence of the bar, which has recently been re–hypothesized by Verley et al. (2007b). The sequence initiates with SF distributed along the bar. The gas is then progressively transferred from the bar through gas inflow towards the centre of the galaxy until H emission is only observed in the nuclear or circumnuclear region. This latter stage appears to represent most of the bar lifetime, given its observed frequency (Verley et al. 2007b).
When H emission is detected along bars, the major axes of the bars defined from the stellar and ionized gas emissions are commonly misaligned by up to 30∘(Martin & Friedli 1997; Verley et al. 2007b; Rozas, Zurita, Beckman 2000), with the H bar leading the stellar bar, if we assume trailing spiral arms. The H emission along bars, if present, normally also leads the molecular hydrogen, which is traced by CO, or the bar dust–lanes by an amount that increases with bar strength and ranges from 0 to 800 pc (Sheth et al. 2000, 2002).
The misalignments between gaseous and stellar components strongly confirm that dynamics in bars play an important role in SF. The aim of this paper is to study the properties of the H ii regions of the bar in NGC 1530 to determine the factors that favour SF in the environment of its bar, attending to its dynamical properties. NGC 1530 is an excellent target for this study. It is nearby (distance 37 Mpc), isolated (Verley et al. 2007a), has one of the strongest bars ever observed (bar strength0.73, Block et al. 2004), and strong shear, which has been observed along its prominent straight bar dust–lanes (e.g. Reynaud & Downes 1998; Zurita et al. 2004). On the other hand, it presents regions of current SF along the bar, in spite of the strong shear and shocks observed, that are not limited to the ends of the bar and the nuclear region.
2 Observations
2.1 Broad band optical imaging
Our optical imaging in the and bands was obtained in service mode at the 2.56m Nordic Optical Telescope (NOT) at the Observatorio del Roque de los Muchachos (ORM) in La Palma, with the ALFOSC instrument in imaging mode. The observations were taken on 2006 February 3 in both photometric and excellent seeing conditions, with seeing ranging from 0.6′′up to 0.8′′. The ALFOSC detector is a thinned 20482048 E2V CCD42-40 chip, which provides a field of view of 6.5′6.5′, and a pixel scale of 0.19′′/pix. A summary of the observations details, including total integration times, is given in Table 1.
Three fields of photometric standard stars (Landolt 1992) were taken before and after the observations of the galaxy. They covered a wide range in airmass, , and colours ().
The data reduction was carried out using standard IRAF222IRAF is distributed by the National Optical Astronomy Observatories, which is operated by the Association of Universities for Research in Astronomy, Inc. (AURA) under cooperative agreement with the National Science Foundation. techniques, which included overscan subtraction, and bias and flat field corrections. Cosmic–ray hits were removed from individual images using the IRAF task lacosim (van Dokkum 2001). Afterwards, the sky was subtracted from the individual images, which were then aligned and combined to yield one final image for each broad–band filter.
The IRAF packages apphot and photcal were used to complete aperture photometry of the Landolt standard–star fields and derive the photometric calibration, respectively. The following transformation equations were fitted:
where are the Landolt standard–star magnitudes; the measured instrumental magnitudes; is the airmass; are the zero points per 1 ADU per second for each band; the coefficients of the colour terms, and are the extinction constants. The results of the fits are provided in Table 2. The limiting magnitudes for a signal–to–noise ratio per pixel equal to 3 are 24.5, 24.2 and 24.4 mag arcsec-2 for and respectively.
| Band | zero point | colour coeff. | extinction coeff. |
|---|---|---|---|
| (for 1 ADU s-1) | |||
| 25.940.01 | 0.0290.006 | -0.200.01 | |
| 25.840.01 | -0.0620.003 | -0.1120.007 | |
| 25.670.01 | -0.100.01 | -0.0760.007 |
The images of NGC 1530 were astrometrically–calibrated using the USNO2 catalogue coordinates for the foreground stars of the galaxy images and the IRAF tasks ccmap and msctpeak. The accuracy of the astrometric calibration was 0.21-0.29′′.

Colour maps , , and were also obtained. Before creating them, we degraded the spatial resolution of the individual , and images to the resolution of the band image (the lowest resolution image), using the IRAF package daophot. First, we computed the point spread function (PSF) for each image, then we obtained the PSF matching functions to be convolved with the original and images. Finally, we produced images of PSF identical to the PSF of the band image. The effective spatial resolution of the optical colour maps was then 0.8′′. Some of the colour maps are shown in Fig. 2 and will be discussed in Sect 3.1.
2.2 Broad–band Ks imaging
NGC 1530 was observed in -short or (2.2) using the INGRID camera (Packham et al. 2003), mounted at the Cassegrain focus of the 4.2m William Herschel Telescope (WHT). The details of the observations and the data reduction are given in Section 2 of Block et al. (2004). The final reduced image resulted from a total integration time on source of 2820s under non photometric conditions and has a spatial resolution of 1.8′′ (FWHM) and a field of view of 4′4′.
As for the optical broadband data, the image was astrometrically calibrated using the USNO2 catalogue and following the same procedure as for the optical data. Approximately 35 field stars of the image were employed in the fit. The accuracy of the calibration was 0.2′′-0.3′′, and the pixel scale of the detector was calculated to be 0.2380.001′′/pix.
The image was photometrically calibrated using the Two Micron All Sky Survey (2MASS) point–source catalogue using the Aladin sky atlas (Bonnarel et al. 2000). Non–saturated stars in our image were matched with stars included in the 2MASS catalogue, in particular stars brighter than 15.3 mag. We measured a zero point, for 1 ADU in our image, of 25.50.05. Using this calibration and the plate scale of the INGRID detector, we estimated that the limiting magnitude of the image, at a 3 significance level per pixel, was 19.9 mag arcsec-2 which is in good agreement with the value provided by Block et al. (2004), for the same data set, using a different calibration.
2.3 H imaging
The H observations of NGC 1530 were obtained on August 2001 using the CCD camera of the 1m Jacobus Kapteyn Telescope (JKT) on the ORM. The galaxy was observed through a narrow–band (40Å width) H filter for 4800s and through an broad–band filter. However, for the continuum subtraction our deeper –band image, which was acquired using the NOT (see Sect. 2.1) was employed, after scaling to match the flux level and pixel scale of the original 600s –band image from the JKT.
The observations, data reduction, flux calibration, and production of the H ii region catalogue are described in detail in Relaño et al. (2005). The continuum subtraction was performed as described in Relaño et al. (2005) but using the deeper image described above.
For the purposes of this paper, the astrometry of the H and continuum images was improved using the USNO2 catalogue and the procedure described above, for the broad–band images of NGC 1530. The accuracy of the calibration was 0.24′′.
The bandwidth of the H filter includes partial emission from [N ii] at the corresponding red-shifted wavelengths of the [N ii]6548Å and [N ii]6584Å emission lines. In addition, the filter used for continuum subtraction contains bright emission lines (namely [N ii]6548, H, [N ii]6584 and [S ii]6717, 6731). The effects of these contaminations have opposite senses. If not taken into account, the former overestimates the emitted H, while the latter produces an underestimation of the emitted H, due to an overestimation of the continuum emission in the H ii regions.

A proper correction of the [N ii] contamination requires spectroscopic information for the H ii regions. Unfortunately, spectroscopy is only available in the literature for two H ii regions of the bar of NGC 1530 (Márquez et al. 2002), both located at 60-70′′ from the galaxy centre. Greve et al. (1999) completed long–slit spectroscopy along the bar of NGC 1530. They do not, however, report the line ratios for integrated fluxes from the H ii regions. The mean H ii region line ratios measured by Márquez et al. (2002) were 0.279 and 0.304, for [N ii]6584/H and [S ii]6717, 6731/H, respectively. We assumed that these flux ratios are representative of the H ii regions of the bar of NGC 1530. Using this information, the transmission curves of the H and –band filter, and assuming that [N ii]6584/[N ii]6548=1.34, we estimate that the [N ii] lines contribute up to 21.7% of the measured H fluxes. In contrast, the inclusion of emission lines in the continuum filter equals only 0.02–0.05% of the total continuum emitted by the H ii regions, which implies that a correction of 2% of the measured H is required. This in turn implies that an average value of 19.7% of the measured H luminosity over the continuum–subtracted image, needs to be subtracted from the measurements, to derive the actual H emission alone (as can be seen Fig. 1a). Variations in the [N ii]/H ratio are expected to occur from region to region. This point will be discussed further in Sect. 5.
The H ii region H luminosities given throughout this paper contain the calculated 19.7% correction, except in the cases in which it is specifically noted that measurements come from H plus [N ii] emission.
3 Analysis and results
3.1 Morphology and surface photometry in the bar region
The bar of NGC 1530, which has a major axis length of 24 kpc and a bar class 7 (Buta et al. 2003), is one of the largest and strongest ever observed, and therefore one of the most extensively studied (e.g. Regan et al. 1995, 1996, 1997; Downes et al. 1996, Reynaud & Downes 1998; Greve et al. 1999; Relaño 2004; Zurita et al. 2004).
The bar of NGC 1530 has prominent straight bar dust–lanes visible in the colour maps of Fig. 2d,e,f, which curl around the centre in the inner parts. They are evident in the colour maps as areas of high extinction, which are 0.3 mag and 0.5 mag redder in and respectively, than their surrounding regions. The increasingly red colour along the bar dust–lanes towards the centre of the galaxy, could represent an increasing gas density, which is predicted by numerical models (see e.g. Athanassoula 1992; Pérez et al. 2004). The southeastern dust–lane is less prominent in the inner part than the northwestern one, but the relation is reversed when comparing the most external parts of both dust–lanes. The dust–lanes are offset from the bar major axis by . As shown in Zurita et al. (2004), and reproduced in Fig. 2c of this paper, the bar dust–lanes trace strong shocks in the gas flow around the bar. Other concentrations of dust, which are sometimes called dust spurs, e.g. Sheth et al. (2000), are also observed in the colour maps of NGC 1530, and more clearly in the maps that have better spatial resolution. These are observed on the trailing side of the bar333NGC 1530 rotates clockwise (Zurita et al. 2004)., as red feathers that extend approximately in a perpendicular direction to the main bar dust–lanes (see Fig. 2d,f). They are more clearly seen in the northwestern side of the bar, the closest to the observer, possibly due to projection effects.

The bar of NGC 1530 emits in H (see Fig. 2a). Most of the H emission originates in the central part of the galaxy or inner spiral. The remainder of the emission originates in H ii regions, which photometric properties will be further discussed in the next section, plus a contribution from diffuse ionized gas (Greve et al. 1999). Its detection is limited by the signal–to–noise ratio of our H image. The two brightest H ii regions of the bar are located in the northwestern side. The regions on this side appear to be more widely distributed than the ones on the southeastern side, which are more concentrated in the dust–lane area. The northwestern side of the bar reveals the presence of H ii regions located on the leading and trailing sides of the bar dust–lanes. As stated in the introduction of this paper, the presence of H ii regions on the trailing side of the bar dust–lane is uncommon. Most studies of recent massive SF in bars, have reported the presence of H emission downstream from the stellar bar (e.g. Verley et al. 2007b; Martin & Fiedli 1997; Rozas et al. 2000). However, in some specific galaxies, such as NGC 6946 (Sheth et al. 2002), H emission has also been detected on the trailing side of the bar.
There is a clear spatial correlation between the location of the H ii regions and the dust spurs (Figs. 2d,e,f); the former, however, are not necessarily located at the end of the spurs, as reported by Sheth et al. (2000) for NGC 5383. We note also the presence of three blue knots with no counterpart in H. These are indicated by arrows in Figs. 2d,e. Two knots are located on the trailing side of the bar dust–lane, towards the north and south–east of region number 2, and a third one, at approximately 15′′ south of the galaxy centre, close to a CO clump (Reynaud & Downes 1998). It would be interesting to investigate their origin, which may be linked to early phases of massive star–formation complexes.
To study the light distribution of the NGC 1530 bar, broad–band surface brightness profiles were extracted both along and across the bar, as shown in Figs. 3 and 5, respectively. They were derived from broad–band maps in which the star–forming regions of the bar were masked out; we provide more details on the masking procedure in Sect. 3.2.1. Figure 3 shows , , , and surface brightness profiles along the bar of NGC 1530. The profiles were obtained by averaging flux in slices of 23′′ length, which were orientated at a perpendicular angle to the bar major axis. This slice length choice matches the width of the bar approximately, because at 11′′ from the bar major axis in the direction perpendicular to the bar, the bar peak flux has decreased down to %. The figure clearly shows flat profiles along the bar region; we indicate its approximate limits using dotted lines. According to Elmegreen & Elmegreen (1985), this behaviour is expected for NGC 1530 since they found that Hubble–type galaxies earlier than Sb–Sbc, tend to have uniform intensities along the bar length. However, Seigar & James (1998), for a larger sample, found that only 60% of bars were flat in early–type galaxies.
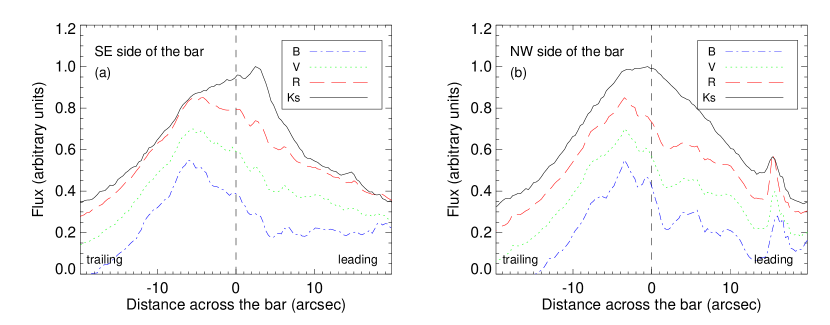
Averaged surface–brightness profiles in the direction perpendicular to the bar (cross–sections) are shown in Fig. 5. The profiles were obtained by averaging flux in slices of 17′′ length orientated in the direction of the bar major axis and centred roughly midway between the galaxy centre and the bar ends. This slice length is of the maximum value that avoids the inclusion of flux from the NGC 1530 inner spiral and from enhanced emission at the bar ends. The same procedure was completed on both halves of the bar. The southeastern bar side profile is plotted in Fig. 5a and the northwestern bar side in Fig. 5b. The profiles are asymmetric. Within from the bar major axis, as represented by a vertical dashed line, the profiles are clearly steeper in the trailing side than in the leading side in the optical bands, but this difference appears to become opposite in the –band profile. Asymmetric cross–sections, with steep leading edges were reported by Seigar & James (1998) using band photometry. Galaxy types earlier than Sb appear to show symmetric cross–sections (Ohta et al. 1990). This asymmetry is also present in the colour profiles in Fig. 5, which show a far steeper colour gradient for the leading side of the bar. Although a major dust concentration on the trailing side of the bar could contribute to the observed asymmetry, the major contribution must come from matter constituting the bar, which is evident in the broad–band images of the bar (e.g. Fig. 2b).

3.2 H equivalent widths and BVRKs photometry of the H ii regions of the bar
The H ii region catalogue of NGC 1530 was presented in Relaño et al. (2005). A total of 119 H ii regions were catalogued (excluding the centre of the galaxy), with H luminosities ranging from erg s-1 to erg s-1. Of these, approximately 20 H ii regions are located on the bar of the galaxy.
To investigate the properties of the H ii regions of the bar of NGC 1530, we selected the 17 brightest catalogued H ii regions of the bar of the galaxy; the luminosity of three of these regions was too close to the detection limits and they were rejected. For the remaining regions, we measured the H equivalent widths (EWHα) and their broad–band emission.
The H fluxes were obtained from the catalogue. The fluxes in , , and bands were measured using aperture photometry with GAIA444GAIA is a derivative of the Skycat catalogue and image display tool, developed as part of the VLT project at ESO. Skycat and GAIA are free software under the terms of the GNU copyright.. Circular or elliptical apertures were employed, with radii or axes defining integration areas compatible with the area of the H ii regions as catalogued from the H image and the REGION software (Relaño et al. 2005). The same apertures were employed for all broad–band images, after a proper alignment and re-sampling of the FITS images to match the H image pixel size (0.33′′). In a few cases in which the overlapping of H ii regions was important, the area of integration was slightly modified with respect to the one given in the H ii region catalogue, and we measured the H emission within the new apertures. The measured differences between the H luminosities obtained with REGION and GAIA were always smaller than the errors in the H luminosities.
When measuring broad–band fluxes from H ii regions, we were interested only in the radiation emitted by the ionizing cluster of the nebula. However, within the integration aperture we are measuring the contribution from both the ionizing cluster and the underlying population of the disc/bar of the galaxy. To derive the flux from the cluster alone, it was therefore necessary to subtract the contribution from the disc/bar. Subtracting the contribution from the bar/disc is not, however, straightforward because the light distribution of the galaxy is not smooth, which can be seen in Fig. 2b. This subtraction is the major source of uncertainty in the measured H ii region broad–band fluxes and equivalent widths.
We followed four different approaches to quantify the contribution of the underlying population. All assume that H ii regions are transparent to the radiation emitted by this population. Each method is described in detail below.
3.2.1 Methods for quantifying the local background contribution
-
1.
Annular apertures around the H ii regions. The local background for each broad band was determined, using the corresponding image, to be the median value within an annular aperture around each H ii region. The median was calculated after a number of iterations using a sigma–clipping algorithm, which rejects pixels deviating by more than twice the standard deviation from the median value. The inner radius of the aperture was equal to the effective radius of the H ii region. An annular width of 5 pixels (1.7′′) was used in all cases, which corresponds to 270 pc, and provides a good compromise between good sampling and ensuring that the measurement corresponds to the neighbourhood of the H ii region. The areas covered by catalogued H ii regions were masked out before computing the median, to avoid contamination from continuum emission of nearby H ii regions.
-
2.
Growth curves. In most H ii regions, the continuum emission is less extended than the H emitting area, and useful information for determining the local background can be obtained from within the H ii region area, which was masked out in the previous method, determined from the H image in the H ii region catalogue. We derived azimuthally–averaged radial surface–brightness profiles for each H ii region for each broad–band. Then, for each one we determined a suitable radial range not contaminated by emission from the ionizing cluster, which could be used to determine the local background. Finally, we plotted and inspected the growth curve or cumulative flux, as a function of the aperture radius, after subtracting the local background value determined previously. A few iterations were often required before convergent results were obtained. This procedure was repeated interactively for each bar H ii region in each band.
-
3.
Light profiles perpendicular to the bar. Surface–brightness profiles along the direction perpendicular to the bar were obtained at the location of each H ii region in each broad–band image. The value at each pixel of the profile was obtained by median–averaging, in the direction of the bar, the flux for a number of pixels approximately equal to the H ii region size. From these initial profiles a set of smoothed profiles were created applying a median filter with smoothing window sizes between 3 and 7 times the H ii region diameter. Afterwards, these profiles were interactively inspected and compared, and the profile of the highest quality was selected using the criteria that the profiles did not contain detectable continuum emission from the ionizing clusters of the H ii region under consideration, and had not averaged–out excessively large–scale brightness fluctuations in the bar.
-
4.
Average light profiles perpendicular to the bar. A fourth estimate of the local background was obtained using two integrated surface–brightness profiles in the direction perpendicular to the bar. These were obtained as described above but, the value at each pixel of each profile was calculated instead by median–averaging along each side of the bar within regions of length 20 and 30′′ for the eastern and western sides of the bar, respectively, which avoided the galaxy inner region and the edges of the bar. The local background for each region was then obtained by interpolation on the corresponding (eastern or western) averaged, smoothed profile at the position across the bar of the H ii region.
| ID | B | V | R | K |
|---|---|---|---|---|
| mag/sq′′ | mag/sq′′ | mag/sq′′ | mag/sq′′ | |
| 9 | 21.90 0.04 | 21.060.02 | 20.48 0.02 | 17.64 0.04 |
| 1 | 21.68 0.03 | 20.950.03 | 20.40 0.02 | 17.63 0.04 |
| 21 | 21.82 0.04 | 21.060.03 | 20.43 0.02 | 17.58 0.04 |
| 94 | 21.87 0.05 | 21.030.03 | 20.40 0.02 | 17.56 0.04 |
| 57 | 21.63 0.04 | 20.870.03 | 20.33 0.02 | 17.63 0.04 |
| 36 | 22.05 0.05 | 21.230.02 | 20.65 0.02 | 17.75 0.04 |
| 54 | 21.83 0.04 | 21.090.03 | 20.50 0.02 | 17.73 0.04 |
| 51 | 21.73 0.03 | 21.000.03 | 20.41 0.02 | 17.65 0.04 |
| 87 | 21.73 0.05 | 20.990.03 | 20.44 0.02 | 17.65 0.05 |
| 86 | 22.10 0.04 | 21.270.02 | 20.65 0.02 | 17.78 0.04 |
| 28 | 21.88 0.04 | 21.040.03 | 20.41 0.02 | 17.50 0.06 |
| 38 | 21.82 0.04 | 20.990.03 | 20.33 0.02 | 17.49 0.06 |
| 16 | 21.70 0.04 | 20.940.03 | 20.41 0.02 | 17.62 0.05 |
| 13 | 21.71 0.04 | 20.930.03 | 20.37 0.03 | 17.59 0.05 |
| 12 | 21.73 0.04 | 20.980.03 | 20.38 0.02 | 17.57 0.06 |
| 92 | 21.80 0.05 | 21.080.04 | 20.48 0.03 | 17.71 0.06 |
| 37 | 21.78 0.05 | 21.090.05 | 20.52 0.03 | 17.71 0.06 |
3.2.2 Analysis of measured local background values
Using the four previously–derived local–background estimates for each H ii region in each broad band (Sect. 3.2.1), we computed the average value (see Table 3). Only methods that yielded realistic values of the underlying stellar–population emission were considered when computing the average. This average value was corrected afterwards for Galactic extinction (Schlegel et al. 1998). The errors were obtained by adding in quadrature errors from each individual method. These, in turn, include the uncertainties in the zero–point photometric calibration, and the extinction constant, and the error inherent to each method.
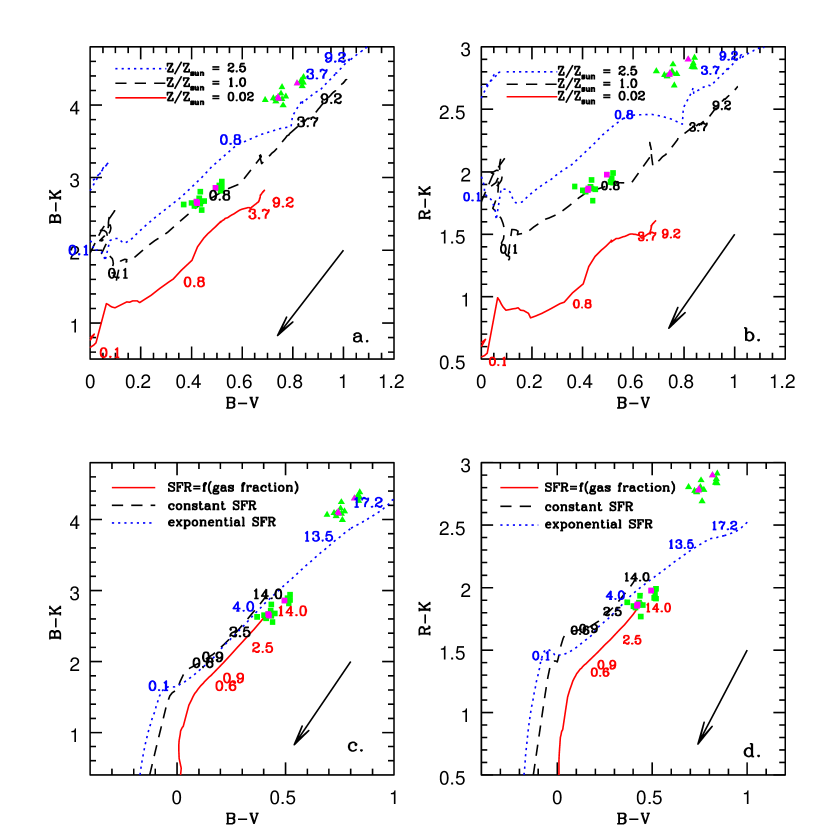
To determine how accurately our local–background measurements represent the underlying disc/bar stellar population, we compared the colours with predictions of stellar population–synthesis models (Bruzual & Charlot 2003; Fioc & Rocca–Volmerange 1997) of different metallicities and SF histories. Some of these comparisons are shown in Fig. 6. The measured local–background colours are compatible with a population of age 0.7–1 Gyr when a single burst of SF is assumed, or 4–18 Gyr for continuous SF. In all cases when assuming the Calzetti et al. (2000) attenuation curve, we must assume a colour excess for our observational data, after Galactic extinction correction, in the range E()=0.25–0.35555A similar colour excess is required when the Cardelli et al. (1989) parametrization of the interstellar extinction is employed for . to obtain colours that are compatible with the models for a wide range of metallicities and star–formation rates. It is beyond the scope of this paper to characterize the stellar population of the NGC 1530 disc/bar. However, the fact that the measured local–background colours agree well with model–galaxy colours, provides confidence on our determination of the underlying stellar–population contribution to the H ii region fluxes. Furthermore, the need for a similar extinction correction in all SF scenarios indicates that a colour excess in the range E()=0.25–0.35 could represent the average extinction in the bar zone. The derived value implies a higher extinction, by approximately mag in the band, in the NGC 1530 bar zone, than disc–averaged extinction values for galaxies of the same morphological type (Bell & Kennicutt 2001); but it is however in good agreement with extinction measurements of opaque areas of galaxies, such as spiral arms (Calzetti 2001), which is expected given the prominence of the bar dust–lanes in NGC 1530. The spread in colours of the individual data points in Fig. 6 could represent differential dust extinction between different local–background regions. Under that assumption, the observed spread in colours implies a standard deviation in visual extinction between local–background regions of mag.
3.2.3 Results on H ii regions photometry
For each H ii region of the bar, four different estimates of the flux in each broad–band image were obtained, which each corresponded to a different estimate of the local background as described in Sect. 3.2.1. Unique values of the EWHα and the , and magnitudes were then calculated for each H ii region. These were measured to be the mean values of the maximum and minimum of the H ii region fluxes that deviated by less than twice the standard deviation from all available flux estimates. The uncertainties in the EWHα and the broad–band magnitudes were computed using the difference between the maximum and minimum values. They therefore represented the range of values covered when using the different estimates of the local background, which are the primary source of uncertainty and much larger than the errors due to photometric calibration or signal–to–noise limitations. The results are shown in Table 4.
| Region | log LHα+[NII] | log EWHα+[NII] | NB | NV | NR | NK | ||||
|---|---|---|---|---|---|---|---|---|---|---|
| ID | (in erg s-1) | (in Å) | (mag) | (mag) | (mag) | (mag) | ||||
| 9 | 39.450.03 | 2.78 0.07 | 20.2 0.3 | 19.9 0.1 | 19.1 0.2 | 16.8 0.4 | 4 | 4 | 4 | 4 |
| 1 | 40.010.01 | 2.79 0.07 | 18.4 0.2 | 18.3 0.2 | 17.7 0.2 | 15.5 0.3 | 4 | 4 | 4 | 4 |
| 21 | 39.230.05 | 2.8 0.2 | 21.1 0.5 | 20.4 0.6 | 19.8 0.5 | 17.3 0.3 | 4 | 4 | 4 | 4 |
| 94 | 38.30.2 | 3.1 0.3 | 23.2 0.3 | 23.3 0.6 | 22.8 0.7 | 19.8 0.7 | 4 | 4 | 4 | 2 |
| 57 | 38.710.09 | 3.0 0.3 | 22.0 0.5 | 21.5 0.4 | 21.2 0.7 | 18.6 0.4 | 4 | 3 | 4 | 4 |
| 36 | 38.910.06 | 2.35 0.05 | 19.8 0.1 | 19.7 0.1 | 19.4 0.1 | 19 1 | 4 | 4 | 4 | 4 |
| 54 | 38.740.08 | 2.40 0.07 | 20.7 0.2 | 20.3 0.1 | 19.9 0.2 | 18.0 0.3 | 4 | 4 | 4 | 4 |
| 51 | 38.780.08 | 2.7 0.1 | 22.1 0.8 | 21.4 0.7 | 20.9 0.5 | 20 2 ∗ | 4 | 4 | 4 | 1 |
| 87 | 38.30.1 | 2.26 0.09 | 21.5 0.3 | 21.1 0.3 | 20.6 0.2 | 18.4 0.1 | 4 | 4 | 4 | 4 |
| 86 | 38.40.2 | 3.15 0.04 | 23.6 0.1 | 23.6 0.1 | 22.6 0.1 | 19.0 1.0 | 2 | 2 | 2 | 2 |
| 28 | 39.010.05 | 2.83 0.07 | 22.2 0.8 | 21.3 0.5 | 20.3 0.2 | 17.5 0.8 | 4 | 4 | 4 | 4 |
| 38 | 38.870.07 | 3.4 0.3 | – | – | 21.90.7 ∗ | 17.5 0.2 | 0 | 0 | 1 | 4 |
| 16 | 39.350.03 | 3.0 0.2 | 21.0 0.3 | 20.5 0.4 | 19.8 0.5 | 18.3 0.9 | 4 | 4 | 4 | 3 |
| 13 | 39.430.03 | 2.77 0.08 | 20.2 0.2 | 19.9 0.2 | 19.1 0.2 | 16.6 0.1 | 3 | 3 | 3 | 3 |
| 12 | 39.430.03 | 2.69 0.08 | 20.2 0.2 | 19.5 0.2 | 18.9 0.2 | 16.1 0.1 | 3 | 3 | 3 | 3 |
| 92 | 38.30.2 | 3.1 0.2 | 23.0 0.3 | 22.5 0.2 | 22.8 0.6 | – | 4 | 3 | 3 | 0 |
| 37 | 38.880.07 | 2.9 0.1 | 23 1 ∗ | 21.3 0.5 ∗ | 20.5 0.2 | 17.5 0.4 | 1 | 1 | 3 | 4 |
For some H ii regions, one or several estimates of the local–background implied a negative value for the flux of the ionizing cluster. Those measurements were rejected, decreasing the number of values from which the final broad–band fluxes were computed (columns 8 to 11 of Table 4).
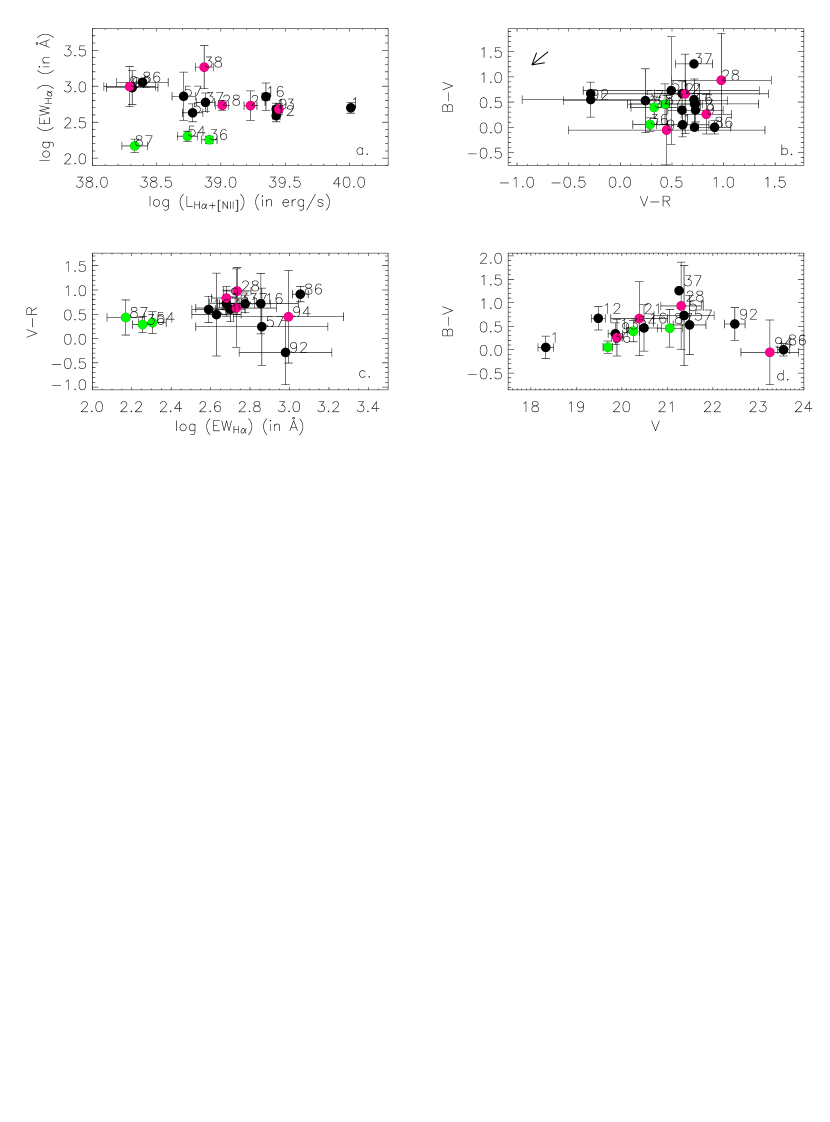
Figure 8 shows the EWHα, the H luminosity, and the broad–band colours of the NGC 1530 bar H ii regions as a function of their deprojected distance to the bar dust–lane. We can see in Fig. 8a that the mean EW is (or EW660 Å with a standard deviation of 450Å). The measured EWHα of the bar H ii regions of NGC 1530 are within typical ranges for measurements of disc H ii regions in spirals (e.g. Bresolin & Kennicutt, 1999; von Hippel & Bothun, 1990; Cedrés et al. 2005).

Our EWHα measurements are, however, a bit higher than those measured by Martin & Friedli (1999) for bar H ii regions in several galaxies, which had a mean distribution value of 250Å, but these authors do indicate that their measurements could be up to twice as large due to the contamination from galactic continuum in their measurements of stellar continuum.
It is interesting to note that the H ii regions located further from the bar dust–lane in the leading side of the bar have lower EWHα, by a factor 4 – 5, or a 0.6-0.7 dex difference in EWHα, than H ii regions located on the trailing side and those closer to the bar dust–lane (see Fig. 8a and Fig. 2d). In terms of broad–band colours and H luminosities there is no obvious difference, within the margins of error, between the H ii regions of lower EWHα and the remainder.
We developed Monte Carlo simulations to measure the statistical significance of finding the lowest EWHα H ii regions in the leading side of the bar of NGC 1530; was this due to chance or had some physical origin? We simulated a random, uniform distribution of EWHα values, at random positions across the bar, both leading and trailing, for 17 H ii regions, which were the number of regions for which we had reliable measurements of EWHα. We then measured the position of the three H ii regions that had the lowest EWHα. The test was repeated 106 times for uniform and normal random position distributions. We then measured the probability that the three H ii regions of the lowest measured EWHα values were located in the leading side of the bar, by chance: we found that the likelihood was low and equal to approximately 12.5%. Therefore, it is very important to study the factors that can produce such differences in EWHα, due to its potential information to elucidate the properties of SF in bar environments.
4 Discussion on the measured H ii region EWHα
The most striking result from the analysis performed in the previous sections comes from the lower measured EWHα for the H ii regions located furthest away from the bar dust–lanes on the leading side of the bar. The relevance of this result is enhanced by the fact that it links both recent star forming regions, through their EWHα, and the gas dynamics of the bar, through the bar dust–lanes. Understanding the origin of this relation can shed light on the processes triggering SF in bars.
The H equivalent width of H ii regions depends on various factors including: the evolutionary status of the H ii region, the initial mass function (IMF) of their associated stellar clusters, their metal content, the ionizing photon leakage from the region, or the dust extinction of ionizing photons emitted from the stellar association. Contamination by [N ii] emission lines within the H filter bandwidth can also artificially increase the EWHα. Absorption by the underlying population of the bar/disc can, in principle, reduce the observed EW; however, for the H line this effect is negligible, because the EWHα is Å for all ranges of metallicities and ages (González–Delgado et al. 2005).
In the next subsections, all of these factors will be discussed in detail. The aim is to constrain the agents which can differentially affect H ii regions of the bar and therefore be responsible of the lower observed EWHα of the H ii regions of the leading side of the NGC 1530 bar.
4.1 Observational effects: contamination by [N ii]
[N ii] contamination in the H fluxes of the H ii regions of the bar can affect differentially the measured EWHα, which we correct by assuming a constant [N ii]6584/H for all H ii regions (see Sect. 2.3). The [N ii]6584/H line ratio depends mainly on the metallicity and ionization parameter, but can also be enhanced due to strong shock excitation.
The observed [N ii]6584/H and [S ii]6717,6731/H line ratios for two bar H ii regions and one circumnuclear region in NGC 1530 by Márquez et al. (2002), are consistent with pure photoionization (Kewley et al. 2001), which excludes a strong contribution from shocks. Spectroscopic observations of bar and disc H ii regions completed by Martin & Friedli (1999) showed that bar H ii regions do not exhibit any systematic evidence of shock ionization. In any case, using the measured maximum deprojected non–circular velocities in the bar of NGC 1530 (160 km s-1, Zurita et al. 2004), we can estimate the [N ii] emission expected for shocks of this velocity. Dopita & Sutherland (1996) models predict a maximum [N ii]6584/H line ratio ranging from 0.21 to 0.70 for a shock velocity of 200 km s-1 and a magnetic–field parameter () varying between 0 and 4 .
According to Fig. 1a, this line ratio implies a contamination from [N ii]6584+6548 in LHα and EWHα for our on–line H filter, ranging from 15% to 38% depending on . Therefore, the maximum difference in LHα and EWHα that we would expect to see from region to region if shock ionization were contributing differentially between H ii regions would be 38% of the measured LHα+[NII] and EWHα+[NII], or a 0.07–0.2 dex difference in EWHα+[NII]. This fails to explain the observed differences in EWHα (0.6–0.7dex) even for the extreme situation in which the regions of lowest EWHα would have a null contribution from shocks, whereas the remainder would have a maximum contribution from ionization produced by shocks.
The differential contamination due to differential metallicity in the H ii regions of the bar can be quantified using Fig. 1b, which was created using the Kewley & Dopita (2002) models and the transmission curves of the two filters used to obtain our H observations. The figure shows the percentage of contamination on the measured LHα, as a function of metallicity, for different values of the ionization parameter, , as defined by Kewley & Dopita (2002). The values of were selected to encompass the values observed for extragalactic H ii regions (Dopita et al. 2000).
To our knowledge there are no published metallicity measurements for the H ii regions of NGC 1530. Therefore we used Márquez et al. (2002) published line ratios (see Sect. 2.3), and the bright emission–line diagnostic diagrams by Kewley & Dopita (2002), to estimate a range of plausible metallicities for the bar H ii regions. Assuming as above that (Dopita et al. 2000), Figs. 4 and 7 of Kewley & Dopita (2002) indicate a metallicity in the range 0.9Z⊙-1.8Z⊙ (or 8.6 (O/H), assuming (O/H)⊙ = 8.66, Allende–Prieto et al. 2001).
Figure 8 of Martin & Friedli (1999) shows, for a sample of 10 barred galaxies, that the maximum metallicity difference between H ii regions of the same galaxy bar varies between 0.02 and 0.18 dex in . Therefore, if the mean metallicity of the NGC 1530 bar H ii regions is equal to 8.6 dex, which is our lower limit estimate, the contamination due to changes in metallicity of dex can vary between 0 and 17% of the observed LHα+[NII]. These values can increase to 7–31%, if the mean metallicity in the bar of NGC 1530 is 8.9 dex, which is the upper limit of our metallicity estimate. Therefore, we could expect a maximum difference in LHα+[NII], or EWHα+[NII], between H ii regions, due to differential [N ii]–contamination produced by differences in metallicity, of up to 0.12 dex.
Therefore, differential [N ii] contamination on the measured LHα+[NII] fluxes, due to different shock contributions to ionization and/or changes in metallicity from region to region, can account for a maximum of a 0.32 dex difference in the measured EWHα, if: (a) shock ionization affects only regions located on the trailing side, and closest to the bar dust–lanes, for a magnetic–field parameter of 4 , and (b) only if these regions have also higher metallicity, by 0.18 dex, and lower for a mean bar metallicity of 8.9 dex. If the bar mean metallicity was lower and/or the conditions before were not met, the maximum difference in EWHα that differential [N ii] contamination could account for, would be much lower than 0.32 dex.
4.2 Ionizing photon extinction and leakage
One important factor that can produce a lower observed EWHα is the loss of ionizing photons before they can ionize the neutral hydrogen and produce H emission by subsequent electron recombination. This loss implies that the measured H luminosity accounts for only a percentage of the Lyman continuum photons (hereinafter Lyc) emitted by the OB association, and implies a lower than predicted observed H equivalent width.
There is widespread observational evidence that non–negligible fractions of Lyc photons are lost because of both dust absorption inside H ii regions (e.g. Inoue 2001), and the escape of Lyc photons from the regions (e.g. Zurita et al. 2000; Castellanos et al. 2002, Relaño et al. 2002). However, estimating the total fraction of Lyc photons lost from an specific H ii region is not straightforward because it requires knowledge of the spectral types for the complete census of individual stars that constitute the ionizing cluster; we could therefore predict the emitted Lyc flux using stellar–atmosphere models and compare the predicted with the observed Lyc flux that is down–converted into recombination lines. The determination of the missing fraction that can be attributed to dust extinction or photon leakage, is even more complicated. Normally, no Lyc–flux dust–extinction is considered when escape fractions are being estimated, and vice versa. Given the distance of NGC 1530, estimating whether dust or photon leakage could be the origin of the low EWHα of the regions on the leading side of the bar, is a complex task and we have to rely on empirical results based on statistical properties of H ii regions and/or theoretical models.

Figure 9 shows the required percentage of lost Lyc photons (due to dust extinction and/or leakage) from the H ii regions of lowest EWHα, which are those located in the leading side, as a function of the same percentage for the remaining H ii regions. The underlying hypothesis is that ionizing–photon extinction and photon leakage, are the only causes of the observed difference in EWHα (Fig. 8a). We now discuss whether current knowledge on these factors can give a natural framework for this plot.
Neither the H ii regions of lowest EWHα, indicated by the green–filled dots in Fig. 8, nor their associated local backgrounds, indicated by purple–filled squares in Fig. 6, are particularly redder than the remainder of the regions. The H ii region colours depend on a number of factors, namely metallicity, age, and more importantly, the dust extinction. Disentangling these effects from the broad–band data alone is impossible. Unfortunately, no Spitzer data is available for NGC 1530, which would help to constraint the dust extinction. However, to first order, the fact that the H ii regions of lowest EWHα are not the reddest of the sample indicates, neglecting any geometrical dust–source distribution and evolutionary effects, that there is not much more dust extinction in the optical bands in the leading than in the trailing side of the bar. This implies that a similar result may be obtained for the ionizing–flux extinction.
Dopita et al. (2003) parametrised the percentage of Lyc photons absorbed by a mixture of dust grains distributed in a spherical shell inside an H ii region. This percentage increases as the metallicity, ionization parameter, and the content of complex polycyclic aromatic carbon (PAH) molecules increases. Assuming that metallicity is approximately constant across the bar of NGC 1530, and assuming an ionization parameter in the range (or ; Dopita et al. 2000), the parameter combination that would account for the largest difference between the leading and trailing sides, for a given metallicity, would imply that H ii regions on the trailing side have the lowest () and 0% content of PAHs in their dust, while H ii regions on the leading side would have and 20% of PAHs, which is an observational upper limit for these molecules. Even in such extreme situations, there would be a 1% and 28% absorption of the total emitted Lyc photons in the trailing and leading H ii regions respectively, assuming a metallicity of (O/H)8.6. These quantities would increase by up to 3% and 42% in the trailing and leading sides for (O/H)8.92. In any case, and if this spherical shell dust morphology were representative of the H ii regions in the bar of NGC 1530, the dust extinction could not explain completely observed differences in EWHα because additional extinction on the leading side would be required, as can be seen in Fig. 9.
A alternative method to estimate the dust extinction of Lyc photons, considers an inhomogeneous interstellar–medium in which gas and dust are distributed in optically–thick clumps of high–density, which are surrounded by a component of lower density (Giammanco et al. 2004; Beckman & Gutiérrez, private communication). In this scenario, the percentage of Lyc photons absorbed by dust is determined by the degree of ionization of the clumps. This translates into a dependence of the Lyc extinction, on the size and the geometrical filling factor666The geometrical filling factor is defined to be the fraction of the total volume of the H ii region occupied by the clumps. It is determined by the clump size and the number density of clumps inside the H ii region (Giammanco et al. 2004). of the H ii region, for a given extinction coefficient or dust grains properties. The H ii regions of lowest EWHα are not particularly different in terms of size than the rest (see e.g. Fig. 2a). Assuming the same extinction coefficient for both sides of the bar, the geometrical filling factor would need to be approximately seventy times larger in the H ii regions of the leading side with respect to that of the trailing side, if the lost fraction in the trailing side were close to zero, and therefore % in the leading side, (see Fig. 9). A geometrical filling factor that is more than three times larger would be required to explain the lost fractions that are as high as 60% and 90%, for the trailing and leading sides, respectively. The same scaling relations apply to the extinction coefficient if the geometrical filling factor is assumed to be constant (Beckman & Gutiérrez, private communication).
Therefore, to explain the differences between the regions of the leading and trailing sides of the bar of NGC 1530 in terms of dust extinction alone, important differences in the interstellar–medium properties, such as the degree of clumpiness and/or composition of the dust, would be required. For dust–shell morphology, dust extinction alone cannot explain the differences observed in EWHα; for clumpy models, the required change in filling factor on such small scale appears unfeasible. In any case, our optical data do not provide clear evidence of enhanced extinction in the regions with the lowest measured EWHα.
Ionizing–photon escape fractions have been directly or indirectly measured to range from 0% up to even 80% of the total Lyc luminosity emitted by the corresponding OB association (e.g. Zurita et al. 2000, 2002; Castellanos et al. 2002, Relaño et al. 2002; Oey & Kennicutt 1997). The luminosity functions of H ii regions in nearby spirals and the distribution of diffuse ionized gas in NGC 157, suggest that the escape fraction increases as the observed LHα increases (Zurita et al. 2000, 2002; Beckman et al. 2000). Figure 8a, however, indicates that the measurements of LHα for the regions with the lowest measured EWHα, are not amongst the highest values measured.
The escape of ionizing photons from H ii regions appears to be a natural consequence of the inhomogeneity of the interstellar medium (Giammanco et al. 2004). For this model the fraction of photon leakage depends on the H ii region radius and on the geometrical filling factor described above. The leakage fraction increases as the H ii region radius and/or the geometrical filling factor decrease (see Fig. 2 of Giammanco et al. 2004). As mentioned above, the H ii regions of the leading side do not differ in size from the remainder regions. Using the clumpy model, the H ii regions located further away from the bar dust–lane on the leading side, would need to have smaller geometrical filling factors, or smaller clumps for a fixed H ii region size, than those located on the trailing side, to allow a higher fraction of ionizing photons to leak. Assuming similar clump size, the fraction of the volume of an H ii region occupied by clumps (i.e. the geometrical filling factor) would be required to be a least 10 times less in the leading side (Giammanco et al. 2004) to produce the leakage implied by Fig. 9.
4.3 Metallicity, IMF and age
The EWHα is a measure of the relative amount of ionizing and continuum photons emitted by the whole stellar cluster associated with the H ii region. It depends on the evolutionary status of the stars, the initial mass function (IMF), and metallicity. Evolutionary–synthesis models such as Starburst99 (Leitherer et al. 1999) can be used to estimate the influence of each parameter on the EWHα. The NGC 1530 bar H ii region metallicity, which was estimated as described in Sect. 4.1, was used as an input for our Starburst99 simulations.
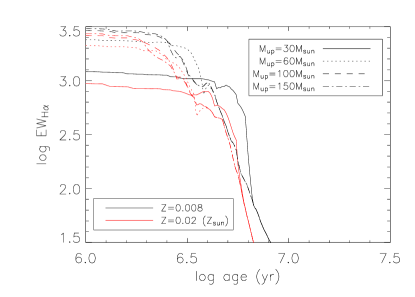
Figure 10 shows the decimal logarithm of the modelled EWHα as a function of the decimal logarithm of the H ii region age for different simulations. We assume a multi–power–law parametrisation of the IMF () with exponents =1.3 for and =2.35 (Salpeter) for . Each simulation corresponds to a different upper mass (Mup) boundary for the IMF (30, 60, 100 or 150M⊙) for two metallicities, Z=0.02 (solar) and Z=0.008777The Geneva stellar evolutionary tracks employed by Starburst99 are still on the scale of the old solar abundance (Vazquez & Leitherer, 2005), in which (O/H)⊙=8.9. On that scale, the metallicity of NGC 1530 is 0.5Z⊙-Z⊙, which determines our selection of metallicity for the Starburst99 simulations., which includes the range of estimated metallicity of the bar of the galaxy.
Differences in the IMF have a larger impact in EWHα for ages Myr (e.g. Bresolin & Kennicutt, 1999). Afterwards, the EWHα becomes almost degenerate with the IMF; the age of an H ii region can be determined approximately when both its EWHα and metallicity are known. We employed the up–to–date version of Starburst99, v5.1, which uses the Geneva stellar–evolutionary tracks with high mass–loss (Schmutz et al. 1992). This version uses non–LTE line–blanketed model atmospheres (Smith et al. 2002), which produce a larger dependence on metallicity in the relation EWHα– age than in the original Leitherer et al. (1999) models.
Assuming that the H ii regions of the bar of NGC 1530 are the result of a single burst of SF, and neglecting other factors that affect the EWHα, which were described in previous subsections, we can use Fig. 10 to determine the age of each H ii region. This age is the average value for all unresolved, non–coeval, star–clusters, which is weighted by the age and size of each cluster, that probably coexist inside each giant H ii region. Figure 10 shows that the evolutionary tracks associated with Mup=30M⊙ are unable to explain the highest observed EWHα, and therefore will not be considered hereinafter. The calculated H ii region ages, as a function of their deprojected distance to the bar dust–lane, are plotted in Figs. 11a and 11b, for metallicities of Z=0.008 and Z=0.02 (solar), respectively. The error bars represent the translation into age of the upper and lower bounds to the measured EWHα (see Table 4).
As expected from Fig. 10, larger differences in age estimates from different Mup occur for the regions with the highest values of EWHα, that is the youngest regions. The dispersion in ages for these high–EWHα H ii regions also increases with metallicity. Figure 11 indicates that the H ii regions located further away from the bar dust–lane on the leading side, are, on average, from 1.4 Myr to 1.7 Myr older than the remaining regions, depending on whether Z=0.008 or Z=0.02, respectively.
We should take into account that this age difference, in the absence of other factors affecting differentially both sets of regions, must be considered as a lower bound. As discussed in Sect. 4.2, a percentage of ionizing photons are absorbed by dust inside the H ii regions and/or escape from the region. Assuming a conservative value of 50% of ionizing photons lost in all H ii regions of the bar, and repeating the exercise of Fig. 11, we derive mean differences ranging from 1.5 to 2.5Myr, for the ranges of Mup and metallicity considered in the Starburst99 simulations.
In summary, there are a number of factors that can decrease the EWHα of the H ii regions which are located furthest away from the NGC 1530 bar dust–lane. Of these, the only factor that could explain the EWHα measurements naturally is age. Other effects such as Lyc–photon dust–extinction and photon leakage, could, in principle, in combination explain the observations, but they would imply important differences in dust composition and interstellar–medium structure within the bar region, on scales of 1 kpc, that appear infeasible. Therefore, it is natural to wonder why the H ii regions of the leading side are older than the remainder. This question will be discussed in then next section.

5 Discussion
We find evidence that the H ii regions on the leading side of the bar dust–lane of NGC 1530 are on average 1.5-2.5 Myr older, than regions on the trailing side of the bar dust–lane. This implies that there has been either a time delay and a location offset for the star formation bursts in the bar of NGC 1530, or an ageing and migration effect of the stars formed initially on the trailing side of the shock region of the bar, towards the leading side.
A priori, there is no indication to suggest that the SF was favoured first on one side of the bar dust–lane (the leading side) and later on, the SF burst has shifted towards the trailing side of the dust–lane. This would imply that on timescales shorter than a few Myrs, the conditions triggering SF have changed, to favour the trailing side with respect to the leading side of the bar dust–lane. It appears infeasible that the bar dynamics and matter distribution have changed in such an insignificant time when compared to the bar orbital–time.
To determine whether the age difference is indeed due to migration from the trailing to the leading side of the bar dust–lane, we develop a test based on the timescale, that is a comparison between the mean age difference of H ii regions located in both sides of the bar dust–lane, and the dynamical crossing–time of a disc cloud/star, in the frame that rotates with the bar. Taking into account the radial galactocentric distance for the lowest EWHα H ii regions, their corresponding disc rotational velocity (Zurita et al. 2004), and the pattern speed of the bar (10 km s-1 kpc-1, Pérez & Zurita 2008), we expect a 0.5 kpc separation of the H ii regions from the bar dust lane in 2 Myr. The measured distances from the bar dust–lane range between 0.6–1.2 kpc. Given the approximation of this estimate we cannot extract firm conclusions, but it shows that the timescales are dynamically plausible to support the migration hypothesis.
One important factor to take into account in this migration hypothesis regards the survival of the star–forming clouds entering the dust–lanes of bars. This effect has been studied by Tubbs (1982). He tested the destruction of dense, pre–stellar clouds in the gravitational field of a strong bar (NGC 5383), and showed that clouds that encounter the straight dust lane at velocities higher than 20 to 60 km s-1 must disperse. The cloud collapse is believed to be caused by an increase in the stellar pressure on the pre–stellar cloud. This pressure increase is directly proportional to the density increase, for a constant temperature. Therefore, not only the relative velocity, but the fractional density enhancement influences the collapse and survival of the cloud. Parameters outside a narrow region of density enhancement and relative velocity do not inhibit the star formation along the bar (Tubbs 1982). For higher relative velocity, larger fractional density enhancement is required inhibit the pre–stellar cloud survival. For NGC 1530, the conditions for pre–stellar cloud survival must be fulfilled because star formation proceeds along the bar; we discuss this point further below.
The hypothesis that stars could form in the trailing side of the bar dust–lane and then migrate towards the leading side, was proposed by Sheth et al. (2000). They hypothesized that stars form in dust spurs, or observed dust–lanes which are approximately perpendicular to the bar, on the bar trailing side. They then continue their elliptical orbits until they ballistically pass through the shocks, inside the main bar dust–lanes, and ionize the neutral gas at the leading side of the bar. Their proposal results from the observed spatial correlation between dust spurs seen in a colour map and the location of the H ii regions along the bar of NGC 5383. Further correlation was found in a later work, by the presence of faint CO spurs towards the trailing side of the main bar dust–lane (Sheth et al. 2002) of a sample of spirals. Other authors have also noticed the presence of dust spurs associated with galaxies with current star formation along the bars (Martin & Friedli 1997).
In addition to the spatial correlation between dust spurs and the location of the H ii regions of the bar of NGC 1530 (Sect. 3.1), the fact that there are several H ii regions located in the trailing side of the bar of NGC 1530, and that these regions are younger than the ones of the leading side, provides further support to the Sheth et al. (2000, 2002) hypothesis. Our results are compatible with the ageing of the recently–formed stars in the spurs as they cross the bar in a timescale compatible with the bar dynamics.
Further evidence supporting this hypothesis comes from the H kinematics. A previous study of the kinematics of the ionized gas of NGC 1530, revealed the presence of velocity gradients in the direction parallel to the bar, as visible in Fig. 11c of Zurita et al. 2004, with strength km s-1 pc-1, which is lower than those associated with the main bar dust–lane. The sites of larger velocity gradients in the direction of the bar, define lines approximately perpendicular to the main bar dust–lane. An offset between these velocity gradients and the centroids of the H ii regions of the bar was already noticed by Zurita et al. (2004), but no conclusion about their origin was reached. The comparison of the velocity gradients parallel to the bar and our colour maps of NGC 1530, shows very good spatial agreement, most notably in the NW side, between the location of dust spurs and the loci of maximum velocity gradient (see Fig. 2f). This strongly suggests that the gradients observed are tracing flows of gas along the spurs towards the main bar dust–lane, of approximately constant velocity. If confirmed, this flow direction along the dust spurs would indicate that in a reference frame comoving with the bar, the gas flowing along the dust spurs would feed the main bar dust–lane. This relative velocity gas–bar is lower in the spurs than in regions outside them, by km s-1, as can be seen from the dips in the residual velocity map (Fig. 11e of Zurita et al. 2004). Although we cannot discard a contribution from outflows from individual H ii regions on the observed velocity gradients (Relaño et al. 2005), this cannot be the dominant effect. The reason is that some of the brightest H ii regions in the arms do not show obvious associated gradients, and in any case, this outflow should be symmetric, and in some cases is only observed towards one side of the H ii regions, even for regions located in the bar.
Dust spurs are also observed in the context of spiral–arm structure. These dust spurs run perpendicularly towards the leading side of the main dust–lane, the one that draws the spiral arm. In the frame of reference rotating with the spiral pattern, the gas arrives from the leading side of the arm to the main dust–lane, in contrast to the bar, for which in its frame of reference, the gas would reach the shock from the trailing side of the bar. Several hypotheses have been proposed to explain the formation of these dust spurs: magnetic effects (Kim & Ostriker 2002), and gravitational instabilities (Chakrabarti et al. 2003; Wada & Koda 2004; Dobbs & Bonnell 2006). There are observations suggesting that star formation occurs in the dust spurs, and then flows towards the main dust–lane (La Vigne et al. 2006). Therefore, it is reasonable to believe that the same phenomenon could be occurring in the dust spurs of the bar region, because of the clear association between the H ii regions and spurs already mentioned.
In summary, the measured H ii region age–differences across the bar are consistent with star formation occurring in the trailing side of the main bar dust–lanes, possibly even in the dust spurs, and continuing their orbits towards the leading side of the main bar dust–lane. There is a theoretical framework for this hypothesis in the context of the spiral arms.
To our knowledge, this paper contains the first measurement of differences in H ii region ages in a bar environment, which are directly linked to dynamical parameters of a bar, by the H ii region positions relative to the main bar dust–lanes. As summarised in Sect. 1, so far most effort to understand SF in bars has concentrated on the general morphology of the H emission and the spatial relation between the different stellar and gaseous components (e.g. Martin & Friedli 1997; Verley et al. 2007b; Sheth et al. 2000, 2002). We show here that not only the general distribution of the H emission in the bar, but the detailed positions and properties of the H ii regions, with respect to the small–scale dynamical and morphological features of the bar, are necessary to understand the conditions under which stars form. We believe that the results presented here, open a new way to study the values of the parameters that cause SF to occur in bar environments and provide valuable information to constrain dynamical models willing to predict star formation in bars.
6 Summary and conclusions
We have carefully analysed the photometric properties of the bar of NGC 1530 and its H ii regions, which are studied in the context of their spatial relation with bar dynamical features. Our main conclusions are:
-
•
The bar of NGC 1530 has flat surface–brightness profiles along the bar in all bands (). The broad–band () surface–brightness profiles across the bar are rather asymmetric and vary with colour: the and band profiles are steeper in the trailing side than in the leading side, while this trend is opposite in the band.
-
•
The H equivalent–widths and broad–band colours of the H ii regions of the bar have been computed after a careful measurement of the local–background emission. The local–background colours are compatible with those expected for the underlying bar/disc stellar population when a colour–excess E()=0.25-0.35 is assumed.
-
•
There is no obvious difference in terms of colours, size or H emission, between the H ii regions located in the trailing side of the bar dust–lane and those located in the leading side.
-
•
The EWHα of the H ii regions located furthest away from the bar dust–lane, on its leading side, is lower than the EWHα of the rest of the H ii regions by a factor (or dex difference in EWHα).
-
•
We have analysed the factors that could account for the observed difference in EWHα: [N ii] contamination, Lyc–photon dust–extinction, the escape of Lyc photons, differences in metallicity, IMF and age. Of these, only the age can account for the observed differences. The measured difference in EWHα implies that the H ii regions located furthest away from the bar dust–lane, in its leading side, are on average Myr older than the rest.
-
•
Colour maps of NGC 1530 show the presence of dust spurs on the trailing side of the bar main dust–lane. The dust spurs reach the main bar dust–lane approximately perpendicularly, and there is a clear spatial correlation between the spurs and the position of H ii regions of the bar.
-
•
There is a good spatial correlation between the location of the spurs and the zones of high velocity gradient in the direction of the bar, strongly suggesting that the gradients are tracing gas flow along the spurs towards the main bar dust–lane. This implies that dust spurs are zones of higher gas density and lower relative velocity with respect to the bar than the surrounding regions.
-
•
The older age for the H ii regions of the leading side, together with the spatial correlation with dust spurs and velocity gradients, provides further support to the hypothesis that star formation in bars occurs in spurs. The ageing of the recently–formed stars, as they cross the bar, is compatible with the bar dynamics timescale.
We believe that the present work shows new important results which favour the hypothesis that star formation in bars takes place principally on the trailing side of the bar, in places where high gas density is present, although not the highest of the bar, but simultaneously low shear and low relative velocity with respect to the bar is found. This highlights the importance of taking into account the dynamics of the bar. In addition, our findings are in good agreement with previous modelling and observations of star formation in the spiral arms.
A detailed study of the bar H ii regions for a larger sample of galaxies, to study their distribution with respect to the dynamical features of the bar, is a necessary step to confirm whether the findings of this paper can be generalized to other bars with SF, and therefore constrain the parameters that allow SF to occur.
Acknowledgements.
We are very grateful to Pierre Martin, John Beckman and Mónica Relaño for useful comments on the manuscript and Pablo Pérez-González for useful discussions on local background subtraction. We acknowledge J.H. Knapen for kindly providing the –band data of NGC 1530. We would like to thank the anonymous referee for comments. A. Zurita acknowledges support from the Consejería de Eduación y Ciencia de la Junta de Andalucía. I. Pérez is supported by a postdoctoral fellowship from the Netherlands Organization for Scientific Research (NWO, VENI-Grant 639.041.511) and the Spanish Plan Nacional del Espacio del Ministerio de Educación y Ciencia. The WHT is operated on the island of La Palma by the Isaac Newton Group in the Spanish Observatorio del Roque de los Muchachos of the Instituto de Astrofísica de Canarias. Based on observations made with the Nordic Optical Telescope, operated on the island of La Palma jointly by Denmark, Finland, Iceland, Norway, and Sweden, in the Spanish Observatorio del Roque de los Muchachos of the Instituto de Astrofísica de Canarias.References
- (1) Allende–Prieto, C., Lambert, D.L., Asplund, M. 2001, ApJ, 556, L63
- (2) Athanassoula, E. 1992, MNRAS, 259, 345
- (3) Athanassoula, E. 2000: in Stars, Gas and Dust in Galaxies: Exploring the Links, Alloin,D., Olsen, K. Galaz, G. (eds.), ASP Conf. Ser. 221, San Francisco, p.243
- (4) Beck, R. 2002: in Disks of Galaxies: Kinematics, Dynamics and Perturbations, Athanassoula, L., Bosma, A., Mujica, R. (eds.), ASP Conf. Ser. 275, San Francisco, p. 331
- (5) Beckman, J.E., Rozas, M., Zurita, A., Watson, R.A., Knapen, J.H. 2000, AJ, 119, 2728
- (6) Bell, E.F., Kennicutt, R.C. 2001, ApJ, 548, 681
- (7) Block, D.L., Buta, R., Knapen, J.H., Elmegreen, D.M., Elmegreen, B.G., Puerari, I. 2004, AJ, 128, 183
- (8) Bonnarel, F., Fernique, P., Bienayme, O., Egret, D., Genova, F., Louys, M., Ochsenbein, F., Wenger, M., Bartlett, J.G. 2000, A&AS, 143,33
- (9) Bresolin, F., Kennicutt, R.C.Jr. 1999, AJ, 113, 975
- (10) Bruzual, G., Charlot, S. 2003, MNRAS, 344, 1000
- (11) Buta, R., Block, D.L., Knapen, J.H. 2003, AJ, 126, 1148
- (12) Calzetti, D., Armus, L., Bohlin, R.C., Kinney, A.L, Koornneef, J., Storchi–Bergmann, T. 2000, ApJ, 533, 682
- (13) Calzetti, D. 2001, PASP, 113, 1449
- (14) Cardelli, J.A., Clayton, G.C., Mathis, J.S. 1989, ApJ, 345, 245
- (15) Castellanos, M., Díaz, A.I., Tenorio–Tagle, G. 2002, ApJ, 565, 79
- (16) Cedrés, B., Cepa, J., Tomita, A. 2005, ApJ, 634, 1043
- (17) Chakrabarti, S., Laughlin, G., Shu, F.H. 2003, ApJ, 596, 220
- (18) Dobbs, C.L., Bonnell, I.A. 2006, MNRAS, 367, 876
- (19) Dopita, M.A., Sutherland, R.S. 1996, ApJS, 102, 161
- (20) Dopita, M.A., Kewley, L.J., Heisler, C.A., Sutherland, R.S. 2000, ApJ, 542, 224
- (21) Dopita, M.A., Groves, B.A., Sutherland, R.S., Kewley, L.J. 2003, ApJ, 727, 731
- (22) Downes, D., Reynaud, D. Solomon, P.M., Radford, S.J.E. 1996, ApJ 461, 186
- (23) Elmegreen, B.G., Elmegreen, D.M. 1985, ApJ, 288, 438
- (24) Fioc, M., Rocca–Volmerange, B. 1997, A&A, 326, 950
- (25) Giammanco, C., Beckman, J.E., Zurita, A., Relaño, M. 2004, A&A, 424, 877
- (26) González–Delgado, R.M., M. Cerviño, Martins, L.P., Leitherer, C., Hauschildt, P.H. 2005, MNRAS, 357, 945
- (27) Greve, A., Reynaud, D., Downes, D. 1999, A&A, 348, 394
- (28) Inoue, A.K. 2001, ApJ, 122, 1788
- (29) Jogee, S., Knapen, J.H., Laine, S., Shlosman, I., Scoville, N.Z., Englmaier, P. 2002, ApJL, 570, 55
- (30) Kewley, L.J., Heisler, C.A., Dopita, M.A., Lumsden, S. 2001, ApJS, 132, 37
- (31) Kewley, L.J., Dopita, M.A. 2002, ApJS, 142, 35
- (32) Kim, W.-T., Ostriker, E.C. 2002, ApJ, 570, 132
- (33) Landolt, A.U. 1992, AJ, 104, 340
- (34) Laine, S., Heller, C.H. 1999, MNRAS, 308, 557
- (35) La Vigne, M.A., Vogel, S.N., Ostriker, E.C. 2006, ApJ, 650, 818
- (36) Leitherer, C., Schaerer, D., Goldader, J.D., González–Delgado, R.M., Robert, C., Kune, D.F., de Mello, D.F., Devost, D., Heckman, T.M. 1999, ApJS, 123,3
- (37) Márquez, I., Masegosa, J., Moles, M., Varela, J., Bettoni, D., Galletta, G. 2002, A&A, 393, 389
- (38) Martin, P, Friedli, D. 1997, A&A, 326, 449
- (39) Martin, P, Friedli, D. 1999, A&A, 346, 769
- (40) Martin, P., Lelièvre, M., Roy, J.R. 2000, ApJ, 538, 141
- (41) Oey, M.S., Kennicutt, R.C.Jr 1997, MNRAS, 291, 827
- (42) Ohta, K., Hamabe, M., Wakamatsu, K. 1990, ApJ, 357, 71
- (43) Packham, C., Thompson, K. L., Zurita, A., Knapen, J. H., Smail, I., Greimel, R., Folha, D. F. M., Benn, C., Humphrey, A., Rutten, R., Ciardi, D., Bec, M., Bingham, R., Craig, S., Dee, K., Ives, D., Jolley, P., Moore, P., Pi i Puig, M., Rees, S., Talbot, G., Worswick, S. 2003, MNRAS, 345, 395
- (44) Pence, W.D., Blackman, C.P. 1984, MNRAS, 207, 9
- (45) Pérez, I., Fux, R., Freeman, K. 2004, A&A, 424, 799
- (46) Pérez, I., Zurita, A. 2008, A&A, in preparation
- (47) Phillips, A.C. 1996: in Barred Galaxies, IAU Colloq. 157, Buta, R., Crocker, D., Elmegreen, B. (eds.), ASP Conf. Ser. 91, San Francisco, p. 44
- (48) Regan, M., Vogel, S., Teuben, P. 1995, ApJ, 449, 576
- (49) Regan, M., Teuben, P., Vogel, S., van der Hulst, T. 1996, AJ, 112, 2549
- (50) Regan, M., Vogel, S., Teuben, P. 1997, ApJ, 482, L143
- (51) Relaño, M., Peimbert, M., Beckman, J.E. 2002, ApJ, 564, 704
- (52) Relaño, M. 2004, PhD Thesis, University of La Laguna, Spain
- (53) Relaño, M., Beckman, J.E., Zurita, A., Rozas, M., Giammanco, C. 2005, A&A, 431, 235
- (54) Reynaud, D., Downes, D. 1998, A&A, 337, 671
- (55) Rozas, M., Zurita, A., Heller, C.H., Beckman J.E. 1999, A&AS, 135, 145
- (56) Rozas, M., Zurita, A., Beckman J.E. 2000, A&A, 207, 354, 823
- (57) Schlegel, D. J., Finkbeiner, D. P., Davis, M. 1998, ApJ, 500, 525
- (58) Seigar, M.S., James, P.A. 1998, A&A, 299, 672
- (59) Sheth, K, Regan, M.W., Vogel, S.N., Teuben, P.J. 2000, ApJ, 532, 221
- (60) Sheth, K, Vogel, S.N., Regan, M. W., Teuben, P.J., Harris, A.I., Thornley, M.D. 2002, AJ, 124, 2581
- (61) Smith, L.J., Norris, R.P.F., Crowther, P.A., 2002, MNRAS, 337, 1309
- (62) Schmutz, W., Leitherer, C., Gruenwald, R. 1992, PASP, 104, 1164
- (63) Tubbs, A.D. 1982, ApJ, 255, 458
- (64) van Dokkum, P.G. 2001, PASP, 113, 1420
- (65) Vazquez, G.A., Leitherer, C. 2005, ApJ, 621, 695
- (66) Verley, S., Leon, S., Verdes–Montenegro, L., Combes, F., Sabater, J., Sulentic, J., Bergond,G., Espada, D., García, E., Lisenfeld, U., Odewahn S.C. 2007a, A&A, 472, 121
- (67) Verley, S., Combes, F., Verdes–Montenegro, L., Bergond, G., Leon, S., 2007b, A&A, 474, 43
- (68) von Hippel, T., Bothun, G. 1990, ApJ, 100, 403
- (69) Wada, K., Koda, J. 2004, MNRAS, 349, 270
- (70) Zurita, A., Beckman, J.E., Rozas, M. 2000, A&A, 363, 9
- (71) Zurita, A. 2001 PhD Thesis, University of La Laguna, Spain
- (72) Zurita, A., Beckman, J.E., Rozas, M., Ryder, S. 2002, A&A, 386, 801
- (73) Zurita, A., Relaño, M., Beckman, J.E., Knapen, J.H. 2004, A&A, 413, 73