A GMRT multifrequency radio study of the isothermal core of the poor galaxy cluster AWM 4
Abstract
We present a detailed radio morphological study and spectral analysis of the wide–angle–tail radio source 4C +24.36 associated with the dominant galaxy in the relaxed galaxy cluster AWM 4. Our study is based on new high sensitivity GMRT observations at 235 MHz, 327 MHz and 610 MHz, and on literature and archival data at other frequencies. We find that the source major axis is likely oriented at a small angle with respect to the plane of the sky. The wide–angle–tail morphology can be reasonably explained by adopting a simple hydrodynamical model in which both ram pressure (driven by the motion of the host galaxy) and buoyancy forces contribute to bend the radio structure. The spectral index progressively steepens along the source major axis from 0.3 in the region close to the radio nucleus to beyond 1.5 in the lobes. The results of the analysis of the spectral index image allow us to derive an estimate of the radiative age of the source of 160 Myr. The cluster X–ray emitting gas has a relaxed morphology and short cooling time, but its temperature profile is isothermal out to at least 160 kpc from the centre. Therefore we seek evidence of energy ejection from the central AGN to prevent catastrophic cooling. We find that the energy injected by 4C +24.36 in the form of synchrotron luminosity during its lifetime is far less than the energy required to maintain the high gas temperature in the core. We also find that it is not possible for the central source to eject the requisite energy in the intracluster gas in terms of the enthalpy of buoyant bubbles of relativistic fluid, without creating discernible large cavities in the existing X–ray XMM–Newton observations.
Subject headings:
galaxies: clusters: general — galaxies: clusters: individual (AWM 4) — intergalactic medium — radio continuum: galaxies — X–rays: galaxies: clusters1. Introduction
In the cores of relaxed clusters and groups of galaxies the cooling time for the hot X–ray emitting intracluster medium (ICM) can be substantially less than the Hubble time (e.g., Edge et al. 1992; Sanderson et al. 2006). In the absence of any substantial sources of heating, the gas in these regions will cool and recombine, constituting a cooling flow (Fabian & Nulsen 1977; Cowie & Binney 1977). However, high resolution X–ray imaging and spectroscopy, using the Chandra and XMM–Newton observatories, reveal unusually low quantities of cooling gas compared to the expectations from the standard cooling flow model (e.g., Fabian 1994), showing that, even in the cores, the gas temperature does not fall below 1–2 keV (e.g., Peterson et al. 2003; Kaastra et al. 2004). The fate of the cooling gas, and the possible involvement of additional heating (feedback) to compensate for the observed radiative losses and regulate the cooling by (re–)heating the gas, remains the subject of an extensive debate.
One of the most promising sources of feedback is the active galactic
nucleus (AGN) harbored in the central dominant galaxy in these systems
(e.g., Tabor & Binney 1993; Nusser et al. 2006; Nulsen et al. 2006;
see also the recent review by McNamara & Nulsen 2007, and references
therein). Indeed, radio and X–ray images provide direct evidence of
the widespread existence of AGN–driven phenomena in an increasing number
of cool core clusters and groups. Evidence of strong interactions between
the radio and thermal plasma can be found in the detection of X–ray
disturbances in the hot gas, such as cavities, edges and filaments,
which appear correlated with the structure of the central radio galaxy
(see for instance the review by Blanton 2004). However, the mechanism of
the energy transfer from the radio source to the surrounding thermal gas
(e.g., shocks, gravity waves, turbulence) is still unclear, as is the
mechanism of the distribution of energy throughout the cooling region
(e.g., McNamara & Nulsen 2007).
The combination of high quality X–ray imaging and high sensitivity
radio observations is a powerful tool to investigate the ICM/AGN
connection in clusters and groups. In particular, the examination
of radio images at multiple frequencies (especially at frequencies
1 GHz) is important to study the cycle of radio activity and
elucidate the timescales and physical mechanisms of the energy
injection. With this aim in mind we recently have embarked upon a
low radio–frequency survey of a sample of groups of galaxies with
the Giant Metrewave Radio Telescope (GMRT). High quality X–ray
images from Chandra and/or XMM–Newton observations show
that most of these systems have a structure in the X–ray suggestive
of strong interaction between the central radio source and the intragroup
gas (Giacintucci et al. in preparation). The survey aims to investigate
the radio source properties over a broad frequency range, examine
the effects of the AGN at various phases of its activity, and study
the geometry, timescales and physical mechanisms of the energy injection.
In this paper we present new GMRT radio images, obtained at 235 MHz, 327 MHz and 610 MHz of the poor cluster of galaxies AWM 4, which belongs to the sample selected for the survey. The cluster hosts the radio source 4C +24.36, which is associated with the central giant elliptical galaxy NGC 6051. The general properties of the system are summarised in Tab. 1, where we provide the following information: J2000 coordinates, redshift, absolute R magnitude of NGC 6051; 1.4 GHz flux density of 4C +24.36 from the NRAO VLA Sky Survey (NVSS; Condon et al. 1998), and the corresponding radio power calculated at the redshift of the optical galaxy111Throughout the paper we assume H0 = 70 km sec-1 Mpc-1, = 0.3, and = 0.7.; we also list the cluster optical velocity dispersion from Koranyi & Geller (2002), and emission–weighted gas temperature of the ICM from O’Sullivan et al. (2005; hereinafter OS05). The linear scale, at the redshift of NGC 6051 given by the cosmology adopted in this paper, is 0.624 kpc per arcsec.
The 1.4 GHz radio power of 4C +24.36 and absolute magnitude of the host galaxy (Tab. 1) place the source on the lower end of the FRI–FRII transition region (e.g., Owen & Ledlow 1994). The source is extended at the 5′′ resolution and sensitivity (0.15 mJy b-1) of the 1.4 GHz image from the FIRST survey (Becker et al. 1995), and shows curved jets traceable up to 50 kpc from the nucleus along the overall direction of the galaxy minor axis.
| NGC 6051 | ||
| RAJ2000 (h,m,s) | 16 04 56.8 | |
| DECJ2000 (∘, ′, ′′) | +23 55 56 | |
| z | 0.0312 | |
| MR | 23.01 | |
| 4C +24.36 | ||
| S (mJy) | 608 | |
| logP (W Hz-1) | 24.15 | |
| AWM 4 | ||
| (km s-1) | 400 (a)(a)Koranyi & Geller (2002); | |
| kT (keV) | 2.5 (b)(b)O’Sullivan et al. (2005). | |
| linear scale | 0.624 kpc |
The outline of the paper is as follows: in Sec. 2 we describe the GMRT radio observations and data reduction; the radio images of 4C +24.36 are presented in Sec. 3; in Sec. 4 we study the integrated radio spectrum and spectral index image of the source, and derive its physical parameters; the results of the radio analysis are discussed in Sec. 5; in Sec. 6 we discuss the X–ray properties of the cluster environment in the context of its radio properties. The summary and conclusions are given in Sec. 7.
2. GMRT observations and data reduction
| Date | Observation | HPBW, PA | rms | ||
|---|---|---|---|---|---|
| (MHz) | (MHz) | time (min) | (, ∘) | (mJy b-1) | |
| 235 | 16 | 2006 Jul 08 | 120 | 12.710.4, 75 | 0.80 |
| 327 | 32 | 2006 Jun 16 | 100 | 9.07.8, 53 | 0.40 |
| 610 | 32 | 2006 Aug 24 | 160 | 5.04.0, 43 | 0.05 |
We observed the radio source 4C +24.36 using the GMRT at the
frequencies of 235 MHz, 327 MHz and 610 MHz. We summarise the
details of the observations in Tab. 2, where we provide
the frequency and total bandwidth, observation date, total time
on source, half power beamwidth (HPBW) of the full array, and rms level
(1) in the full resolution image. The observations were performed
using both the upper and lower side band (USB and LSB) at each frequency,
for a total observing band of 32 MHz at 327 and 610 MHz, and 16 MHz at 235
MHz (Tab. 2). The data were collected in spectral–line mode with 128
channels/band at 327 and 610 MHz, and 64 channels/band at 235 MHz
(the spectral resolution is 125 kHz/channel). At all frequencies, the USB
and LSB datasets were calibrated and reduced individually using the NRAO
Astronomical Image Processing System (AIPS) package. The
flux density scale was set using the sources 3C 286 and 3C 48
as amplitude calibrators and the Baars et al. (1977) coefficients.
Careful editing was necessary to identify and remove the data affected
by radio frequency interference at 235 and 327 MHz.
In order to find a compromise between the size of the dataset and
the need to minimize bandwidth smearing effects within the primary
beam, the central channels in each individual dataset were averaged
to 6 channels of 1 MHz each at 235 MHz, and 2 MHz each at
327 and 610 MHz after bandpass calibration. At each step of the data
reduction we implemented the standard wide–field imaging technique.
After a number of phase self–calibration cycles, the final USB and
LSB datasets were further averaged from 6 channels to 1 single channel
and then combined together to produce the final images of the source.
All images were corrected for the primary beam attenuation.
The residual amplitude errors are of the order of
5 %.
3. The radio images
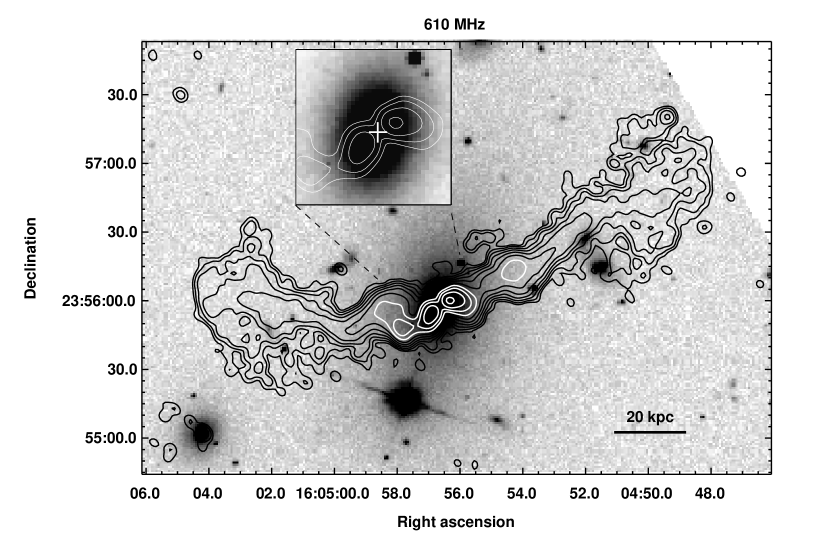
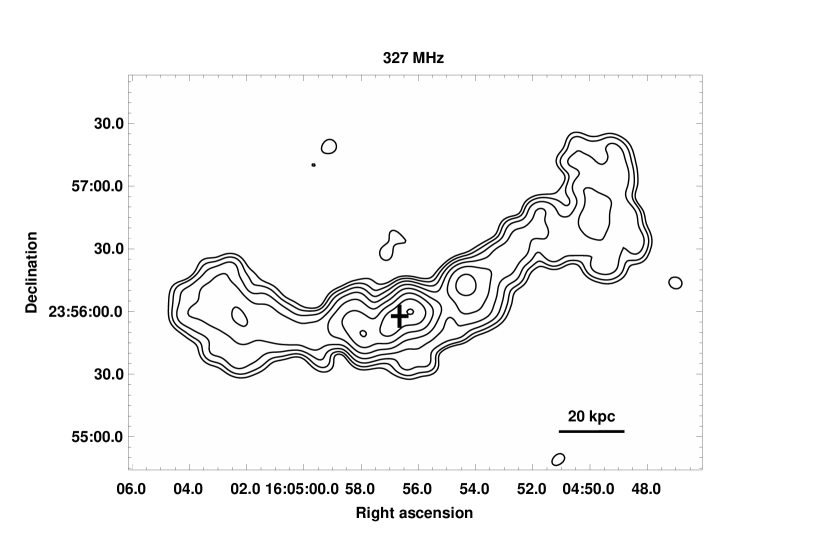
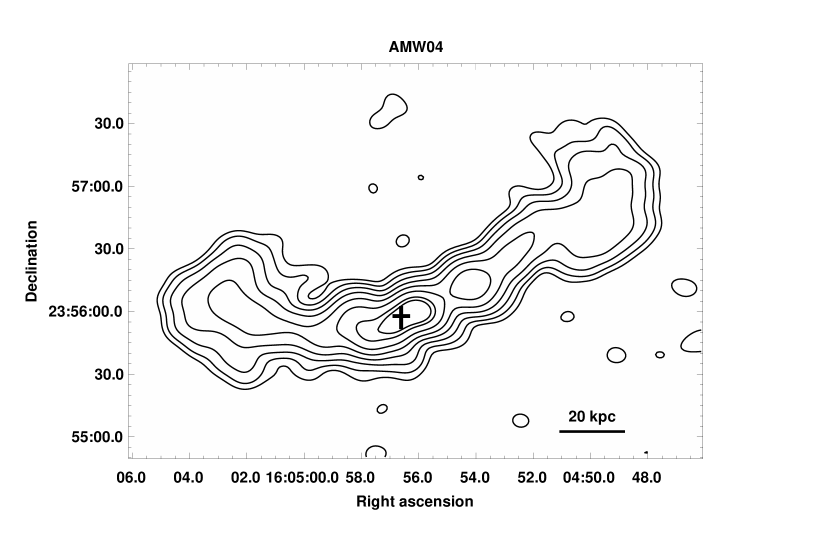
The GMRT 610 MHz image of 4C +24.36 is presented in Fig. 1, superposed on the red optical image from the Sloan Digital Sky Survey. The images at 327 and 235 MHz are shown in the left and right panels of Fig. 2, respectively. The radio galaxy exhibits a very similar morphology at all frequencies and resolution, with twin continuous jets and extended radio lobes slightly bent toward the North. It can be classified as a wide–angle–tail (WAT) source, although the angle between the tails is rather large, i.e. . For comparison, the angle between the tails of the radio galaxy 3C 465, which is considered the prototype of WAT sources, is (e.g., Eilek et al. 1984). Its total angular extent is 250′′ along the South–East/North–West axis in all the images shown in Figs. 1 and 2. The corresponding largest linear size is 160 kpc.
| S | S | S | LS | ||
|---|---|---|---|---|---|
| (Jy) | (Jy) | (Jy) | () | (kpc kpc) | |
| Total source | 2.750.14 | 2.200.11 | 1.450.07 | 0.67 | 160 40 |
| Jet West | 1.090.05 | 0.920.05 | 0.620.03 | 0.59 | 4515 |
| Jet East | 1.010.05 | 0.820.04 | 0.600.03 | 0.55 | 3515 |
| Lobe West | 0.320.02 | 0.230.01 | 0.120.01 | 1.03 | 4036 |
| Lobe East | 0.330.02 | 0.240.01 | 0.110.01 | 1.15 | 4036 |
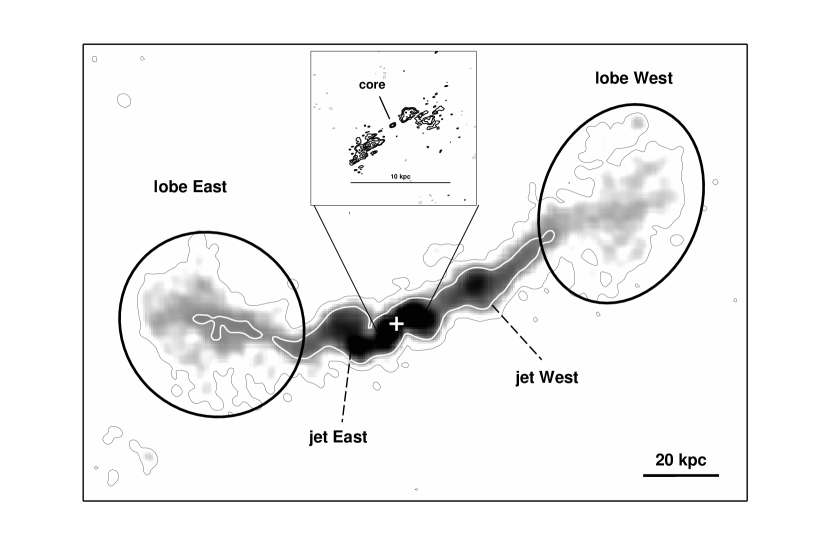
Figure 3 sketches the most prominent components of the source, i.e. the two bright well–collimated jets (labelled as jet West and jet East), extending in opposite directions with respect to the position of the radio core (white cross), and two roughly round and very extended radio lobes (lobe West and lobe East). Since the core of the radio source is undetected in our GMRT images (Figs. 1 and 2), its position has been determined using a 4.9 GHz image at the resolution of 0.7, obtained from a new reduction of archival Very Large Array (VLA) data (Obs. Id. AK360). The 4.9 GHz image is shown as insert in Fig. 3.
The most relevant properties of the source and its components, derived from the observations presented here, are summarised in Table 3, where we provide the flux density at 235, 327 and 610 MHz, the spectral index in the 235–610 MHz frequency range (defined according to S), and the linear size (LS). It is clear from Figs. 2 and 3 and Tab. 3, that both the jets and both the lobes are rather symmetric in total flux density, spectral index and extent. In particular, the western jet has a flux density which is only % higher (depending on the frequency) than the eastern jet, while the lobe West is 3–8 % fainter than the other. The high symmetry observed in 4C +24.36 suggests that the radio source major axis lies close to the plane of the sky.
3.1. The radio jets
The 610 MHz image of 4C +24.36 (Figs. 1 and 3) shows that the radio jets are characterized by a strikingly complex morphology, with a number of wiggles, almost symmetrically placed on either sides within a projected distance of 25 kpc from the core.
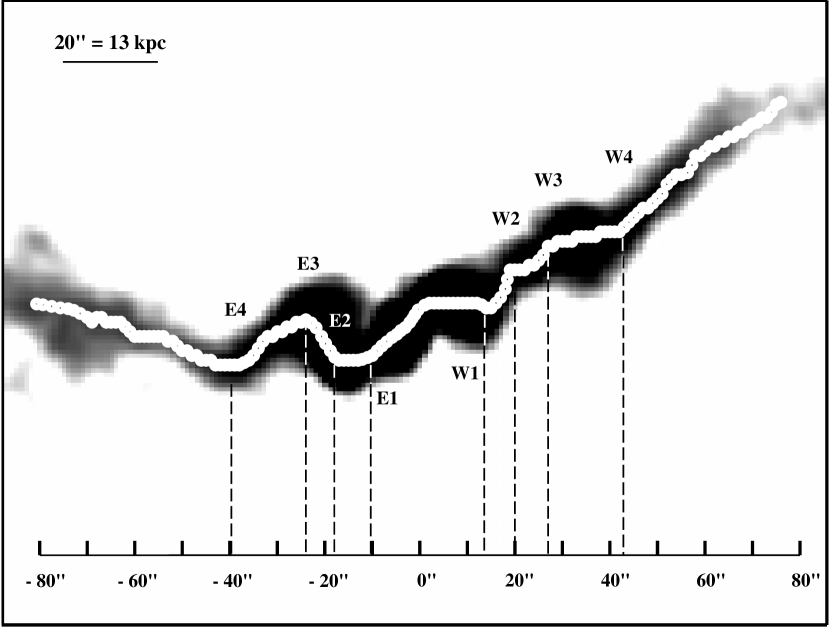
In order to analyze the jet behaviour, we constructed a grid of 1′′ wide strips, parallel to each other and transverse to the source major axis. The strips were set in order to cover the whole jet region on the 610 MHz image (Fig. 1). We determined the position of the surface brightness peak in each stripe, and used it to reconstruct the jet trajectory (projected on the plane of the sky) given in Fig. 4. The figure shows that both jets initially emerge from the core region, bent with a relative angle of 130∘. Going outward they undergo four prominent sharp bends (labelled W1 to W4 for the western jet, and E1 to E4 for the eastern jet), which occur at similar projected distances from the galaxy nucleus. In particular, the first two bends E1 and W1 are observed at 7 kpc from the core, W2 and E2 occur at a distance of 13 kpc, while W3 and E3 take place at 16 kpc. After the last change of direction in W4 and E4 (at 25 kpc from the center), the jets travel roughly straight for a while, and finally flare into the diffuse lobes.
3.2. The radio lobes
Both radio lobes of 4C +24.36 show a regular and roughly round morphology, and lack the presence of hotspots (Fig. 1). The only feature with a significant surface brightness contrast with respect to the rest of the lobe is the shell–like edge visible in the outermost region of the eastern lobe (Fig. 1). The lobes are very symmetric in total flux density, size and spectral index (see Fig. 3 and Tab. 3). They are slightly asymmetric in the projected distance from the core: the centroid of the lobe West is at 65 kpc from the center, while that of the lobe East is at 50 kpc.
4. Radio spectral analysis and physical parameters
The radio observations presented in this paper, coupled with archival and literature data, allowed us to determine the integrated radio spectrum of 4C +24.36, and to produce the image of the spectral index distribution over the source (Sec. 4.1). This information allowed us to derive the physical parameters of 4C +24.36 (Sec. 4.2). The analysis is carried out using the Synage++ package (Murgia 2000).
4.1. Spectral analysis
In order to derive the broad–band radio spectrum of 4C +24.36, we used the databases CATS222http://cats.sao.ru (Verkhodanov et al. 1997) and NED333http://nedwww.ipac.caltech.edu to compile flux densities at different frequencies from the literature, and added our GMRT measurements (Tab. 3). The values from the literature are reported in Tab. 4. The flux densities marked with the symbol in Tab. 4 were corrected for consistency with the absolute flux density scale of Baars et al. (1977) used in this paper and for the other measurements in Tab. 4. The correction factors were taken from Helmboldt et al. (2008). The 74 MHz value was measured on the image from the VLA Low–frequency Sky Survey (VLSS444http://lwa.nrl.navy.milVLSS), and was corrected for the clean bias as described in Cohen et al. (2007). The flux density at 327 MHz was measured on the VLA–C array image of 4C +24.36, obtained from a new reduction of public archival data (Obs.Id. AC598).
The source integrated spectrum between 26 MHz and
10.7 GHz is shown in Fig. 5. The GMRT
data points align well with the data from the literature.
We notice the extremely good agreement of the GMRT 327 MHz
flux density with the measurement from the VLA image at the
same frequency (Tab. 4). The flux density at 26 MHz (empty
square) was derived from observations with the Clarke Lake
Radio Observatory with a resolution of 0.5 deg2
(Viner & Erickson 1975), and thus powerful nearby radio sources
might contribute to the total flux density reported in Tab. 4.
For this reason this value is very uncertain, and will not
be included in the following analysis of the radio spectrum.
The spectrum in Fig. 5 can be described
as a single power–law over the entire range 74 MHz–10.7 GHz,
with a spectral index of =0.82.
The solid line in the figure represents the fit with a
simple power–law model, which provides =0.820.03.
| Flux density | Reference | |
|---|---|---|
| (MHz) | (Jy) | |
| 26 | 26.00 7.00 | (1) |
| 74 | 6.12 0.47 | (2) |
| 178 | 2.77 0.42 | (3) |
| 327 | 2.19 0.11 | (4) |
| 365 | 1.43 0.07 | (5) |
| 408 | 1.76 0.14 | (6) |
| 1400 | 0.68 0.03 | (7) |
| 1400 | 0.67 0.03 | (8) |
| 1410 | 0.60 0.04 | (9) |
| 2700 | 0.33 0.02 | (10) |
| 2700 | 0.37 0.02 | (9) |
| 4860 | 0.19 0.01 | (11) |
| 4850 | 0.21 0.03 | (12) |
| 5000 | 0.20 0.02 | (9) |
| 10700 | 0.11 0.01 | (13) |

| trad | vgrowth | |||
|---|---|---|---|---|
| (MHz) | () yr | (c) | ||
| jet+lobe West(b)(b)footnotemark: | 0.48 | 359 | 1.6 | 0.0017 |
| jet+lobe East (b)(b)footnotemark: | 0.45 | 316 | 1.7 | 0.0015 |
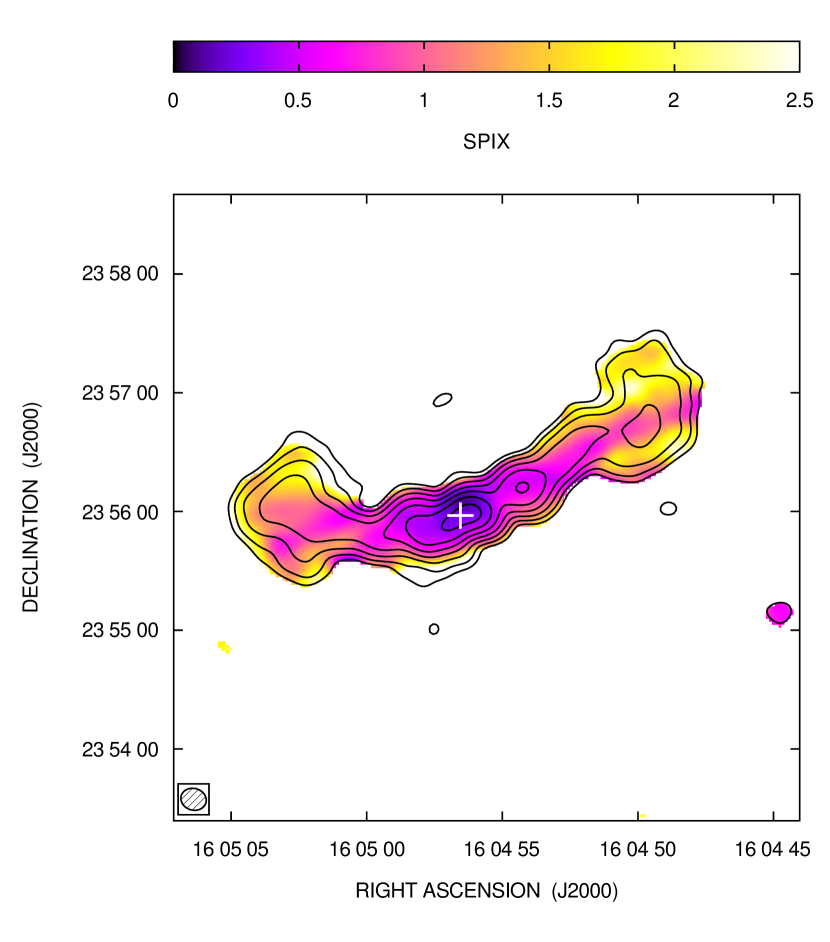
We obtained the image of the 235–610 MHz spectral index distribution over the source using two images produced with the same u–v range and same cellsize, restored with the same beam of , and corrected for the primary beam attenuation. The images were aligned, clipped at the 3 level, and finally combined to obtain the spectral index image presented in Fig. 6. The figure shows the presence of a flat region () at the source center, corresponding to the inner 10 kpc portion of the jets (see Fig. 3). On a larger scale, the spectral index gradually steepens along the jets up to where the jets merge into the lobes. Finally, a further steepening is observed in the lobe region where the spectral index has an average value .
Following Parma et al. (1999 and 2007; see also Giacintucci et al. 2007), we performed a fit of the observed spectral index trend along the source axis. We determined the average spectral index in 7.5′′ radius circular regions starting from the source center and going outwards toward the lobes (see insert in Fig. 7). The size of the region was chosen to be larger than one beam, in order to sample independent regions. The derived 235–610 MHz spectral index distribution as a function of the distance from the core is shown in Fig. 7. We notice that the two spectral trends are very similar once errors are taken into account.
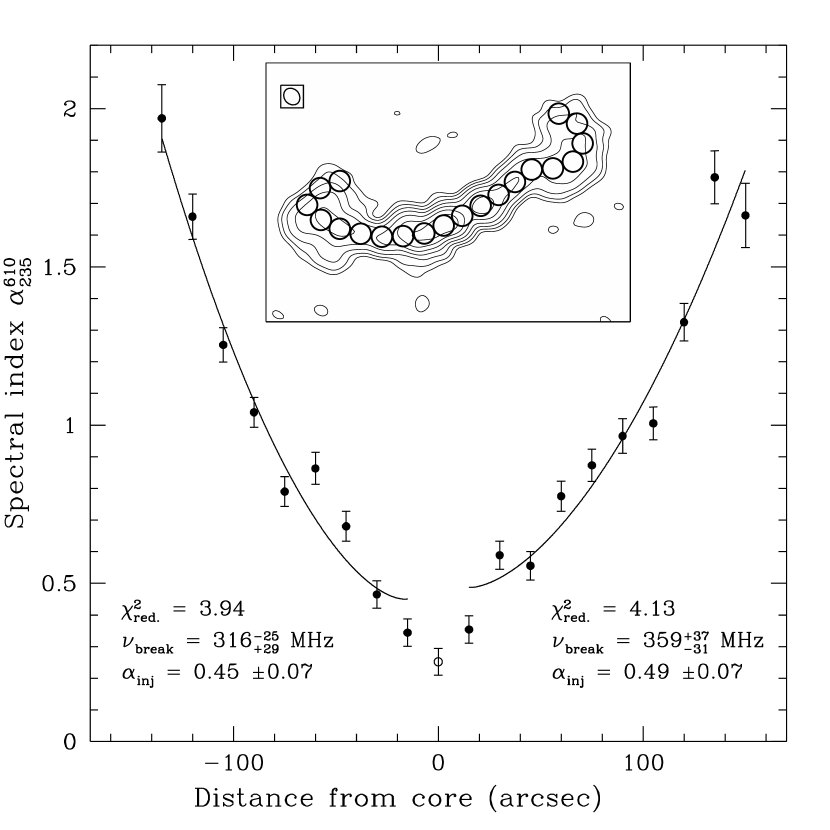
We fitted these trends using a JP model (Jaffe & Perola 1974), in which the timescale for continuous isotropization of the electrons is assumed to be much shorter than the radiative timescale. We also assumed that the break frequency , where is the distance from the core. Such a relation is expected under the assumption that the expansion velocity of the source is constant (i.e. ), and reflects the fact that the age of the radio emitting electrons increases as one moves away from the nucleus, which is appropriate for FR I radio galaxies such as 4C +24.36. The best fit to the observed spectral trend is shown as solid line in Fig. 7. Note that the data point at d0 (empty circle) was not used in the fit. The model yields similar values of the injection spectral index and break frequency for both regions, with and and 320 MHz for the western and eastern parts, respectively (see also Tab. 5).
4.2. Physical parameters of 4C +24.36
We assume that the relativistic particle and magnetic field energy densities are uniformly distributed over the source volume and in energy equipartition. The equipartition parameters are derived adopting a low–energy cut–off of in the energy distribution of the radiating electrons (where is the electron Lorentz factor), instead of the 10 MHz–100 GHz frequency interval normally used in the standard equipartition equations (e.g. Pacholczyk 1970). This choice allows us to take into account the contribution from low energy electrons, since the assumption of a low frequency cut–off of 10 MHz in the synchrotron spectrum tends to neglect the input from electrons with energy lower than 1500–500 for typical equipartition magnetic fields of 1–10 G, respectively (Brunetti, Setti & Comastri 1997). We adopt which corresponds to an energy cut–off of 5 MeV (Brunetti, Setti & Comastri 1997; see also Parma et al. 2007). Furthermore, we use the flux density measurement at 235 MHz (Tab. 2), since the electron aging is less relevant at lower frequencies. A spectral index of 0.5, consistent with the values of the injection spectral index derived in Sec. 4.1 (Tab. 5), is adopted. Finally, we assume a relativistic proton energy to electron energy ratio =1, and a filling factor of unity.
| Beq | Pmin | Umin | umin | |
|---|---|---|---|---|
| (G) | ( dyne cm-2) | (1057 erg) | ( erg cm-3) | |
| total source | 5.00 | 7.8 | 3.7 | 2.3 |
| jet+lobe West | 5.04 | 8.0 | 1.9 | 2.4 |
| jet+lobe East | 4.97 | 7.9 | 1.8 | 2.3 |
| lobe West | 3.14 | 3.1 | 0.9 | 0.9 |
| lobe East | 3.17 | 3.1 | 0.9 | 0.9 |
| jet West | 8.99 | 25.0 | 0.7 | 7.5 |
| jet East | 9.42 | 27.3 | 0.5 | 8.2 |
The equipartition magnetic field Beq computed in this way is listed in Tab. 6 for the entire source, and for parts thereof. We found B G both for the whole source and the western and eastern jet+lobe regions analysed in Sec. 4.1. A lower estimate is obtained for the lobes separately (B G), while the highest values are found in the jets where B G. We also derived the total energy Umin, energy density umin, and minimum pressure pmin for the source and its components (Tab. 6).
The break frequency derived in Sec. 4.1 can be used to estimate the radiative age of 4C +24.36. If the expansion losses can be neglected and the magnetic field is uniform across the source and constant over its lifetime, (expressed in Myrs) is given by the following equation:
| (1) |
where B is the magnetic field intensity in G, is in GHz, and is the magnetic field strength with energy density equal to that of the CMB the redshift z. Adopting the equipartition magnetic fields (Tab. 6) in Eq. 1, we estimate Myr and 170 Myr for the western and eastern parts of 4C +24.36, respectively (also reported in Tab. 5). A growth velocity of c is found for both regions (Tab. 5). The latter quantity was derived as , i.e. assuming a constant velocity and using the largest linear size given in Tab. 2. It is worth noting the good agreement between the results obtained for two regions.
5. Discussion of the radio results
5.1. Jet orientation and velocity
The radio galaxy 4C +24.36 has WAT morphology in all the
images presented in this paper (Figs. 1
and 2), with two bright continuous jets
and very extended radio lobes. Such components are very
symmetric in total flux density and extent (Tab. 2), as
well as in spectral index properties and physical parameters
(Tabs. 5 and 6). These results suggest that the major axis
of 4C +24.36 most probably lies close to the plane of the sky.
We searched for further hints of the source orientation
in the plane of the sky by means of a standard analysis based
on the jet asymmetry. Assuming that the jets are intrinsically
symmetric with respect to the source core, the jet to counterjet
brightness ratio can be used to constrain the geometry and
velocity of the jets in the context of a relativistic beaming
model (e.g. Lind & Blandford 1985) according to
| (2) |
where is the ratio of the jet velocity to the speed of light, is the orientation angle of the jet with respect to the line of sight, and is the jet spectral index. If the jet emissivity is isotropic with no preferred direction for the magnetic field (Pearson & Zensus 1987), the exponent is given by .
Using the 0.7
resolution image at 4.9 GHz (see insert in Fig. 3),
and assuming the jet East to be the counterjet, we estimated
within the inner kpc from the core. Assuming
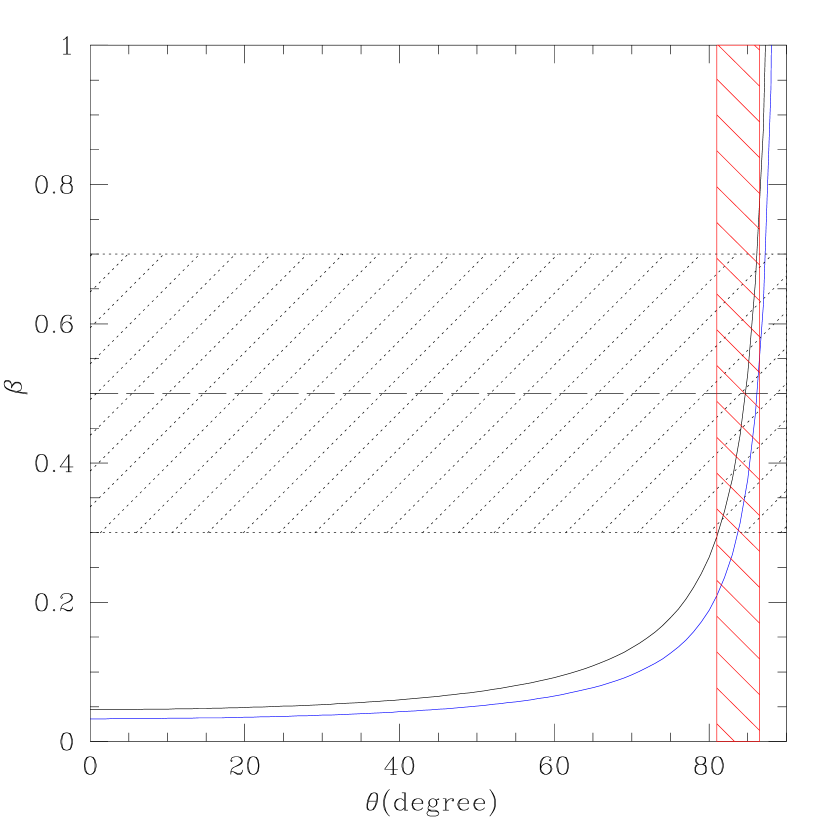
for the jet emission, we found which
yields =0.05 (Eq. 2).
Fig. 8 shows the corresponding constraints
on and the intrinsic jet velocity (solid
black curve). Jetha, Hardcastle & Sakelliou (2006) found that the average value
for the inner jet speed in a relatively large sample of WAT radio
galaxies is . This velocity is in general agreement
with the values found for FRI radio galaxies, whose properties are
consistent with the hypothesis that jets slow down from relativistic
to sub–relativistic velocities on scales of 1–10 kpc (Parma et al.
1994). Adopting for 4C +24.36, the black solid
curve in Fig. 8 shows that the allowed jet orientation
angle is in the range –
(red dashed region). This suggests that the source probably lies
at a very small angle with respect to the plane of the sky.
If we use the exponent in Eq. 2, which
is valid in the case of a perfectly ordered magnetic field
parallel to the jet axis (Begelman 1993), we obtain very similar
constraints for the jet orientation, as shown by the solid blue
curve in Fig. 8. In this case –.
5.2. Morphological distortions
The radio structure of 4C +24.36 is characterised by clear distortions occurring over different linear scales. One of most prominent features is the number of sharp wiggles which the jets undergo within the central kpc (projected) from the core (Fig. 4). On the large scale, the overall structure of the source appears slightly bent toward the North in a C–shape which is typical of WAT sources (Fig. 1 and Fig. 2). This suggests that different physical processes may play a role in the origin of the morphological distortions observed on the different scales.
5.2.1 Jet wiggles
Jet oscillations have been observed in other FRI radio sources of similar luminosity as 4C +24.36, e.g. the well studied radio galaxies 3C 31 (e.g., Blandford & Icke 1978; Andernach et al. 1992; Laing & Bridle 2002) and 3C 449 (e.g., Andernach et al. 1992; Feretti et al. 1999). Both sources are characterized by a very large total extent (LLS 800 kpc and 600 kpc, respectively) which places them among the class of giant radio galaxies. They are associated with the dominant members of two nearby poor groups of galaxies (z=0.17), and both galaxies are likely undergoing a gravitational encounter with a close bright companion.
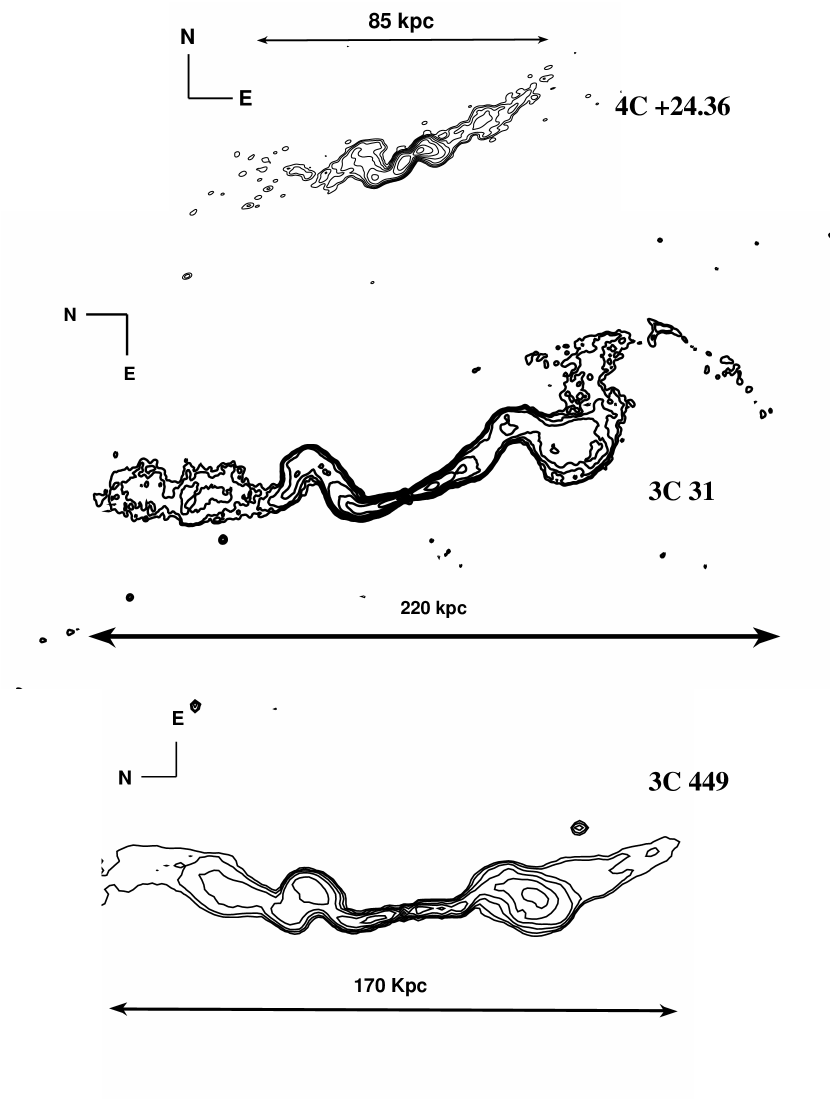
In Fig. 9 we compare the radio morphology
of 4C +24.36 (upper panel) to the structure of
the well-known radiogalaxies 3C 31
and 3C 449 (central and lower panels, respectively).
All images were obtained from a new reduction of 1.4 GHz
observations from the VLA public archive, and have a resolution
of (see Figure caption for details).
Note that the images of 3C 31 and 3C 449 have been rotated
and reversed in order to highlight the morphological
similarities. We also point out that the image of 3C 449
shows only the central region of the source, whose total
extent at this resolution is (i.e.
420 kpc; see Feretti et al. 1999). Despite the different
linear size, the similarity of the pattern of wiggles in
the three sources is striking. However we can notice some
important differences: i) the wiggles in 4C +24.36
occur over a smaller projected distance from the nucleus
(i.e. between 7 kpc and 25 kpc; see Fig. 4)
than in 3C 31 and 3C 449, where the first bend is observed
at kpc; ii) the inner jets in 4C +24.36
show a much stronger deviation from linearity than 3C 31
and 3C 449. In particular, the western jet appears
already bent at 3 kpc only from the core (see insert
in Fig. 3).
Jet oscillations can be ascribed to various reasons, which
include a) orbital motion, b) precession
of the nuclear collimator, and c) jet instabilities,
such as Kelvin-Helmholtz (K–H) instabilities, at
the jet boundary.
-
a)
The orbital motion is expected to generate a single oscillation wavelength with fixed amplitude and mirror symmetry of the jet with respect to the core. Given the presence of a close bright companion, it has been suggested that the orbital motion might indeed be responsible for the jet wiggles in 3C 31 (Blandford & Icke 1978) and 3C 449 (Perley, Willis & Scott 1979). However no bright companion is visible on the available optical images of 4C +24.36 (e.g. Fig. 1), thus it seems difficult to ascribe the jet oscillations to the presence of an orbiting system. Furthermore, with plausible galaxy masses and the orbital separation required to produce the observed lateral displacement of the jets, the orbital period would be far larger than the jet age allows.
-
b)
Precessional motion is expected to lead to a single oscillation wavelength with amplitude linearly growing with the distance from the nucleus and anti–symmetric pattern. Given the approximate mirror symmetry of the initial jet oscillations in 4C +24.36, we can reasonably rule out the precessional model.
-
c)
Confined radio jets are known to be unstable against K–H instabilities at their boundary (Hardee 1987). The jet oscillations can be then interpreted as the result of helical motion arising from small perturbations at the jet origin, amplified by growing K–H instabilities (Hardee 2003; Savolainen et al. 2006). These instabilities can be triggered for example by random perturbations of the jet flow (e.g., by jet–cloud interactions; Gómez et al. 2000), or by variation in the jet injection direction from the nucleus (e.g., due to the orbital motion of a supermassive binary black hole in the host galaxy). It has been shown that the K–H helical distortion waves propagating along the jet are able to displace the whole jet and produce large scale helical structures (Hardee 1987). Thus K–H instabilities are an appealing possibility to interpret the wiggles observed in 4C +24.36. Unfortunately the resolution of our present radio data is not high enough to allow us to determine the characteristics of a possible K–H wave propagating along the jet.
Further information on the fine brightness structure and polarization properties of the jets from higher resolution radio observations would be required to shed light on the possible mechanisms responsible for the oscillations. Moreover, forthcoming high resolution X–ray Chandra observations (Cycle 9) will allow us to carry out a detailed structural comparison of the radio and X–ray emission in the jet regions.
5.2.2 Large scale bending
The investigation of the physical mechanism responsible for the
wide–angle tail formation poses a number of interesting problems
which are not completely understood yet. The earliest models developed
for the origin of WATs invoked ram pressure resulting
from the motion of
the associated galaxy through the surrounding intracluster medium
(e.g., Owen & Rudnick 1976; Begelman, Rees & Blandford 1979).
However, WATs are usually associated with the central dominant galaxies
in groups and clusters, and they are not expected to have large velocities
relative to the ICM (Burns 1981), as they usually reside at the center
of the cluster gravitational potential well (Merritt 1984; Bird 1994).
Thus, ram pressure alone seems unable to explain the bends observed
in most of the WATs (e.g., Eilek et al. 1984; O’Donoghue, Eilek & Owen
1993).
One possibility is that if the radio jets are less dense than the
external gas, buoyancy forces might contribute to the bending of the tails,
as they drag the radio plasma towards lower density regions in the ICM
(e.g., Burns & Balonek 1982). In real situations, both ram pressure by
the galaxy motion and buoyancy are expected to play a role, with buoyancy
forces dominant at larger radii (Sakelliou et al. 1996). An alternative
scenario is that the large scale bulk motions in the ICM, resulting from
cluster mergers, may provide the necessary ram pressure to distort the
structure of the central dominant radio galaxy (e.g., Pinkney, Burns
& Hill 1994; Gómez et al. 1997). Large scale X–ray substructure
and merging signatures have been indeed observed in many clusters hosting a
WAT (Burns et al. 1994). Finally, an appealing possibility to explain
the existence of WATs at the center of non–merging clusters is the possible
connection of the radio source bending with the process of gas sloshing in
the cluster core thought to be responsible for the formation of cold fronts
(Ascasibar & Markevitch 2006). For example, such a connection might be
present in A 2029, a very relaxed cluster hosting a WAT and a pair of cold
fronts at its center (Clarke, Blanton & Sarazin 2004; Ascasibar &
Markevitch 2006 ).
The optical and X–ray properties of AWM 4 (Koranyi & Geller 2002 and
OS05, respectively) indicate that the cluster has not
recently experienced major episodes of merging (see also Sec. 6.1).
Moreover, the XMM–Newton images do not show any sharp surface brightness
edges suggestive of the existence of cold fronts in the core (OS05). For
these reasons we interpret the bending in 4C +24.36 as a result of the
interplay of ram pressure (driven by the motion of NGC 6051) and buoyancy
forces. Following Sakelliou et al. (1996), we can derive a constraint on
the galaxy velocity relative to the ICM, as a function of the ratio of the
jet density to the ICM density, at the point where the components of ram
pressure and buoyancy in the direction orthogonal to the jet balance
each other (the turnover point). At smaller distances than this point, the jet
bending is expected to be mostly determined by ram pressure, while
buoyancy forces dominate at larger distances. Furthermore, the bending
does not depend on the jet velocity at the turnover point (Sakelliou et
al. 1996).
We assume that the radio jets can be described as a steady
flow of a non–relativistic plasma (Bridle & Perley 1984), and adopt
a coordinate system in which the axes always lie parallel and perpendicular
to the jet. At the turnover point the component of the galaxy
velocity in the plane of the sky () can be expressed as
(see Sakelliou et al. 1996, and Smolčić et al. 2007 for details),
| (3) |
where is the normal vector to the jet in the plane of the sky, is the unity vector in the direction of the galaxy velocity, is the unity vector in the direction from the cluster center, and are the slope and core radius of the X–ray surface brightness when fit to a hydrostatic model, kT is the ICM temperature, is the projected distance of the turnover point from the cluster center, h is the width of the jet at this point (corrected for the resolution of the telescope), is the mean molecular weight (=0.6), is the proton mass, and are the density of the jet and ICM.
A close examination of Figs. 1 and 4
suggests that the last change in direction of the jets (points E4 and W4)
might be identified as the turnover point for 4C +24.36.
In this case kpc. The average gas temperature
in AWM 4 is kT=2.5 keV (Tab. 1), and the fit of the radial profile
of the cluster X–ray surface brightness with a single model
provides kpc and (OS05). Thus, if kpc,
as estimated from Fig. 1, then from Eq. 3
we can derive the galaxy velocity as a function of (Fig. 10). In the limit , we obtain an upper limit for the NGC 6051
velocity relative to the ICM of km s-1.
We stress that is the velocity component in the plane
of the sky, therefore the derived value is a lower limit on the
total speed of NGC 6051. On the other hand, the comparison of the NGC 6051
redshift to the average redshift of the other cluster members provides
an estimate of the line of sight component of its velocity. Koranyi &
Geller (2002) report a recession velocity of 970346 km s-1
for NGC 6051, and an average velocity for the cluster members within
a radius of 0.5 Mpc of 972298 km s-1.
Thus NGC 6051 seems to be relatively at rest with respect to the
potential well of AWM 4. This is consistent with the fact that the
galaxy position is coincident with the peak of the cluster X-‐ray
emission (Koranyi & Geller 2002; OS05), and is also in agreement
with the velocities usually found for the dominant galaxies in
non–merging groups and poor clusters of galaxies (e.g., Beers et
al. 1995).

5.3. Source age
Our spectral analysis led us to an estimate of the synchrotron age
of 4C +24.36 of Myr (Tab. 5). This age is
significantly higher than the typical values derived
(using a similar approach to the one adopted in Sec. 4.2)
for currently active radio galaxies of similar luminosity, as for
example the sources in the B2 sample which have a median age of 16
Myr (Parma et al. 1999, 2007). The age of 4C +24.36 is indeed more
similar to the values derived by Parma et al. (2007) for a sample of
candidate dying radio galaxies, which have a median age of 63 Myr,
with values up to 170 Myr.
Giacintucci et al. (2007) have recently analysed a sample
of cD radio galaxies in rich and poor clusters of galaxies,
and found radiative ages years for 4 of the 7 sources
with available estimates of the age. They argued that one of them
(A 2372) is a restarted radio galaxy, where both the new activity
and the relic radio plasma from the previous AGN burst are
visible. Another two sources (A 2622 and MKW 3s) are most likely dying
radio galaxies, where the nuclear engine has switched off and a relic
phase is currently ongoing. However, the total spectral index of
4C +24.36 ( in the 74 MHz–10.7 GHz range) is
typical of a currently active radio galaxy rather than a relic source,
where can be much steeper (2; e.g. Parma et al. 2007;
Giacintucci et al. 2007). Furthermore, 4C +24.36 clearly shows active
nuclear emission at high frequencies
(see insert in Fig. 1).
Thus it seems rather unlikely that we are dealing with a dying radio
galaxy.
We would like to point out here that the estimate of the radiative age in Tab. 5 is based on the assumption that the energy losses due to the source expansion can be neglected, and that the spectral steepening is due to electron aging in a magnetic field which is constant and uniform across the source. The role of a decreasing magnetic field along the source structure has been considered in alternative models for classical double radio galaxies (e.g., Blundell & Rawlings 2000, and references therein), where the magnetic field decrease is reflected in a steepening of the spectral index, with no direct implication for the source aging.
A detailed calculation of the evolution of the electron energy spectrum under the combined effect of radiative losses and adiabatic expansion is difficult, and it is beyond the purpose of the present work. However, we can derive a crude estimate of the effects of possible expansion losses in 4C +24.36 by considering that the cross section of the radio plasma increases by a factor of 2 in the transition from the jets to the lobes (Fig. 1; Tab. 3). If we further consider that the Inverse Compton losses are as important as synchrotron losses ( G; Tab. 5), we may expect that the break energy could be lower by an extra factor of 0.6 due to the expansion of the source. Moreover, because of the conservation of the magnetic field flux, we would expect a decrease of the magnetic field strength by a factor of 0.25. The combination of these effects would lead to a break frequency which is about one order of magnitude lower with respect to the case in which there is no expansion of the source. As a result, given that (Eq. 1), the age of the source would artificially appear a factor of 3 higher than its real value. This implies that in the case of 4C +24.36, the real age would be of the order of 50 Myr. Thus the age reported in Tab. 5 should be considered an upper limit to the real age of the source, and consequently the computed velocity growth as a lower limit.
6. Gas heating at the core of AWM 4?
The XMM–Newton observation of the core of AWM 4 (Obs. ID. 0093060401; OS05) reveals that the ICM is isothermal at about 2.5 keV out to at least 160 kpc from the center, even though the cooling time in the middle is about 2 Gyr. In such systems, to account for the absence of the establishment of a cool core, many possible heating mechanisms have been proposed, including gravitational heating due to orbital motion and dynamical friction (e.g., Dekel & Birnboim 2008), galaxy and sub-cluster mergers (e.g., Gómez et al. 2002), supernovae (e.g., Efstathiou 2000), turbulent mixing in the ICM (e.g., Kim & Narayan 2003a), thermal conduction from the outer parts of the cluster (e.g., Kim & Narayan 2003b), and conduction of energy from cosmic rays (e.g., Guo & Oh 2008). However, the most promising energy injection models invoke the presence of a central AGN, and various modes of transport of the output energy from the supermassive black hole to the ICM have been considered (e.g., Binney & Tabor 1995; Roychowdhury et al. 2004; Mathews et al. 2004; Nusser et al. 2006; Jetha et al. 2008). Here we conclude the detailed study of the remarkable radio galaxy 4C +24.36, in the core of the relaxed yet isothermal cluster AWM 4, by assessing the role of the AGN in the prevention of the establishment of a cool core in this system.
6.1. 4C +24.36 and the cluster environment
The overall optical properties of AWM 4 have been investigated by
Koranyi & Geller (2002). It is a relatively poor cluster containing
about 30 members centered on NGC 6051, within a projected radius of
Mpc, with a velocity dispersion of
km s-1 (Tab. 1). Morphological segregation is clearly evident
within the cluster galaxy population, with the early–type galaxies more
concentrated toward the core region (i.e., around NGC 6051) than the
late–type galaxies. No substructure has been detected in the projected
galaxy distribution and/or in the velocity space, suggesting that AWM 4
is a relatively relaxed cluster, which has not recently experienced major
mergers or infall of substantial subclusters.
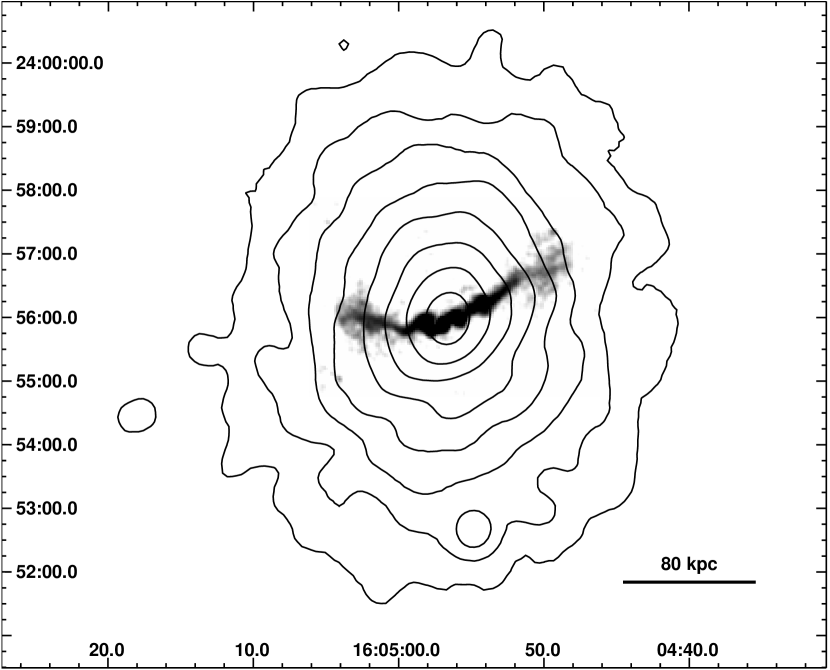
The relaxed nature of this system is further supported by the
analysis of the XMM–Newton observations of the cluster by OS05
(see also the recent study by Gastaldello et al. 2008). In
Fig. 11, we show the XMM–Newton image of AWM 4
(contours, adaptively smoothed from a combination of the MOS and PN
data), on which the GMRT 610 MHz image of 4C +24.36 (grey scale) has
been superposed. The cluster X–ray surface brightness shows a very
regular and relaxed appearance free of any visible substructures,
with a steep increase of the brightness toward the center. The radio
source extends over the whole core region of the cluster (core radius
kpc as provided by the fit of the X–ray surface brightness
to a single hydrostatic model; OS05). No significant feature
in the hot gas distribution seems associated with the region filled by
the radio emission or surrounding it. In particular, at the location
of the radio lobes, we do not observe any depression in the X–ray
surface brightness, which might indicate the presence of cavities in
the ICM, evacuated by the radio galaxy, as is often observed in many
relaxed clusters and groups of galaxies (see for instance the reviews
by Blanton 2004, McNamara & Nulsen 2007, and references therein).
6.2. Pressure balance

Fig. 12 shows the profile of the thermal gas pressure () as a function of the distance from the cluster center, inferred from the best fitting X–ray temperature and density models as part of the mass analysis described in OS05. In this plot, we also show the minimum pressure of the radio jets and lobes of 4C +24.36 (dashed lines), estimated assuming equipartition arguments (Sec. 4.2; Tab. 6). From Fig. 12 it is clear that the jet minimum pressure is comparable to over most of the jet length. On the contrary, the radio lobes appear underpressured with respect to the external medium by a factor ranging from 3 to 5. We point out that the assumption of standard equipartition equations, i.e., without the low–energy cut–off of in the electron energy distribution (Sec. 4.2), would lead to a higher pressure imbalance in the lobe regions of the order of . We also notice that projection effects are not expected to play a significant role in the comparison in Fig. 12, as the source is approximately in the plane of the sky (Sec. 5.1).
A similar lack of pressure balance has been found in the large scale components of other FRI radio sources, where, based on standard equipartition arguments, the ratio is usually , with values up to 100 (e.g., Feretti, Perola & Fanti 1992). This suggests a departure from the minimum energy condition within the radio lobes. In particular,
-
i)
the lobes could be far from equipartition, with a higher relativistic particle or magnetic field energy density.
-
ii)
Assuming that equipartition still holds, the lobes may contain an energetically dominant population of non–radiating relativistic particles (protons) which contribute to the internal pressure. The minimum pressure is a weak function of the energy ratio between relativistic protons and electrons, i.e., P. The values of Pmin in Tab. 6 were estimated assuming . Thus, in order to achieve pressure balance in the lobe regions of 4C +24.36, we should require a contribution of relativistic protons such as 6–22, which is in agreement with the estimates for other radio sources of similar luminosity (e.g. Feretti, Perola & Fanti 1992).
-
iii)
The balance could also be achieved (in the equipartition hypothesis) assuming that the plasma has a filling factor – (according to P), instead of unity. Filamentary structures have been detected in high resolution radio images of a number of radio sources which may indeed indicate filling factors smaller than 1 (e.g., Fornax A; Fomalont et al. 1989; M87, Hines, Owen & Eilek 1989).
-
iv)
An additional pressure component might be provided by the presence of thermal plasma within the lobes. The jets could accrete material as they move through the external medium (e.g., Bicknell 1994) and transport it into the lobes. This would be in line with the fact that the pressure imbalance increases with the distance from the nucleus (Fig. 12).
6.3. Energy output from 4C +24.36
The analysis of the XMM-Newton observations in OS05 revealed that AWM 4 occupies an unusual place among groups and clusters (see also Gastaldello et al. 2008). The combination of the regular X–ray emission and monotonic increase of brightness toward the center would usually suggest a relaxed cluster with a well–established cool core. Such an expectation would be further supported by the abundance profile which shows a clear metallicity decline going from the cluster center to larger radii (OS05; Gastaldello et al. 2008). However, the X–ray spectral fitting reveals that AWM 4 does not possess a cool core. The azimuthally averaged temperature profile is approximately constant out to a distance of at least 160 kpc from the center, without any sign of the substantial temperature drop in the center expected in an ordinary cool core cluster (OS05; Gastaldello et al. 2008).
Given the absence of any significant signature of a recent merger event which may have disrupted the cool core in AWM 4 (Sec. 6.1), OS05 suggested that the AGN in the central galaxy NGC 6051 has been active for enough time to (re–)heat the surrounding gas in the core. Assuming that a cool core existed in the cluster before the re–heating process, OS05 estimated that the total energy required to produce the observed isothermal profile is erg.
Using a spectral index (consistent with the injection spectral index provided by the spectral fit; Tab. 5), we calculate the total radio luminosity of 4C +24.36 over the frequency range 10 MHz–100 GHz to be L erg s-1. In Sec. 4.2 we estimate a synchrotron lifetime of the radiating electrons in the source of 160 Myr (Tab. 5). This value implies that the energy deposited in the ICM by the source over its lifetime is E erg. Thus the radio source seems to be at least a factor of 30 too underluminous to balance the cooling in this system. Indeed, in the sample of clusters studied by Bîrzan et al. (2004, see also McNamara et al. 2007), the median ratio of the jet power to the synchrotron power is , the mean value being dominated by a few extreme cases. In the case of AWM4, we should point out that this ratio could be much higher than 30, if we consider that the age of the source might be up to 3 times less than the value of 160 Myr quoted above, as we have discussed in Sec. 5.3.
On the other hand, the total energy output of a radio source can be considerably higher than what estimated from its synchrotron luminosity, since the total radio power is thought to be dominated by the mechanical work done by the jets on the ICM during the source expansion (e.g. Scheuer 1974). One mode of doing so is by inflating bubbles filled with a relativistic fluid in the ICM, which would expand and rise, imparting energy to the ICM (Churazov et al. 2002, Nulsen et al. 2003, Nusser et al. 2006, McNamara & Nulsen 2007). This is supported by the direct detection of significant cavities in the X–ray surface brightness of several clusters, which might represent these rising bubbles (Fabian et al. 2000, Bîrzan et al. 2004 & 2006, Allen et al. 2006, Gitti, Feretti & Schindler 2006, Jetha et al. 2008).
The enthalpy H of a rising adiabatic bubble is the sum of the work done to displace the X–ray emitting gas, and its thermal energy, and is given by , where is the pressure of the surrounding ICM, the volume of the bubble and the ratio of specific heats of the gas. For an ideal relativistic gas, , and . In case of a non-relativistic plasma filling the bubble, and also in the presence of significant magnetic fields in the lobes, the value of enthalpy could be a factor of 2 lower. Churazov et al. (2002) argue that almost all of this enthalpy can be transferred as thermal energy to the ICM.
To assemble the equivalent of erg of mechanical energy, which is needed to produce the isothermal profile in the core of AWM 4, as estimated by OS05, with the lobe pressure being dyne cm-2 (see Table 6), would require the entire enthalpy () of a spherical bubble of radius of over 80 kpc. Inflating this bubble against a pressure as high as jet pressure, which is an order of magnitude higher, would require a bubble of half this size, whereas a value of enthalpy that is lower than would only require a larger bubble. Such an extensive displacement of plasma in the ICM would be easily apparent in the XMM–Newton observation of AWM 4, where no such features are seen within the inner 200 kpc, in the gas associated with the radio lobes of 4C +24.36. Even if the heating is due to an abundance of buoyant bubbles, the larger ones should have been evident in the deep X–ray image. A forthcoming deep X–ray observation (80 ks) at higher angular resolution, to be obtained by Chandra during Cycle 9, will possibly yield a better insight into the presence or absence of cavities in this system.
7. Summary and Conclusions
In this paper we presented a detailed morphological and spectral analysis, at radio wavelengths, of the WAT radio galaxy 4C +24.36, located at the core of the poor galaxy cluster AWM 4, based on new high sensitivity observations at 235 MHz, 327 MHz and 610 MHz, using the GMRT, and literature and archival data at other frequencies.
The large scale source structure appears bent in a very similar WAT morphology at all frequencies, and all resolutions afforded by our GMRT images. We interpret this bending to be the result of the interplay of ram pressure (driven by the motion of the host galaxy NGC 6051) and buoyancy forces. In the framework of this model, we estimate that the velocity of the galaxy NGC 6051, with respect to the cluster, is 120 km s-1, in the plane of the sky. Combined with the upper limit on the radial velocity of NGC 6051, which is 20 km s-1 with respect to the mean radial velocity, out to Mpc, of the cluster AWM4 (Koranyi & Geller 2002), our result indicates that the galaxy is expected to be relatively at rest in the potential well of the cluster.
On the small scale, the radio jets show prominent symmetric oscillations within the central 25 kpc from the core. An appealing possibility to explain these features is the development of Kelvin–Helmholtz helical instabilities propagating along the jets. However the resolution of our images is not high enough to investigate the fine structure of the jets, and to determine the characteristics of a possible distortion wave. Deep radio observations at higher resolution, combined with polarisation information, are necessary to carry out a more detailed analysis of the jet regions.
Combining the new GMRT observations, with data from the literature at various other frequencies (see Tab. 4), we derived the broadband radio spectrum of 4C +24.36, and found that it is well fitted by a power–law with between 74 MHz and 10.7 GHz. From the GMRT images at 235 and 610 MHz, evaluating the spectral index distribution at discrete intervals along each jet, we showed (Fig. 7) how the spectral index gradually steepens along the jet to about where the jets merge into the lobes, and further steadily steepens within the lobes to .
Assuming equipartition of energy between the relativistic particles and the ambient magnetic field, and adopting a lower energy cutoff equivalent to the minimum Lorentz factor of the radiating electrons (=10, MeV), we find that the equipartition value of the magnetic field varies between 3 to 9 G from the lobes to the jets. The radiative age for 4C +24.36 was found to be around 160 Myr from this estimate.
We used the jet to counterjet brightness ratio to constrain the geometry and velocity of the jet. Assuming a typical value for the inner jet velocity in WAT radio galaxies, we found that the source is likely oriented at a large angle ( 81∘–88∘) with respect to the line of sight. This result is consistent with the high level of symmetry found in the total flux density, extent, spectral index properties and physical parameters of the lobes and jets.
Even though the host cluster AWM04 has a hot X–ray emitting ICM of relaxed morphology and uniform temperature profile out to at least 160 kpc from the center, its cooling time in the core is about 2 Gyr, indicating the presence of significant sources of energy injection that prevents the catastrophic cooling expected in the core of the cluster. Based on the above values of the jet power and the estimated radiative age, the total energy output from the radio source falls short by almost two orders of magnitude of the energy required for the isothermal temperature profile obtained from the XMM–Newton observation of the cluster. The latter observation enables us to measure the pressure of the hot gas as a function of radius within the cluster, which is found to be comparable to the pressure in the jets over most of their lengths, but higher than the pressure in the lobes by a factor 5. Several interpretations of this pressure imbalance are discussed. Finally, it is found that for any reasonable value of gas pressure in the range between the value in the lobes and that in the jets, if the central source were to transfer mechanical energy to the ICM, in terms of the enthalpy of buoyant bubbles of relativistic fluid, it would require bubbles of tens of kpc in radius, which would have been detected in the existing XMM-Newton observations of O’Sullivan et al. (2005). We look forward to a forthcoming deeper Chandra observation of this system for further insight into morphological evidence of this energy transfer.
References
- Allen et al. (2006) Allen, S. W., Dunn, R. J. H., Fabian, A. C., Taylor, G. B., & Reynolds, C. S. 2006, MNRAS, 372, 21
- Andernach et al. (1992) Andernach H., Feretti L., Giovannini G., Klein U., Rossetti E., Schnaubelt J., 1992, A&AS, 93, 331
- Ascasibar & Markevitch (2006) Ascasibar Y., & Markevitch M., 2006, ApJ, 650, 102
- Baars et al. (1977) Baars J.W.M., Genzel R., Pauliny–Toth I.I.K., Witzel A., 1977, A&A, 61, 99
- Becker et al. (1995) Becker R.H., White R. L. & Helfand D.J., 1995, ApJ 450, 559
- Beers et al. (1995) Beers T.C., Kriessler J.R., Bird C.M., Huchra J.P., 1995, AJ, 109, 874
- Begelman (1993) Begelman M.C, 1993, in Jets in Extragalactic Radio Sources, ed. H.–J. Roeser & K. Meisenheimer (Berlin:Springer), p. 145
- Begelman, Rees & Blandford (1979) Begelman M.C., Rees M.J., & Blandford R.D., 1979, Nature, 279, 770
- Bicknell (1994) Bicknell G.V., 1994, ASPC, 54, 357
- Binney & Tabor (1995) Binney, J., & Tabor, G. 1995, MNRAS, 276, 663
- Bird (1994) Bird C.M., 1994, AJ, 107, 1637
- Bîrzan et al. (2004) Bîrzan L., Rafferty D.A., McNamara B.R., Wise M.W., Nulsen P.E.J., 2004, ApJ, 607, 800
- Bîrzan et al. (2006) Bîrzan L., McNamara B.R., Carilli C.L., Nulsen P.E.J., Wise M.W., 2006, in Heating vs. Cooling in Galaxies and Clusters of Galaxies, Eds. H.Böhringer, P.Schuecker, G.W. Pratt & A. Finoguenov (ESO Astrophysics Symposia), (arXiv:astro-ph/0612393)
- Blandford & Icke (1978) Blandford R.D., & Icke V., 1978, MNRAS, 185, 527
- Blanton (2004) Blanton E.L., 2004, Proceedings of The Riddle of Cooling Flows in Galaxies and Clusters of Galaxies, eds. T. Reiprich, J. Kempner & N. Soker, p. 181
- Blundell & Rawlings (2000) Blundell K.M., & Rawlings S., 2000, AJ, 119, 1111
- Bridle, Kesteven & Brandie (1977) Bridle A.H., Kesteven M.J.L. & Brandie G.W., 1977, AJ, 82
- Bridle & Perley (1984) Bridle A.H.,& Perley R.A., 1984, ARA&A, 22, 319
- Brunetti, Setti & Comastri (1997) Brunetti, G., Setti, G., Comastri, A., 1997, A&A 325, 898
- Burns (1981) Burns J.O., 1981, MNRAS, 195, 523
- Burns & Balonek (1982) Burns J.O., & Balonek T.J., 1982, ApJ, 263, 546
- Burns et al. (1994) Burns J.O., Rhee G., Owen F.N., Pinkney J., 1994, ApJ, 423, 94
- Churazov et al. (2002) Churazov, E., Sunyaev, R., Forman, W., Böhringer, H. 2002, MNRAS, 332, 729
- Clarke, Blanton & Sarazin (2004) Clarke T.E., Blanton E.L., & Sarazin C.L., 2004, ApJ, 616, 178
- Cohen et al. (2007) Cohen A.S., Lane W.M., Cotton W.D., Kassim N.E., Lazio T.J.W., Perley R.A., Condon J.J., Erickson W.C., 2007, AJ, 134, 1245
- Colla et al. (1970) Colla G., Fanti C., Ficarra A., et al., 1970, A&AS, 1, 281
- Condon et al. (1998) Condon J.J., Cotton W.D., Greisen E.W., Yin Q.F., Perley R.A., Taylor G.B., Broderick J.J., 1998, AJ, 115, 1693
- Cowie & Binney (1977) Cowie L.L., & Binney J., 1977, ApJ, 215, 723
- Dekel & Birnboim (2008) Dekel, A., & Birnboim, Y. 2008, MNRAS, 383, 119
- Douglas et al. (1996) Douglas J.N., Bash F.N., Bozyan F.A., et al., 1996, AJ, 111, 1945
- Edge, Stewart & Fabian (1992) Edge, A. C., Stewart, G. C., & Fabian, A. C. 1992, MNRAS, 258, 177
- Efstathiou (2000) Efstathiou, G. 2000, MNRAS, 317, 697
- Eilek et al. (1984) Eilek J.A., Burns J.O., O‘Dea C.P., Owen F.N., 1984, ApJ, 278, 37
- Fabian & Nulsen (1977) Fabian A.C. & Nulsen P.E.J., 1977, MNRAS, 180, 479
- Fabian (1994) Fabian A.C., 1994, ARA&A, 32, 277
- Fabian et al. (2000) Fabian, A. C., et al. 2000, MNRAS, 318, L65
- Fanti et al. (1974) Fanti C., Fanti R., Ficarra A., Padrielli L., 1974, A&AS, 18, 147
- Feretti et al. (1992) Feretti L., Perola G.C., & Fanti R., 1992, A&A, 265, 9
- Feretti et al. (1999) Feretti L., Perley R., Giovannini G., Andernach H., 1999, A&A, 341, 29
- Fomalont at al. (1989) Fomalont E.B., Ebneter K.A., van Breugel W.J.M., Ekers R.D., 1989, ApJ, 346, 17
- Gastaldello et al. (2008) Gastaldello F., Buote D.A., Brighenti F., Mathews W.G., 2008, ApJ, 673L, 17
- Giacintucci et al. (2007) Giacintucci S., Venturi T., Murgia M., Athreya R., Bardelli S., Dallacasa D., Mazzotta M., Saikia D.J., 2007, A&A, 476, 99
- Gitti, Feretti & Schindler (2006) Gitti, M., Feretti, L., & Schindler, S. 2006, A&A, 448, 853
- Gómez et al. (1997) Gómez P.L., Pinkney J., Burns J.O., Wang Q., Owen F.N., Voges W., 1997, ApJ, 474, 580
- Gómez et al. (2000) Gómez J.–L., Marscher A.P., Alberdi A., Jorstad S.G., Garcia–Miró C., 2000, Science, 289, 2317
- Gómez et al. (2002) Gómez, P. L., Loken, C., Roettiger, K., & Burns, J. O. 2002, ApJ, 569, 122
- Gower, Scott & Wills (1967) Gower J.F.R., Scott P.F. & Wills D., 1967, MmRAS, 71, 49
- Gregory & Condon (1991) Gregory P.C. & Condon J.J., 1991, ApJS, 75, 1011
- Gregory et al. (1996) Gregory P.C., Scott W.K., Douglas K., Condon J.J., 1996, ApJS, 103, 427
- Guo & Oh (2008) Guo, F., & Oh, S. P., 2008, MNRAS, 384, 251
- Hardee (1987) Hardee P.E., 1987, ApJ, 313, 607
- Hardee (2003) Hardee P.E., 2003, ApJ, 597, 798
- Helmboldt et al. (2008) Helmboldt J.F., Kassim N.E., Cohen A.S., et al., ApJS, 174, 313
- Hines, Owen & Eilek (1989) Hines D.C., Owen F.N., & Eilek J.A, 1989, ApJ, 347, 713
- Jaffe & Perola (1974) Jaffe W.J., & Perola G.C., 1974, A&A, 26, 423
- Jetha, Hardcastle & Sakelliou (2006) Jetha N.N., Hardcastle M.J., & Sakelliou I, 2006, MNRAS, 368, 609
- Jetha et al. (2008) Jetha, N. N., Hardcastle, M. J., Babul, A., O’Sullivan, E., Ponman, T. J., Raychaudhury, S., & Vrtilek, J. 2008, to appear in MNRAS, ArXiv e-prints, arXiv:0712.1150
- Kaastra et al. (2004) Kaastra J.S., Tamura T., Peterson J.R., et al., 2004, A&A, 413, 415
- Kim & Narayan (2003a) Kim, W.-T., & Narayan, R. 2003a, ApJL, 596, L139
- Kim & Narayan (2003b) Kim, W.-T., & Narayan, R. 2003b, ApJ, 596, 889
- Koranyi & Geller (2002) Koranyi D.M., & Geller M.J., 2002, AJ, 123, 100
- Laing & Bridle (2002) Laing R.A., & Bridle A.H., 2002, MNRAS, 336, 1161
- Mathews et al. (2004) Mathews, W. G., Brighenti, F., & Buote, D. A. 2004, ApJ, 615, 662
- McNamara & Nulsen (2007) McNamara B.R. & Nulsen P.E.J., 2007, ARA&A, 45, 117
- McNamara et al. (2007) McNamara, B. R., Birzan, L., Rafferty, D. A., Nulsen, P. E. J., Carilli, C., & Wise, M. W. 2007, in “Extragalactic Jets: Theory and Observation from Radio to Gamma Ray” (arXiv:0708.0579)
- Merritt (1984) Merritt D., 1984, ApJ, 276, 26
- Murgia (2000) Murgia M., 2000, Ph.D thesis, University of Bologna
- Nulsen et al. (2003) Nulsen, P. E., McNamara, B. R., David, L. P., & Wise, M. 2003, The Cosmic Cauldron, 25th meeting of the IAU, Joint Discussion 10, Sydney, Australia (arXiv:astro-ph/0311284)
- Nulsen et al. (2006) Nulsen, P.E.J. et al., 2006, in Heating vs. Cooling in Galaxies and Clusters of Galaxies, Eds. H.Böhringer, P.Schuecker, G.W. Pratt & A. Finoguenov (ESO Astrophysics Symposia), (arXiv:astro-ph/0611136)
- Nusser et al. (2006) Nusser, A., Silk, J., & Babul, A. 2006, MNRAS, 373, 739
- O’Donoghue, Eilek & Owen (1993) O’Donoghue A.A., Eilek J.A., & Owen F.N., 1993, ApJ, 408, 428
- O’Sullivan et al. (2005) O’Sullivan E., Vrtilek J.M., Kempner J.C., David L.P., Houck J.C., 2005. MNRAS, 357, 1134 (OS05)
- Owen & Rudnick (1986) Owen F.N., & Rudnick L., 1976, ApJ, 205, L1
- Owen & Ledlow (1994) Owen F.N. & Ledlow M.J., 1994, ASPC, 54, 3190
- Pacholczyk (1970) Pacholczyk A.G., 1970, Radio astrophysics; nonthermal processes in galactic and extragalactic sources, W.H. Freeman, San Francisco
- Parma et al. (1994) Parma P., de Ruiter H.R., Fanti R., Laing R., 1994, in Bicknell G.V., Dopita M.A., Quinn P.J. (eds), The Phyisics of Active Galaxies, ASP Conference Series n.100, p. 241
- Parma et al. (1999) Parma P., Murgia M., Morganti R., Capetti A., de Ruiter H.R., Fanti R., 1999, A&A 344, 7
- Parma et al. (2007) Parma P., Murgia M., de Ruiter H.R., Fanti R., Mack K–H., Govoni F., 2007, A&A, 470, 87
- Pearson & Zensus (1987) Pearson T.J., & Zensus J.A., 1987, in: Zensus J.A., & Pearson T.J. (eds), Parsec–scale Radio Jets, Cambridge University Press, p. 323
- Perley, Willis & Scott (1979) Perley R.A., Willis A.G., & Scott J.S., 1979, Nat, 281, 437
- Peterson et al. (2003) Peterson J.R., Kahn S.M., Paerels F.B. S., et al., 2003, ApJ, 590, 207
- Pilkington & Scott (1965) Pilkington J.D.H., & Scott P.F., 1965, MnRAS, 69, 183
- Pinkney, Burns & Hill (1994) Pinkney J., Burns J.O., & Hill J.M., 1994, AJ, 108, 2031
- Reich et al. (2000) Reich W., Fürst E., Reich P., et al., 2000, A&A, 363, 141
- Roychowdhury et al. (2004) Roychowdhury, S., Ruszkowski, M., Nath, B. B., & Begelman, M. C. 2004, ApJ, 615, 681
- Sakelliou, Merrifield & McHardy (1996) Sakelliou I., Merrifield M.R., & McHardy I.M., 1996, MNRAS, 283, 673
- Sanderson et al. (2006) Sanderson, A. J. R., Ponman, T. J., & O’Sullivan, E. 2006, MNRAS, 372, 1496
- Savolainen et al. (2006) Savolainen T., Wiik K., Valtaoja E., Kadler M., Ros E., Tornikoski M., Aller M.F., Aller H.D., 2006, ApJ, 647, 172
- Smolčić et al. (2007) Smolčić V., Schinnerer E., Finoguenov A. et al., 2007, ApJS, 172, 295
- Tabor & Binney (1993) Tabor G., & Binney J., 1993, MNRAS, 263, 323
- Verkhodanov et al. (1997) Verkhodanov, O.V., Trushkin, S.A., Andernach, H., Cherenkov, V.N., 1997, ASP Conf. Series, Vol. 125, p. 322
- Viner & Erickson (1975) Viner M.R., & Erickson W.C., 1975, AJ, 80, 931
- White et al. (1997) White R.L., Becker R.H., Helfand D.J., & Gregg M.D., 1997, AJ, 475, 479
- Wright & Otrupcek (1990) Wright A. & Otrupcek R., 1990, PKS catalogue