Vol. 8 (2008), No. 2, 211–218
\vs\noReceived 2007 April 27; accepted 2007 May 24
Clustering Property of Wolf-Rayet Galaxies in the SDSS ∗ 00footnotetext: Supported by the National Natural Science Foundation of China.
Abstract
We have analysed, for the first time, the clustering properties of Wolf-Rayet (W-R) galaxies, using a large sample of 846 W-R galaxies selected from the Data Release 4 (DR4) of the Sloan Digital Sky Survey (SDSS). We compute the cross-correlation function between W-R galaxies and a reference sample of galaxies drawn from the DR4. We compare the function to the results for control samples of non-W-R star-forming galaxies that are matched closely in redshift, luminosity, concentration, 4000-Å break strength and specific star formation rate (SSFR). On scales larger than a few Mpc, W-R galaxies have almost the same clustering amplitude as the control samples, indicating that W-R galaxies and non-W-R control galaxies populate dark matter haloes of similar masses. On scales between 0.1–1 Mpc, W-R galaxies are less clustered than the control samples, and the size of the difference depends on the SSFR. Based on both observational and theoretical considerations, we speculate that this negative bias can be interpreted by W-R galaxies residing preferentially at the centers of their dark matter haloes. We examine the distribution of W-R galaxies more closely using the SDSS galaxy group catalogue of Yang et al., and find that 82% of our W-R galaxies are the central galaxies of groups, compared to 74% for the corresponding control galaxies. We find that W-R galaxies are hosted, on average, by dark matter haloes of masses of , compared to for centrally-located W-R galaxies and for satellite ones. We would like to point out that this finding, which provides a direct observational support to our conjecture, is really very crude due to the small number of W-R galaxies and the incompleteness of the group catalogue, and needs more work in future with larger samples.
keywords:
galaxies: distances and redshifts — galaxies: starburst — stars: Wolf-Rayet1 Introduction
Wolf-Rayet (W-R) galaxies are a subset of emission line galaxies whose integrated spectra show direct signatures of W-R stars, most commonly, a broad emission feature at 4686 Å He ii originating in the stellar winds ([Conti 1991]). These galaxies are thought to be undergoing present or very recent star formation that produces massive stars evolving to the W-R stage. This indicates typical ages of 10 Myr and initial masses of 20 ([Maeder & Conti 1994]). They are therefore ideal objects for studying the early phases of starbursts and the burst properties, and for constraining the parameters of the stellar initial mass function (IMF) ([Schaerer et al. 1999]; [Guseva et al. 2000]). Since the first detection of W-R features in He 2–10 ([Allen et al. 1976]), 140 W-R galaxies have been reported by the end of the last century, some found by systematic searches, but most, serendipitously ([Schaerer et al. 1999]). With the large redshift surveys assembled in recent years, in particular the Sloan Digital Sky Survey (SDSS; [York et al. 2000]), the number of W-R galaxies has grown rapidly, and it has become possible to study these galaxies using large and homogeneous samples ([Kniazev et al. 2004]; [Zhang et al. 2007]).
We have presented an SDSS-based sample of 174 W-R galaxies in Zhang et al. (2007), where the relationship between galaxy metallicity and IMF slope was studied. Here we present a new sample consisting of 846 W-R galaxies from the SDSS Data Release 4 (DR4, [Adelman-McCarthy et al. 2006]). This is, to date, the largest and most homogeneous sample of W-R galaxies, which reveals that W-R galaxies are not a random subsample of star-forming galaxies. Rather, they are less luminous, younger in mean stellar age, bluer in color, poorer in metal and more concentrated in structure. In particular, W-R galaxies exhibit the highest specific star formation rates (SSFRs). In this paper, we use the new catalogue to extend our study of W-R galaxies to an especial analysis of their clustering.
The clustering of galaxies as a function of their properties provides strong tests for theoretical models of structure and galaxy formation (e.g. [Peebles 1980]). The clustering is usually quantified using the two-point correlation function (2PCF). In the standard model of structure formation, the amplitude of the 2PCF on scales larger than a few Mpc provides a direct measure of the mass of the dark matter haloes that host the galaxies ([Kaiser 1986]), while the slope of the 2PCF on small scales depends on the detailed location of the galaxies inside/around those dark matter haloes ([Zehavi et al. 2004]). In this paper, we present the two-point cross-correlation function between W-R galaxies and a reference sample of galaxies drawn from the DR4. This is the first determination of the clustering of this special class of galaxies and, as we will see, the data are now large enough to allow for a clustering measurement with acceptable accuracy. We wish to isolate the effect of the W-R features, and so we compare the measurement to that of control samples of non-W-R star-forming galaxies that are closely matched in redshift, luminosity, concentration, star formation rate (SFR) and mean stellar age, as measured by the 4000-Å break strength (D4000). As pointed out by Li et al. (2006b), this close matching is important because previous work has established that the clustering of galaxies depends strongly on these properties (e.g. [Zehavi et al. 2005]; [Li et al. 2006a]). With the help of closely-matched control samples, we will be able to understand whether there is a real physical connection between the location of a galaxy and the W-R features found in it.
Throughout this paper, we assume a cosmological model with the density parameter and cosmological constant . A Hubble constant , in units of 100 km s-1 Mpc-1, is assumed when computing the absolute magnitudes.
2 Data and Methodology
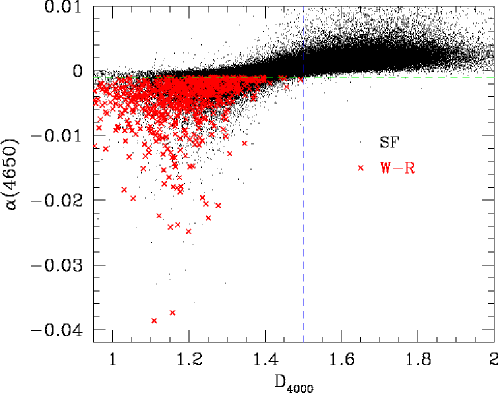
We introduce (the slope of the continuum around 4650 Å) as a new selection criterion. The reason is that this quantity has been found to be more closely associated with the recent star formation history of the galaxy than other quantities such as D4000 and high-order Balmer emission lines. In Figure 1, we can see that most of star-forming galaxies with have D, and all the W-R galaxies have values of D4000 less than 1.5, which means that the stellar populations of these galaxies have mean characteristic ages less than 1 Gyr ([Kauffmann et al. 2003]). Thus is really an indicator of mean stellar age, and hence a suitable criterion for selecting early-stage star bursts. Also, one would expect that for a cluster with W-R stars, its color is dominated by OB stars, hence blue, so the continuum around 4650 Å should be steeper. A detailed description of the selection procedure will be presented in Zhang et al. (2008, in preparation), where we have carried out extensive tests to show that the use of does not introduce significant selection bias into our W-R sample. For example, we have also visually examined the spectra of a large number of star-forming galaxies of and found no objects with obvious W-R features.
We aim to select a sample of W-R galaxies showing evident W-R features in their spectra, at least the blue emission bump around 4650 Å and possibly also a red bump around 5808 Å. Our selection is based on the data catalogues from the SDSS studies at MPA/JHU, publicly available at http://www.mpa-garching.mpg.de/SDSS/ (see also [Brinchmann et al. 2004]). The current version of these catalogues is based on the SDSS DR4. We start with all the MPA/JHU objects that are classified as star-forming galaxies, including both high S/N and low S/N ones (see [Brinchmann et al. 2004] for a detailed description). The procedure of galaxy classification can be found in Kauffmann et al. (2003). We then measure the of each galaxy. A total number of 32828 candidates are then selected from these star-forming galaxies by requiring –0.001. Next, we visually examine the spectra of these candidates and keep those with obvious W-R features. This resulted in a sample of 866 objects. Since some of these objects may be separate H ii regions in a same galaxy, we visually examined their -band images and obtained a final sample of 846 individual W-R galaxies located in the full SDSS DR4 sky region. In some cases, these galaxies show both the blue and red bumps, while in other cases only the blue bump is visible. We noticed that almost all of our W-R galaxies (838/846) are classified as high S/N star-forming galaxies in the MPA/JHU catalogues.
We have constructed 20 control samples of non-W-R galaxies from the underlying star-forming galaxies, by simultaneously matching five physical parameters: redshift, absolute magnitude, concentration, D4000 and specific star formation rate. The matching tolerances are km s-1, , , D and .
When computing the correlation functions, we need to have complete knowledge of the observational selection effects in the NYU-VAGC release. This is the reason why we select our reference sample from NYU-VAGC itself. Actually, both the MPA catalogue and the NYU-VAGC are based on SDSS DR4. The reason why we did not match the two catalogues and find counterparts from each other is that our methodology of computing cross-correlation functions does not require the sample being studied (the W-R or control sample) to be a subsample of the reference sample.
We used the New York University Value Added Galaxy Catalogue (NYU-VAGC)111http://wassup.physics.nyu.edu/vagc/, which is also DR4-based and is described in detail in Blanton et al. (2005), to construct a reference sample of 300,000 galaxies. The galaxies have , and , being the -band Petrosian apparent magnitude corrected for foreground extinction, and , the -band absolute magnitude corrected to redshift . This sample formed the basis of previous investigations of the correlation function, power spectrum, pairwise velocity dispersion distributions, and luminosity/stellar mass functions of galaxies. In order to compute the cross-correlation functions, we constructed random samples that were meant to include all the observational selection effects. First, in order to contain the survey sample, a spatial volume that is sufficiently large is selected. Secondly, we randomly distribute points within the volume and eliminate the points that are outside the survey boundary. Finally, we select random galaxies within the same magnitude limits as the observational sample ([Li et al. 2006a]). We also corrected carefully for the effect of fibre collisions ([Li et al. 2006b]).
For quantifying the clustering in the W-R (or matched control) and reference galaxy samples, we use the two-point correlation function , which measures the excess probability over random, at separations perpendicular and parallel to the line of sight, and . is calculated using the estimator
| (1) |
where and are the number of galaxies in the reference sample and in the random sample; and are the cross pair counts between the W-R (or control) and reference samples, and between the W-R (or control) and the random samples, respectively.
Once is estimated, we integrate along the redshift direction to obtain the projected correlation function,
| (2) |
Following Li et al. (2006b), the summation for computing runs from Mpc to Mpc, with Mpc. The errors on the clustering measurements are estimated using the bootstrap resampling technique ([Barrow et al. 1984]; [Li et al. 2006a]).
3 Results
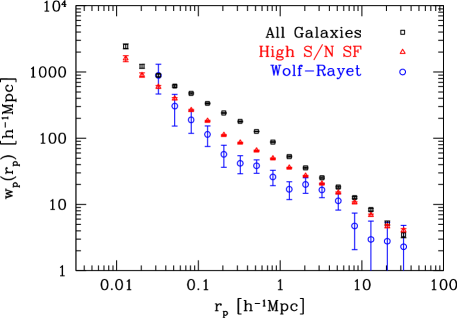
In Figure 2, we show , the projected cross-correlation function of the W-R galaxies with respect to the reference sample (circles). For comparison, we also show the cross-correlation function between the set of the high S/N star-forming galaxies in SDSS DR4 and the same reference galaxies (triangles), as well as the projected auto-correlation function of the reference galaxies (squares). Compared to the underlying star-forming galaxies and the reference galaxies, the W-R galaxies are the least strongly clustered on scales larger than 0.1 Mpc. On smaller scales, the W-R galaxies seem to cluster more strongly than the star-forming galaxies, but the effect is weak. In particular, Figure 2 shows that there is a noticeable change in the slope of the correlation function of W-R galaxies at 1 Mpc. Such a change in slope can also be seen in the curves for the star-forming galaxies and the reference galaxies, but it is more pronounced for the W-R galaxies.
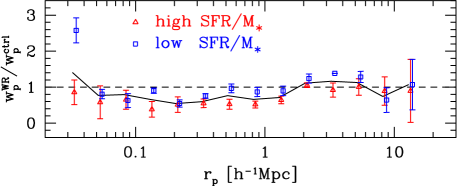
To eliminate any zeroth-order trends with galaxy mass, structure and mean stellar age, as discussed in Section 1, we compare the clustering measurement of the W-R galaxies with that of the control sample of non-W-R star-forming galaxies. The result is shown in Figure 3, where we plot the ratio of the measurement of W-R galaxies to the average measurement of 20 control samples. One can see that, on scales larger than a few Mpc, the clustering amplitude of W-R galaxies does not differ significantly from that of similar, non-W-R galaxies. In contrast, on the intermediate scales, there is still a difference, in the sense that the ratio between the two cross-correlation functions exhibits a pronounced ‘dip’ at scales between 100 kpc and 1 Mpc. As pointed out by Li et al. (2006b), the error bars estimated using the bootstrap resampling technique do not take into account effects due to cosmic variance, which can induce significant fluctuations in the amplitude of the correlation function from one part of the sky to another. We therefore follow Li et al. (2006b) and divide the survey into several different areas on the sky, and recompute the ratio for each of these subsamples. We find that, on scales between 0.1 and 1 Mpc, all the subsamples, the ratio (WR to control) lie systematically below unity, indicating that the dip seen in Figure 3 is robust. We have also examined the dispersion in the measurement caused by differences between the control samples, and once again there is a clear indication that W-R galaxies are less strongly clustered on these scales relative to all of the control samples.

We ordered all the W-R galaxies by decreasing , then defined the first half as ‘high’ SFR objects, and the second half as ‘low’ SFR objects. In Figure 4, we display the ratio curve separately for the high and low SFR objects. We find there is a difference in the strength of the dip at the intermediate scales: the dip is stronger for the W-R galaxies with higher star formation rates.
4 Discussion
Our clustering results on large scales presented in Figure 2 demonstrate that W-R galaxies are found in less massive dark matter haloes in the general population of star-forming galaxies. When we compare the clustering of W-R galaxies relative to carefully matched control samples, we find that the difference in the large scale clustering disappears. This indicates that W-R galaxies and non-W-R control galaxies populate dark matter haloes of similar masses, which is consistent with the fact that W-R galaxies are not a random subsample of the underlying star-forming galaxies. As mentioned in Section 1, W-R galaxies are found to be on average less luminous, bluer, more concentrated, and younger in mean stellar age and higher in SFR than all star-forming galaxies. This is why we see differences on large scales in Figure 2 where W-R galaxies are compared to all star-forming galaxies, but do not see differences in Figure 3 where they are compared to control samples of similar properties.
Our most interesting result is that, on scales between 0.1 and 1 Mpc, W-R galaxies are significantly negatively biased relative to non W-R star-forming galaxies of the same luminosity, concentration, mean stellar age and specific SFR. We also see from Figure 2 a clear change around 1Mpc in the slope of the cross-correlation function of W-R galaxies, and such a change is much more remarkable for W-R galaxies than for all galaxies and all star-forming galaxies. These two observational facts imply that W-R galaxies tend to occupy preferred positions within their dark matter haloes where conditions are more favourable for producing massive stars. We speculate that such preferred locations are the centers of the dark haloes, based on the following observational and theoretical considerations.
-
1.
The change in the slope of the correlation function can be understood as the transition between the scales where the pair counts are dominated by galaxy pairs in the same halo to those where galaxy pairs are mostly in separate haloes ([Jing & Börner 2004]).
-
2.
The physical scales of 0.1–1 Mpc, where we do see significant difference in the clustering of W-R galaxies and non-W-R galaxies, are comparable to the diameters of the dark matter haloes that are expected to host galaxies with luminosities of ([Mandelbaum et al. 2006]).
-
3.
Gas around halo centers could reach high enough overdensities to cool via radiative processes. This effect is more efficient in the less massive dark matter haloes that are expected to host galaxies with stellar masses comparable to the objects in our sample.
-
4.
The negative bias observed here for W-R galaxies looks quite similar to that of AGN presented in Li et al. (2006b). In that paper, the authors used mock catalogues constructed from high-resolution -body simulations to show that such a negative bias between 0.1–1 Mpc can be explained by AGN residing preferentially at the centers of their dark matter haloes.
-
5.
We notice that the behaviour of the cross-correlation function between W-R galaxies and reference galaxies is very similar to the cross-correlation function between low-mass groups and relatively bright galaxies obtained by Yang et al. (2005b). Since we use a magnitude-limited sample, most of the reference galaxies are relative bright.
-
6.
There have been studies claiming possible detection of W-R stars in central cluster galaxies (e.g. [Allen 1995]).
In order to understand this conjecture in more details, we have examined the distribution of W-R galaxies more closely, using the SDSS galaxy group catalogue of Yang et al. (2008). This catalogue was constructed using the halo-based group finder of Yang et al. (2005a) and applied to the NYU-VAGC. This group finder uses the general properties of cold dark matter (CDM) haloes (i.e. virial radius, velocity dispersion, etc.) to determine the membership of groups ([Weinmann et al. 2006]). We search for counterparts of the 846 W-R galaxies and the control galaxies, in the group catalogue. Of the W-R galaxies, 257 have been linked to groups. We find that 82% of these W-R galaxies are the central galaxies of groups, compared to 74% for the corresponding control galaxies. In order to test whether this result suffers from any possible selection effects, we analysed the clustering properties of both the 257 group members and the galaxies that are not included in the group catalogue, using the same method as described in Section 3. The result showed no significant differences between these subsamples and the whole W-R sample. We should point out that those galaxies that are not in the group catalogue are mostly in low mass haloes, since the correlation function amplitude is slightly lower than that of those linked to groups. However, the ratio between W-R galaxies that are not in groups and the corresponding control galaxies remains unchanged and hence the dip on intermediate scales also remains unchanged, only because the amplitude of the correlation function of the control galaxies is also reduced. Therefore, such a direct look into the observational group catalogue provides an encouraging support to our conjecture described above that W-R galaxies reside preferentially at the centers of their dark matter haloes.
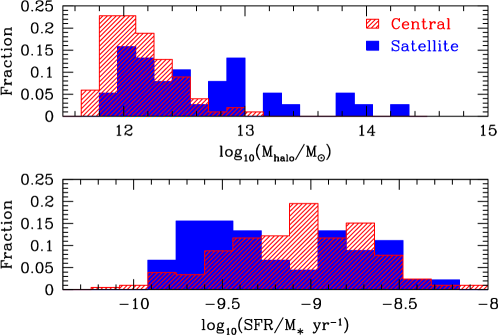
We plot in Figure 5 the distribution of the virial mass of the host dark matter haloes (top) and the specific SFR (bottom) for W-R galaxies that are centrally located (red) or are satellites (blue) within their own groups. We find that the W-R galaxies are hosted, on average, by dark matter haloes of masses of . The centrally-located W-R galaxies, which dominate the W-R galaxy population, tend to be hosted by less massive dark matter haloes with a mean virial mass of , compared to for the satellite W-R galaxies. Moreover, these satellites exhibit a bimodal distribution in SFR, which is not seen for the centrally-located W-R galaxies. In addition, the centrally-located W-R galaxies have higher star formation rates than the satellite galaxies. This can explain the trend of clustering with SFR seen in Figure 4, if one accepts our conjecture that the negative bias of W-R galaxies on intermediate scales is mainly driven by the fraction of centrally located W-R galaxies.
We would like to point out that the examination based on the group catalogue is not a strong enough support to our halo-center conjecture. First, the number of W-R galaxies is really too small and only a third of them are linked to groups. The fluctuations in the fractional statistics is thus rather large. In addition, the group catalogue itself is incomplete for faint luminosities that are typical for the W-R sample. To provide more convincing observational evidence in support of our conjecture, it needs larger samples and more work in the future.
We searched for W-R galaxies only among star-forming galaxies. There is no denying that previous studies have also presented evidence of W-R features in Seyfert 2 and LINERS (e.g. [Osterbrock & Cohen 1982]; [Heckman et al. 1997]). However, what we are interested in is the “traditional” W-R galaxies for which the nebular spectrum is likely due to the photoionization of stellar origin (Schaerer et al. 1999). By this definition, these W-R galaxies are simply the very early phase of starburst alaxies. Therefore, by comparing them and the regular star-forming galaxies in regard to clustering we will be able to see whether star-forming galaxies at different locations are at different starburst stages. Our results here give a positive answer, that the difference in location between W-R galaxies and regular star-forming galaxies may tell us something about merger-triggered starbursts in galaxies. In other word, if we think that starbursts are mainly triggered by interactions/mergers, then the negative bias of W-R galaxies is consistent with a picture in which the early phase of starbursts are more frequently seen in central-satellite mergers, but the starbursts in satellite-satellite mergers have passed this early stage and do not show W-R features any more. The reason why we do not see in Figure 2 the expected rapid rise of on the smallest scales is only that the size of the W-R sample is too small and that we have no measurements on scales smaller than 0.3 Mpc. From Figure 2, we see that the correlation of W-R galaxies does exhibit a rapidly rising tendency on these scales.
Acknowledgements.
We thank Cheng Li for significant input into this project from the beginning, and for his help with the methodology of computing cross-correlation functions and constructing control samples. We are grateful to Frank van den Bosch, Anna Pasquali, Xiaohu Yang and Houjun Mo for helpful comments and for providing their SDSS galaxy group catalogue. We thank Yipeng Jing and Andreas Faltenbacher for helpful discussions. This work is supported by the National Natural Science Foundation of China, through Grants 10573014 and 10633020, and the Bairen Project of the Chinese Academy of Sciences. This work has made use of the SDSS data and MPA/JHU catalogues of SDSS galaxies. Funding for the SDSS and SDSS-II has been provided by the Alfred P. Sloan Foundation, the Participating Institutions, the National Science Foundation, the U.S. Department of Energy, the National Aeronautics and Space Administration, the Japanese Monbukagakusho, the Max Planck Society, and the Higher Education Funding Council for England. The SDSS Web Site is http://www.sdss.org/. The SDSS is managed by the Astrophysical Research Consortium for the Participating Institutions. The Participating Institutions are the American Museum of Natural History, Astrophysical Institute Potsdam, University of Basel, Cambridge University, Case Western Reserve University, University of Chicago, Drexel University, Fermilab, the Institute for Advanced Study, the Japan Participation Group, Johns Hopkins University, the Joint Institute for Nuclear Astrophysics, the Kavli Institute for Particle Astrophysics and Cosmology, the Korean Scientist Group, the Chinese Academy of Sciences by the LAMOST Project, Los Alamos National Laboratory, the Max-Planck-Institute for Astronomy (MPIA), the Max-Planck-Institute for Astrophysics (MPA), New Mexico State University, Ohio State University, University of Pittsburgh, University of Portsmouth, Princeton University, the United States Naval Observatory, and the University of Washington.References
- [Adelman-McCarthy et al. 2006] Adelman-McCarthy J. K., Agüeros M. A., Allam S. S. et al., 2006, ApJS, 162, 38
- [Allen et al. 1976] Allen D. A., Wright A. E., Goss W. M., 1976, MNRAS, 177, 91
- [Allen 1995] Allen S. W., 1995, MNRAS, 276, 947
- [Barrow et al. 1984] Barrow J. D., Bhavsar S. P., Sonoda D. H., 1984, MNRAS, 210, 19
- [Blanton et al. 2005] Blanton M. R., Schlegel D. J., Strauss M. A. et al., 2005, AJ, 129, 2562
- [Brinchmann et al. 2004] Brinchmann J., Charlot S., White S. D. M. et al., 2004, MNRAS, 351, 1151
- [Conti 1991] Conti P. S., 1991, ApJ, 377, 115
- [Guseva et al. 2000] Guseva N. G., Izotov Y. I., Thuan T. X., 2000, ApJ, 531, 776
- [Heckman et al. 1997] Heckman T. M., Gonzalez-Delgado R., Leigherer C. et al., 1997, ApJ, 482, 114
- [Jing & Börner 2004] Jing Y. P., Börner G., 2004, ApJ, 617, 782
- [Kaiser 1986] Kaiser N., 1986, MNRAS, 219, 785
- [Kauffmann et al. 2003] Kauffmann G., Heckman T. M., Tremonti C. et al., 2003, MNRAS, 346, 1055
- [Kniazev et al. 2004] Kniazev A. Y., Pustilnik S. A., Grebel E. K. et al., 2004, ApJS, 153, 429
- [Li et al. 2006a] Li C., Kauffmann G., Jing Y. P. et al., 2006a, MNRAS, 368, 21
- [Li et al. 2006b] Li C., Kauffmann G., Wang L. et al., 2006b, MNRAS, 373, 457
- [Maeder & Conti 1994] Maeder A., Conti P. S., 1994, ARA&A, 32, 227
- [Mandelbaum et al. 2006] Mandelbaum R., Seljak U., Kauffmann G. et al., 2006, MNRAS, 368, 715
- [Osterbrock & Cohen 1982] Osterbrock D. E., Cohen R. D., 1982, ApJ, 261, 64
- [Peebles 1980] Peebles P. J. E., 1980, The Large-Scale Structure of the Universe, Princeton: Princeton Univ. Press
- [Schaerer et al. 1999] Schaerer D., Contini T., Pindao M., 1999, A&AS, 136, 35
- [Weinmann et al. 2006] Weinmann S. M., van den Bosch, Frank C. et al., 2006, MNRAS, 366, 2
- [Yang et al. 2005a] Yang X. H., Mo H. J., van den B. et al., 2005a, MNRAS, 356, 1293
- [Yang et al. 2005b] Yang X. H., Mo H. J., van den B. et al., 2005b, MNRAS, 362, 711
- [] Yang X. H., Mo H. J., van den Bosch et al., 2008, ApJ, 671, 153
- [York et al. 2000] York D. G., Adelman J., Anderson J. E. J. et al., 2000, AJ, 120, 1579
- [Zehavi et al. 2004] Zehavi I., Weinberg D. H., Zheng Z. et al., 2004, ApJ, 608, 16
- [Zehavi et al. 2005] Zehavi I., Zheng Z., Weinberg D. H. et al., 2005, ApJ, 630, 1
- [Zhang et al. 2007] Zhang W., Kong X., Li C., Zhou H. Y., Cheng F. Z., 2007, ApJ, 655, 851