Multiple and Precessing Collimated Outflows in the Planetary Nebula IC 4634
Abstract
With its remarkable double-S shape, IC 4634 is an archetype of point-symmetric planetary nebulae (PN). In this paper, we present a detailed study of this PN using archival HST WFPC2 and ground-based narrow-band images to investigate its morphology, and long-slit spectroscopic observations to determine its kinematics and to derive its physical conditions and excitation. The data reveal new structural components, including a distant string of knots distributed along an arc-like feature 40′′–60′′ from the center of the nebula, a skin of enhanced [O iii]/H ratio enveloping the inner shell and the double-S feature, and a triple-shell structure. The spatio-kinematical study also finds an equatorial component of the main nebula that is kinematically independent from the bright inner S-shaped arc. We have investigated in detail the bow shock-like features in IC 4634 and found that their morphological, kinematical and emission properties are consistent with the interaction of a collimated outflow with surrounding material. Indeed, the morphology and kinematics of some of these features can be interpreted using a 3D numerical simulation of a collimated outflow precessing at a moderate, time-dependent velocity. Apparently, IC 4634 has experienced several episodes of point-symmetric ejections oriented at different directions with the outer S-shaped feature being related to an earlier point-symmetric ejection and the outermost arc-like string of knots being the relic of an even much earlier point-symmetric ejection. There is tantalizing evidence that the action of these collimated outflows has also taken part in the shaping of the innermost shell and inner S-shaped arc of IC 4634.
Subject headings:
ISM: planetary nebulae: general – ISM: planetary nebulae: individual: IC 4634 – stars: winds, outflows1. Introduction
Planetary nebulae (PNe) represent the final phases of the stellar evolution of low- and intermediate-mass stars. The shape of a PN is thought to be determined by the interaction of the current fast, tenuous stellar wind (e.g., Patriarchi & Perinotto, 1991) of its central star with the previous slow, dense wind of the Asymptotic Giant Branch (AGB) phase. In the so-called Interacting Stellar Winds (ISW) model of PN formation (Kwok et al., 1978), the critical parameter is the density distribution of the AGB wind (Balick, 1987): a spherical symmetric AGB wind will result in a spherical PN, while a polar density gradient in the AGB wind will result in an elliptical or bipolar PN, depending on the degree of the density gradient.
This simplified view of PN formation has been challenged by the overwhelming body of observations of PNe showing small-scale features (e.g., NGC 7662, Perinotto et al., 2004), collimated bipolar outflows (e.g., NGC 7009, Fernández, Monteiro, & Schwarz, 2004), and point-symmetric morphologies, including multiple point-symmetric bubbles (e.g., Hen 2-47 and M1-37, Sahai, 2000) and point-symmetric collimated outflows (e.g., NGC 6884, Miranda, Guerrero, & Torrelles, 1999). All these features are difficult to interpret in the framework of the ISW model and have inspired new theoretical ideas to explain the shaping of PNe. New scenarios of PNe formation and shaping include magnetic collimation (García-Segura & López, 2000), the action of collimated fast winds (Lee & Sahai, 2003), or the blowing up of a warped circumstellar disk by the fast stellar wind (Rijkhorst, Mellema, & Icke, 2005).
Stanghellini, Corradi, & Schwarz (1993) recognized a new morphological class of PNe characterized by the point-symmetry with respect to their centers. The morphology of these PNe suggests that they are shaped by a mechanism involving precession, most likely the action of precessing or rotating collimated outflows. An investigation of PNe with point-symmetric morphologies is, thus, essential to evaluate the action of precessing collimated outflows in the formation of PNe and to assess the origin of the collimating mechanisms. Among the PNe with point-symmetric morphology, IC 4634 is an outstanding case. IC 4634 is an archetypical point-symmetric PN as Schwarz (1993) found that its remarkable double-S-shaped morphology is reflected in its kinematics: each component of the two S-shaped features expands radially with its counterpart on the other side of the star expanding in opposite direction. The collimated outflows of IC 4634 are further revealed by bow shock features indicating their interaction with the surrounding medium. Therefore, both the morphology and kinematics of IC 4634 suggest the presence of highly symmetric fast collimated outflows, and the precession or rotation of the source that produced them.
Since the study of IC 4634 by Schwarz (1993), several studies have further investigated the kinematical and morphological properties of IC 4634 (Hajian et al., 1997; Toledano et al., 2003), but a detailed study is lacking. In this paper, we present a spatio-kinematical study of IC 4634 using narrow-band archival HST WFPC2 and ground-based images and complementary long-slit echelle and medium-dispersion spectroscopic observations. The observations, described in 2, have allowed us to investigate the morphology, kinematics, and physical conditions of IC 4634 and the possible shock excitation of the bow shock features. A thorough description of the different structural components of IC 4634 derived from these observations is given in 3, and the action of precessing collimated outflows is examined and modeled in 4. The results are discussed in 5.
2. Observations
2.1. Narrow-Band Imaging Observations
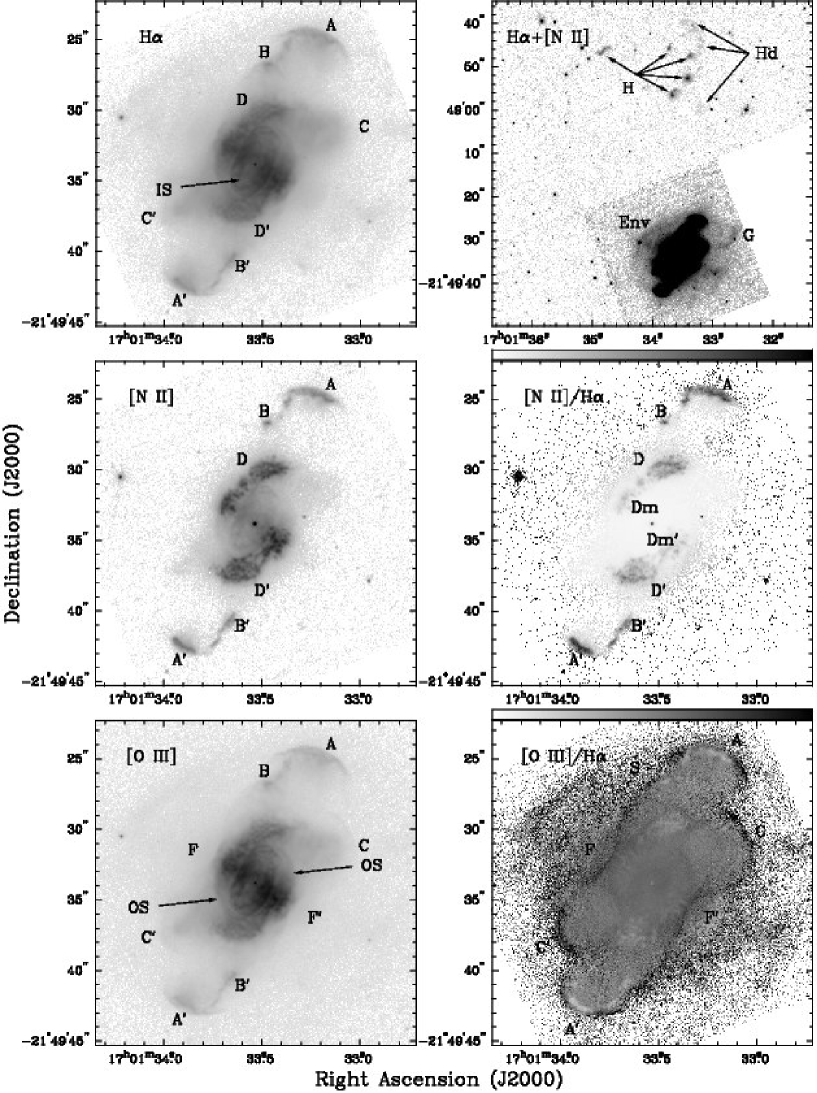
Narrow-band HST WFPC2 images of IC 4634 in the H, H, [N ii] 6584, and [O iii] 5007 lines were retrieved from the HST archive (Proposal ID 6856, PI: J.T. Trauger). The total integration times were 800 s for the H image and 1,000 s for the H, [N ii], and [O iii] images. These images were calibrated via the pipeline procedure. Cosmic rays were removed by combining different exposures obtained with the same filter, using standard IRAF routines. The HST WFPC2-PC H, [N ii], and [O iii] images of IC 4634 are displayed in Figure 1-left. The H image, not shown here, has been used in conjunction with the H image to investigate the amount of extinction towards IC 4634 and its spatial distribution. The mosaiced HST WFPC2 H and [N ii] images have been added together to produce the deep H+[N ii] image shown in Fig. 1-top-right.
The HST WFPC2-PC H, [N ii], and [O iii] images of IC 4634 have been used to derive [N ii]/H, [O iii]/H, and [N ii]/[O iii] ratio maps. In Fig. 1-right-center and -bottom, the [N ii]/H and [O iii]/H ratio maps are shown, respectively. The [N ii]/[O iii] ratio map is not presented here because it is very similar to the [N ii]/H ratio map.
Additional narrow-band images of IC 4634 were obtained at the 2.5m Nordic Optical Telescope (NOT) of the Roque de los Muchachos Observatory (La Palma, Spain) on 2005 August 1. The images were acquired through filters that included the H (=6563 Å, =9 Å, =900 s) and H+[N ii] (=6562 Å, =46 Å, =1800 s) emission lines using the ALFOSC (Andalucia Faint Object Spectrograph and Camera) camera in imaging mode. The detector was an E2V 2K2K CCD with a pixel size of 13.5m, providing a plate scale of 019 pixel-1 and a field of view of 65. The angular resolution during the observations, as derived from the of stars in the field of view, was 08–09.
2.2. Echelle Observations
High-dispersion spectroscopic observations of the H and [N ii] 6548,6584 Å lines of IC 4634 were obtained using the echelle spectrograph on the 4m Blanco Telescope of the Cerro Tololo Inter-American Observatory (CTIO) on 2002 June 22. The spectrograph was used in the long-slit mode to obtain single-order observations of the H and [N ii] 6548,6584 Å lines. The unvignetted slit length is 3′. The 79 line mm-1 echelle grating and the long-focus red camera were used, resulting in a reciprocal dispersion of 3.4 Å mm-1. The data were recorded with the SITe 2K No. 6 CCD with a pixel size of 24 m. This configuration provides a spatial scale of 026 pixel-1 and a sampling of 3.7 km s-1 pixel-1 along the dispersion direction. The slit width was set to 09, and the resultant instrumental resolution () was 8 km s-1. The angular resolution, determined by the seeing, was 10. The echelle observations were made with the slit placed at the central star of IC 4634 and oriented along the position angles (PA) 60∘ (=1050 s), 120∘ and 180∘ (=900 s), and 150∘ and 166∘ (=1200 s).
High-dispersion spectroscopic observations of the H, [N ii] 6584 Å, and [O iii] 5007 Å lines were also obtained using the IACUB spectrograph (McKeith et al., 1993) on the 2.5m NOT of the Roque de los Muchachos Observatory (La Palma, Spain) on 2004 June 29. The spectrograph was used in the long-slit mode to obtain single-order observations of the H and [N ii] 6584 Å lines in the 9th order, and of the [O iii] 5007 Å line in the 11th order. IACUB provides a reciprocal dispersion of 1.74 Å mm-1 in the 9th order and 1.43 Å mm-1 in the 11th order. The data were recorded with a Thomson CCD with a pixel size of 19 m. This configuration provides a spatial scale of 0139 pixel-1, and a sampling along the dispersion direction of 1.5 km s-1 pixel-1 for the spectrum of the H and [N ii] 6584 Å lines, and 1.6 km s-1 pixel-1 for the spectrum of the [O iii] 5007 Å line. The unvignetted slit length is 40″ and the slit width was set to 065, resulting in an instrumental resolution () of 9.5 km s-1 for the H and [N ii] 6584 Å lines, and 8.5 km s-1 for the [O iii] 5007 Å line. The angular resolution, determined by the seeing, was 08. The echelle observations of the H and [N ii] 6584 Å lines was made along a slit offset 2″ West and 464 North of the central star of IC 4634 and oriented along PA=0∘ (=1200 s). The echelle observations of the [O iii] 5007 Å line was made along a slit placed at the central star of IC 4634 and oriented along PA=150∘ (=1800 s).
| Date | Slit Position | Position Angle | Number | |
|---|---|---|---|---|
| [arcdeg] | [s] | of Spectra | ||
| 2002 June 16 | Central Star | 153 | 900 | 1 |
| Central Star | 153 | 300 | 4 | |
| Central Star | 153 | 60 | 3 | |
| Central Star | 153 | 20 | 3 | |
| 2004 May 24 | Central Star | 153 | 300 | 3 |
| Central Star | 153 | 10 | 3 | |
| 2004 August | Central Star | 90 | 120 | 3 |
| Central Star | 90 | 30 | 1 | |
| Central Star | 90 | 20 | 1 | |
| Central Star | 90 | 10 | 4 | |
| A | 90 | 300 | 3 | |
| A′ | 90 | 600 | 3 | |
| D | 90 | 30 | 4 | |
| D′ | 90 | 300 | 3 |
| IS | A | A′ | D | D′ | ||||||
|---|---|---|---|---|---|---|---|---|---|---|
| Line | ||||||||||
| H i 4340 | 402 | 44 | 413 | 45 | 425 | 46 | 413 | 45 | 376 | 41 |
| [O iii] 4363 | 5.70.3 | 6.3 | 7.51.6 | 8.3 | 6.00.8 | 6.6 | 6.00.4 | 6.6 | 5.00.9 | 5.5 |
| He i 4387 | 1.20.2 | 1.3 | ||||||||
| He i 4471 | 5.20.3 | 5.6 | 5.41.2 | 5.8 | 5.20.7 | 5.6 | 5.20.4 | 5.6 | 4.60.6 | 5.0 |
| N iii4641 + O ii4649 | ||||||||||
| + C iv4658 | 1.10.2 | 1.1 | ||||||||
| He ii 4686 | 0.50.2 | 0.5 | ||||||||
| [Ar iv] 4714 | 1.50.1 | 1.5 | 1.00.2 | 1.0 | 1.20.4 | 1.2 | ||||
| [Ar iv] 4740 | 1.20.1 | 1.2 | 0.50.2 | 0.5 | 0.80.3 | 0.8 | ||||
| H i 4861 | 100 | 100 | 100 | 100 | 100 | 100 | 100 | 100 | 100 | 100 |
| He i 4920 | 1.70.2 | 1.7 | 2.00.6 | 2.0 | 1.80.6 | 1.8 | 1.90.3 | 1.9 | 1.80.5 | 1.8 |
| [O iii] 4959 | 33010 | 322 | 2918 | 284 | 260 20 | 254 | 290 15 | 283 | 28520 | 278 |
| [O iii] 5007 | 995 30 | 963 | 87618 | 847 | 850 25 | 822 | 870 30 | 841 | 83530 | 808 |
| [N i] 5199 | 0.140.05 | 0.13 | 1.70.5 | 1.6 | ||||||
| [Fe iii] 5270 | 0.150.06 | 0.14 | 0.30.1 | 0.3 | ||||||
| [Cl iii] 5517 | 0.400.06 | 0.35 | 0.70.2 | 0.6 | 0.60.2 | 0.5 | 0.60.2 | 0.5 | 0.40.2 | 0.4 |
| [Cl iii] 5535 | 0.580.05 | 0.51 | 0.80.3 | 0.7 | 0.60.2 | 0.5 | 0.70.2 | 0.6 | 0.60.2 | 0.5 |
| [N ii] 5755 | 0.350.04 | 0.30 | 1.50.6 | 1.3 | 2.20.7 | 1.9 | 1.20.3 | 1.0 | 1.10.4 | 0.9 |
| C iv 5801-12 | 0.550.06 | 0.46 | ||||||||
| He i 5876 | 171 | 14.1 | 16.91.0 | 14.0 | 16.21.2 | 13.4 | 17.01.5 | 14.1 | 19.71.3 | 16.4 |
| [O i] 6300 | 0.80.2 | 0.6 | 9.60.5 | 7.4 | 9.60.5 | 7.5 | 4.40.5 | 3.4 | 4.90.7 | 3.8 |
| [S iii] 6312 | 1.30.15 | 1.0 | 2.30.5 | 1.8 | 2.70.4 | 2.1 | 1.90.4 | 1.5 | 2.30.6 | 1.8 |
| [O i] 6363 | 0.300.10 | 0.23 | 3.50.4 | 2.7 | 3.30.4 | 2.5 | 1.70.4 | 1.3 | 1.70.5 | 1.3 |
| [N ii] 6548 | 4.20.4 | 3.2 | 374 | 28 | 424 | 31 | 202 | 15.0 | 225 | 16.5 |
| H i 6563 | 35520 | 264 | 37910 | 283 | 36510 | 272 | 39010 | 290 | 3738 | 278 |
| [N ii] 6584 | 11.20.8 | 8.4 | 1106 | 82 | 1076 | 80 | 565 | 42 | 656 | 49 |
| He i 6678 | 5.20.4 | 3.8 | 5.90.5 | 4.3 | 5.10.5 | 3.8 | 5.00.3 | 3.7 | 5.80.5 | 4.3 |
| [S ii] 6717 | 0.700.15 | 0.5 | 11.21.5 | 8.2 | 10.71.5 | 7.8 | 4.61.0 | 3.4 | 4.81.1 | 3.5 |
| [S ii] 6731 | 1.40.2 | 1.0 | 17.51.5 | 12.7 | 14.01.5 | 10.2 | 7.81.2 | 5.7 | 8.71.2 | 6.4 |
| He i 7065 | 8.00.7 | 5.6 | 5.30.3 | 3.7 | 5.20.4 | 3.6 | 5.50.6 | 3.9 | 7.20.7 | 5.1 |
| [Ar iii] 7135 | 13.50.8 | 9.4 | 18.11.0 | 12.5 | 16.51.1 | 11.5 | 18.31.3 | 12.7 | 20.21.5 | 14.0 |
| He i 7281 | 1.10.2 | 0.8 | 1.10.2 | 0.8 | 1.10.2 | 0.8 | ||||
| [O ii] 7320 | 3.00.3 | 2.0 | 9.40.8 | 6.3 | 9.00.7 | 6.1 | 9.80.7 | 6.7 | ||
| [O ii] 7330 | 2.80.3 | 1.9 | 7.40.9 | 5.0 | 8.10.8 | 5.5 | 8.20.8 | 5.6 | ||
| F(H) (ergs cm-2 s-1) | 1.410-11 | 4.010-12 | 3.510-12 | 2.610-12 | 2.110-12 | |||||
2.3. Medium-Dispersion Spectroscopic Observations
Medium-dispersion long-slit spectroscopic observations of IC 4634 were obtained using the Boller & Chivens spectrograph on the 2.1m telescope of the Observatorio Astronómico Nacional de San Pedro Mártir (Baja California, Mexico) on 2002 June 16 and 2004 May 20 and August 12. Multiple observations were obtained at several slit positions as listed in Table 1. In all cases, the 400 line mm-1 grating was used, the slit length was 5′, and its width was set to 150 m, projecting to 2″ on the sky. The data were recorded on a SITe3 1K CCD with pixel size of 24m. This configuration provides a spatial scale of 105 pixel-1 and a spectral scale of 3 Å pixel-1 with a spectral coverage from 4240 Å to 7310 Å. The long-slit spectra were reduced and calibrated following standard procedures using the XVISTA package111 XVISTA was originally developed as Lick Observatory Vista. It is currently maintained by Jon Holtzman at New Mexico State University and is available at http://ganymede.nmsu.edu/holtz/xvista. . For the wavelength calibration, we used a He-Ar lamp. The spectral resolution was 6.8 Å. For the flux calibration, several standard stars were observed each night.
3. Structural Components of IC 4634
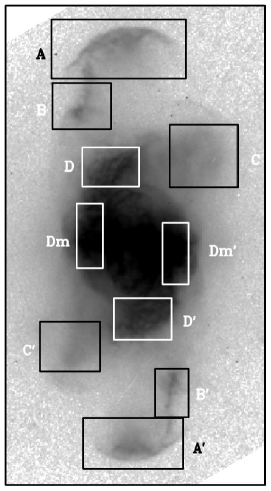
The HST narrow-band images and ratio maps of IC 4634 shown in Fig. 1 reveal a wealth of structural components in this nebula. In Fig. 1, we have labeled the most prominent structures in IC 4634:
-
•
a bright inner shell (IS), surrounded by a dim outer shell (OS),
-
•
an inner S-shaped feature formed by two knotty point-symmetric arcs (D-D′) that present distinct properties along the minor axis of IS (Dm-Dm′),
-
•
an outer S-shaped feature formed by two pairs of bow shock-like structures (A-A′ and B-B′) along different PAs and located at different distances from the central star,
-
•
a pair of bow shock-like structures, C-C′, along PA120°,
-
•
a skin of enhanced [O iii]/H ratio (S) that encloses the inner shell and bow shock-like structures,
-
•
an outer envelope (Env) surrounding all previous components and where some individual features (F-F′ and G) can be distinguished,
-
•
a string of knots (H) distributed along an arc-like feature at 40′′ North of IC 4634 and accompanied by diffuse emission (Hd).
In the following, we will describe in greater detail the morphology, kinematics, excitation, and physical conditions of the different structural components present in IC 4634.
t! IS A A′ D D′ Plasma Diagnostics [S ii] (cm-3) 10,600 2,800 1,500 3,800 5,200 [N ii] (K) 13,150 9,600 11,600 11,550 10,250 [O iii] (K) 9,850 11,350 10,700 10,550 10,050 Ionic Abundances He+/H+ 0.096 0.097 0.098 0.098 0.113 He++/H+ 0.001 0.000 0.000 0.000 0.000 O0/H+ (107) 6.2 150 95 44 70 O+/H+ (106) 7.1 110 60 77 O++/H+ (104) 3.7 2.0 2.4 2.6 2.8 N+/H+ (106) 1.3 16 12 6.6 9.9 S+/H+ (108) 7.1 70 41 27 43 Cl++/H+ (108) 6.5 6.6 6.2 6.7 6.0 Ar+3/H+ (107) 2.1 8.7 9.2 10 13 Elemental Abundances He/H 0.097 0.097 0.098 0.098 0.113 O/H (104) 3.7 3.1 3.0 2.6 3.6 N/H (104) 0.67 0.47 0.62 0.46 S/H (104) 0.025 0.059 0.043 0.053 Cl/H (104) 0.0007 0.0007 0.0006 0.0007 0.0006 Ar/H (104) 0.011 0.009 0.012 0.021 0.018
The H fluxes, and measured and intrinsic line intensity ratios of the emission lines detected in the medium-dispersion spectra in regions IS, A-A′, and D-D′ are listed in Table 2. The H to H ratio measured in the medium dispersion spectra and in the HST images imply an extinction coefficient, . The HST H/H ratio map indicates that there are no significant extinction variations across IC 4634. The measured line intensity ratios have been dereddened accordingly using the wavelength-dependent extinction law from Savage & Mathis (1979). The plasma diagnostics ( and ), and ionic and elemental abundances listed in Table 3 were derived from the intrinsic line intensity ratios listed in Tab. 2 for the different regions of IC 4634 using the nebular abundance package ELSA (Johnson et al., 2006).
3.1. The Inner Shells of IC 4634
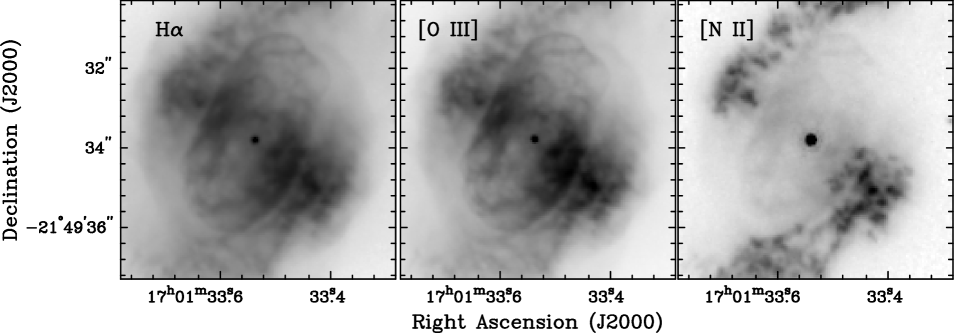
From the center outward, the first component of IC 4634 is the inner shell, IS, around the central star. This inner shell has a size of 2552 and a major axis along PA150∘. The edge of the inner shell is sharp and its surface brightness is enhanced with respect to the shell interior. This morphology suggests a thin shell, although it must be noted that an intricate pattern of filaments is superimposed on the shell. The shell brightness is also notably enhanced along its minor axis, marking a bright equatorial belt. The shape of the inner shell can be roughly described as elliptical (Figure 2), but, at the tips of its major axis, several protrusions of different sizes extend outwards. Further distortion of the shell shape is introduced by the bending of the shell edge at its equator, making the edge of the inner shell along its major axis to show a subtle S-shape. It is worthwhile to note that the central star of IC 4634 is not located at the exact center of the shell, but displaced by 020 towards the South.
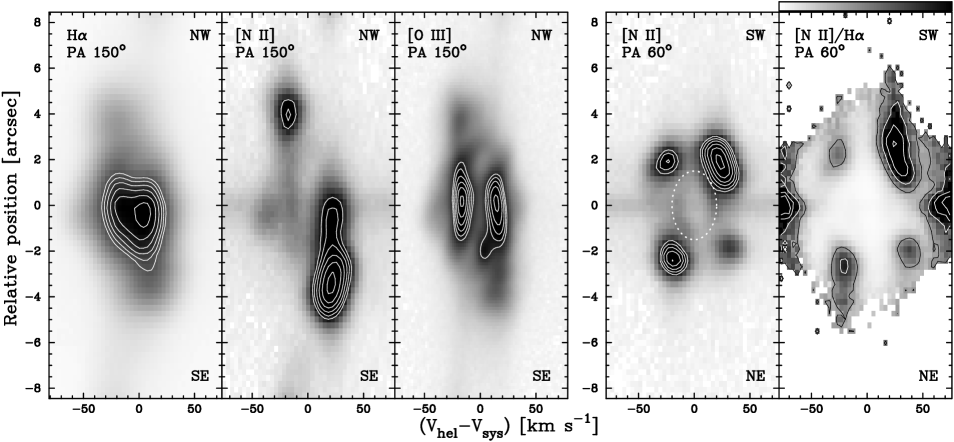
The echellogram of the [O iii] emission line along the major axis of the inner shell at PA 150° (Figure 3) reveals a prolate expanding shell with an expansion velocity at the position of the central star of 15.3 km s-1. The systemic radial velocity in the Local Standard of Rest (LSR) system is –20.1 km s-1, in agreement with other estimates (e.g., Durand et al., 1998). The line tilt is small, indicating a low inclination of the shell with respect to the plane of the sky, but the S-shaped pattern of the line suggests accelerating features at the tips of the shell major axis. These blowout structures correspond to the protrusions observed at the tips of the major axis of the shell, with the Northwest protrusion receding from the observer and the Southeast protrusion approaching. The echellogram of the [N ii] emission line along the major (PA=150∘) and minor (PA=60∘) axes (Fig. 3) also reveal an expanding shell, but its kinematics cannot be studied in detail in this line because the bright emission from the adjacent D-D′ and Dm-Dm′ regions overwhelms the emission from IS. The expansion velocity at the position of the central star is illustrated in the [N ii] echellogram along the minor axis by an ellipse with spatial semi-axis 13 and expansion velocity of 18 km s-1. In the H echellogram along the major axis of IC 4634, also shown in Fig. 3, the thermal broadening of the line is larger than the line split and no shell can be clearly identified.

The inner shell of IC 4634 is the region where the [N ii]/H ratio map (Fig. 1) shows its lowest values, 0.04. The high excitation is confirmed by the [N ii]/H line ratio map presented in Fig. 3 that shows this ratio to be nearly zero in the central regions of IC 4634. The [O iii]/H ratio (Fig. 1) is very flat in this region, with a typical dereddened value of 3.0. This is also the only region where emission lines of He ii are detected in the low-dispersion spectra (Tab. 1), although the intensities of these lines are low with (He ii 4686 Å)/(H) . Besides the [Ar iv] 4715,4740 Å lines, no other high-excitation lines are present in the spectrum of the inner shell of IC 4634. The [Fe iii] 5270 Å emission line and the Wolf-Rayet complex of C iv 5801-12 Å are weakly detected in this spectrum.
The electron density and temperature of the inner shell of IC 4634 can be derived using the density sensitive [S ii] 6716,6731 Å doublet line ratio and the temperature sensitive [N ii] and [O iii] auroral to nebular line ratios. Using the line intensities listed in Tab. 2, we have computed an electron density of 10,600 cm-3 from the [S ii] line ratios, and electron temperatures of 13,000 K from the [N ii] lines and of 10,000 K from the [O iii] lines. These values are consistent with previous estimates of the physical conditions in the central region of IC 4634 (Aller & Czyzak, 1983; de Freitas Pacheco et al., 1992; Hyung et al., 1999) that also find higher electron temperature from the [N ii] lines than from the [O iii] lines. The nebula does not show any evidence of N or He enrichment, thus it can be classified as a type II PN based on its chemical abundances (Peimbert, 1978).
The inner shell of IC 4634 is surrounded by a faint shell of radius 3′′ best seen at PAs –150∘ and –330∘ (Fig. 2), the outer shell OS, as marked in Fig. 1. At other PAs, the low surface brightness of this shell is overwhelmed by the bright D-D′ and Dm-Dm′ features. The visible portion of OS suggests that it is round or, at least, less aspherical than the innermost IS.
3.2. The Inner Point-Symmetric Structure
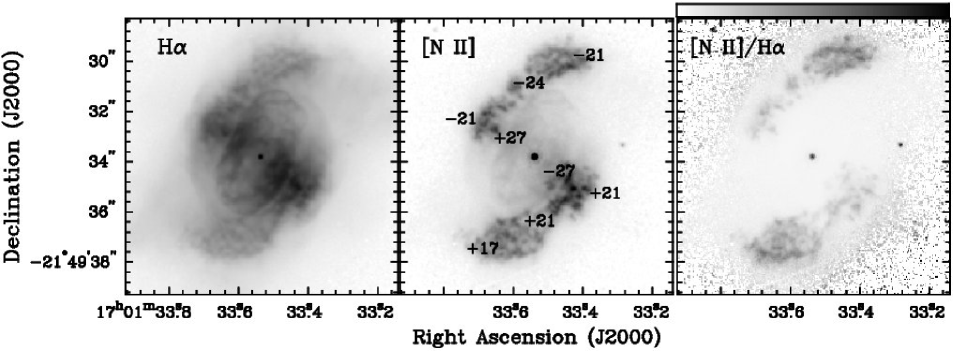
One of the most prominent features in IC 4634 is the pair of low-excitation arcs that we named D-D′ in Fig. 1. A close-up of these features is presented in Figure 4. D-D′ have a point-symmetric morphology, bending around IS in arc-like features that extend from the IS equator, at PA 60∘ (240∘), to the IS tips, at PA 330∘ (150∘). These features do not look like filaments, but rather like broad ( 1′′), clumpy strips, particularly in the [N ii] image. The morphology is reminiscent of the low-excitation polar caps of NGC 6543 (Miranda & Solf, 1992; Balick, 2004) and of the south fuzz of NGC 2392 (O’Dell et al., 2002).
The surface brightness of these structures does not change significantly in the [N ii] line, but there is a clear enhancement of the H and [O iii] emission in the equatorial regions that we denote as Dm-Dm′. To investigate these changes in more detail, we have used the well established [O iii]/H vs. [N ii]/H line diagnostic diagram. To construct this diagram, we have selected the rectangular regions encompassing D-D′ and Dm-Dm′ shown in Figure 5-right and computed the dereddened [O iii]/H and [N ii]/H ratios at every pixel with surface brightness above a threshold value of 3. The resulting values are plotted in the [O iii]/H vs. [N ii]/H diagrams shown in Fig. 5-left. In these diagrams, D and D′ present very similar distributions in their excitation conditions, and the same applies between Dm and Dm′. These show slightly higher [O iii]/H values than D-D′, but very different [N ii]/H distributions, with Dm-Dm′ values lower than 0.15, while D-D′ present values of this ratio up to 0.6. Therefore, there is a notable segregation in the [O iii]/H vs. [N ii]/H plane between D-D′ and Dm-Dm′, indicating different excitation conditions.
The different nature of D-D′ and Dm-Dm′ is further substantiated by their kinematics in the [N ii] echellogram at PA 60∘ (Fig.3). In this echellogram, four distinct compact knots are detected at the location of D-D′ and Dm-Dm′. Of these four knots, the pair of knots located at the same side of the nebula have opposite velocities, i.e., D and Dm have very similar locations, but very different radial velocities, and the same applies to D′ and Dm′. The position-velocity (PV) map of the [N ii]/H ratio (Fig. 3) shows that the brighter two [N II] knots, corresponding to D-D′, have lower excitation, while the two fainter knots show higher excitation and can be identified with Dm-Dm′. Therefore, D and Dm′ are blueshifted, with systemic radial velocities of –21 km s-1 and –27 km s-1, respectively, while D′ and Dm are redshifted, with systemic radial velocities of +21 km s-1 and +27 km s-1, respectively.
The kinematics along D-D′ has been further mapped at PAs 150∘, 166∘ and 180∘. In the corresponding echellograms, D-D′ appear as bright, compact knots with a velocity of 18 km s-1 in the [N ii] 6584 Å line. D is blueshifted and its radial velocity shows little variations along this structure as shown in Fig. 4. D′ is redshifted and shows velocity variations symmetric to those presented by D. It must be noted that these velocities are opposed to the line tilt shown by the inner shell, whose Northwest protrusion is redshifted, while its Southeast tip is blueshifted.
The physical conditions at the tips of D-D′ have been derived using temperature and density sensitive line ratios obtained from the medium dispersion spectroscopy. Using the line intensities listed in Tab. 2, we have computed an electron density of 3,800 cm-3 for D and 5,200 cm-3 for D′, i.e., the density of D-D′ is 2–3 times lower than the density of the inner shell. The [N ii] electron temperature is found to be 11,500 K and 10,200 K for D and D′, respectively. The [O iii] electron temperature is 10,500 K for D and 10,000 K for D′.
3.3. The System of Bow Shock-Like Structures
The system of bow shock-like structures observed at PAs 150∘ (A-A′), 166∘ (B-B′), and 120∘ (C-C′) is one of the most remarkable features of IC 4634. There are very few examples of bow shock structures among PNe (e.g., IC 4593, Corradi et al., 1996). In the following subsections, we describe in further detail the structure, excitation, physical conditions, and kinematics of these features.
3.3.1 Small-Scale Structure
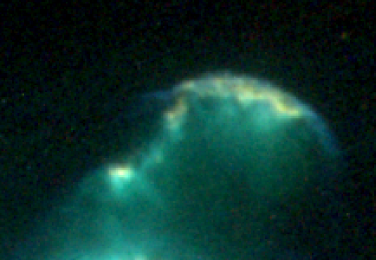
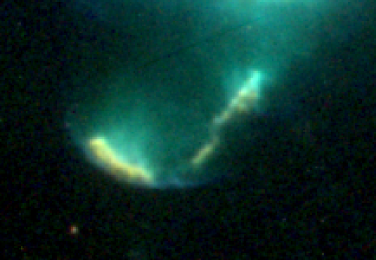
The H, [N ii] and [O iii] composite pictures of A and A′ shown in Figure 6 reveal a wealth of small-scale structures in these features. The bow shock-like feature A lies 10′′ NW of the central star. The counter bow shock (feature A′) is precisely symmetric on the opposite side of the central star (see Fig. 1). A chain of knots extends towards the SE from structure A and towards the NW from structure A′, ending in a smaller sized bow shock labeled B and B′ in the NW and SE, respectively, that lie at 7′′ from IC 4634 central star.
Both in A and A′ there are well-defined bow-shaped structures with sharp edges that emit predominantly in [O iii] (shown in blue in Fig. 6-top). Fainter [O iii], [N ii] and H diffuse emission is observed in the region between the bow shock and the inner nebula. In the brightest regions of A and A′, several knots can be resolved appearing distinct in [N ii] (Fig. 6), but surrounded by diffuse emission in [O iii]. The twisted distribution of these [N ii] knots is indicative of the development of instabilities at this location.
The bow shock structures B and B′ show faint wings that are also more prominent and extended in the [O iii] image. Only one knot, located at the cap of the bow shock structure, is resolved within B. The [O iii] image shows that the spatial distribution of this knot is considerably more extended than the corresponding H and [N ii] intensity peaks. In the emission line images of the counter bow shock B′, three knots are resolved.
C and C′ (Fig. 1) are a pair of low-emissivity features located along an axis at PA 120∘. In the [N ii] image, they show pointed, triangular tips, that are surrounded by round, cap-like structures in the [O iii] and H images. At the outermost skin of these cap-like structures, the [O iii]/H line ratio is enhanced.
3.3.2 Excitation and Physical Conditions
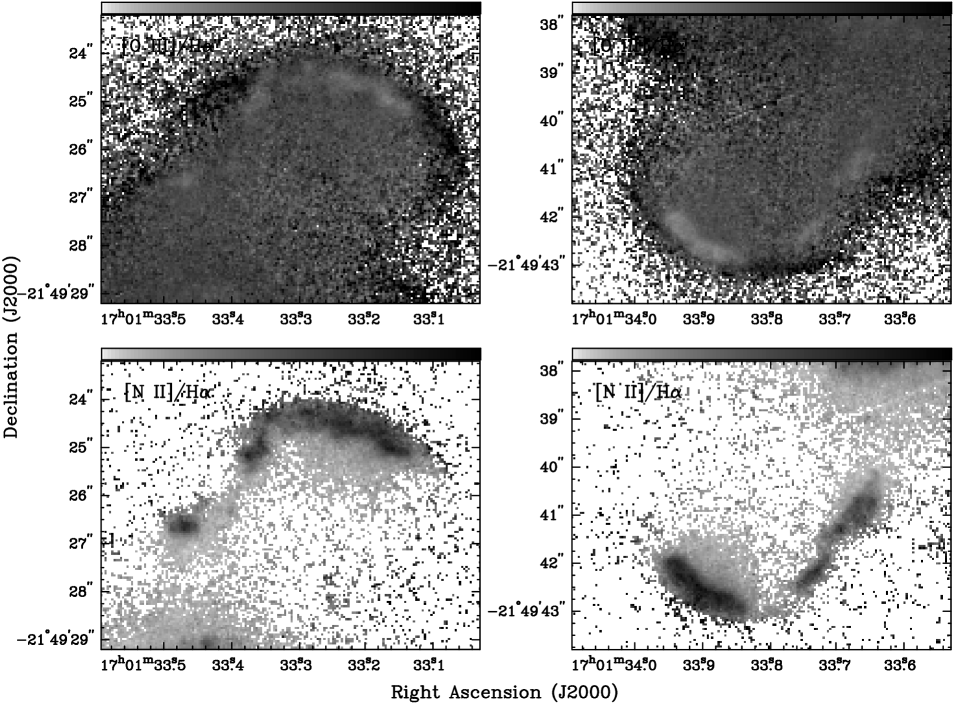
The [O iii]/H and [N ii]/H ratio maps show abrupt changes in these line ratios throughout A-A′, B-B′, and C-C′ (Fig. 6). At the leading edge of the bow shock structures, the [O iii] emission is enhanced, with [O iii]/H values of 2–3. At the brightest regions of A-A′ and B-B′ (i.e., at the emitting knots of the bow shock structure), the [O iii]/H ratio declines to 1–1.5, while the [N ii] emission is enhanced, with [N ii]/H values of 0.8–0.9, significantly raised from the value of 0.05–0.15 behind the bow shock. Similarly, there are abrupt changes in these ratios across the B-B′ features (Fig. 6), with the lowest [O iii]/H ratios and the highest [N ii]/H ratios at the location of the knots (i.e., at the head of the bow shock). The spatial offset between the [O iii] enhanced cap-shaped bow shocks and the low-ionization [N ii] bright knots is 03. We note that the wings at the A-A′ bow shocks show the highest excitation among these structures, with [O iii]/H values of 4, and [N ii]/H values lower than 0.2.
As in §3.2, we have computed the [O iii]/H vs. [N ii]/H diagrams for the different rectangular regions encompassing A-A′, B-B′, and C-C′ shown in Fig. 5-right. In these diagrams, shown in Fig. 5-left, it is noticeable the strong similarity between the distribution of the data points of each structure in the NW and SE regions. Data points from structures A-A′ and B-B′ tend to occupy an extended region in Fig. 5-left, implying large variations in the excitation conditions on small scales. Most points fall in the region of the diagram with [O iii]/H values 2–3 and [N ii]/H 0.05–0.20, corresponding to the gas behind the bow shock. There is a locus in this diagram characterized by low values of [O iii]/H and large values of [N ii]/H, which correspond to the bright emitting knots. On the other hand, there are also points characterized by large values of the [O iii]/H ratio, 3, and very low values of the [N ii]/H ratio; these points correspond to the ”skin” of [O iii] observed at the leading edge of the knots. The excitation of the bow shock-like structures B-B′ is similar to that of A-A′. Most of the data points of B-B′ fall in the region having [O iii]/H in the range 2–3 and [N ii]/H ranging from 0.05 to 0.20. The points with low [O iii]/H values and high [N ii]/H values corresponds to the [N ii] bright knots. Note the presence of several data points with large [O iii]/H values (ranging from 3 to 4), which correspond to the leading edge of the bow shocks.
The data points from features C-C′ occupy a small region in the [O iii]/H vs. [N ii]/H diagram (Fig. 5-right). Most points fall in the region with large [O iii]/H ratio ( 2.25 to 3.5) and low [N ii]/H ratio ( 0.15). Data points corresponding to the outer “skin” of [O iii] show [O iii]/H larger than 3.5. There are noticeable differences between the distribution of the data points of A-A′ and B-B′ in the [O iii]/H vs. [N ii]/H diagram, and this of C-C′. In particular, the data points of C-C′ have a smaller scatter in the [O iii]/H vs. [N ii]/H diagram than those of A-A′ and B-B′, implying small variations in the excitation conditions across C-C′. Moreover, C-C′ have higher excitation than A-A′ and B-B′.

Our ground-based medium-dispersion spectroscopy (Tab. 2) cannot resolve the rapidly changing ionization structure seen in the HST images, but the use of additional line diagnostic diagrams from a variety of emission line ratios can provide further information on the excitation and physical conditions of A-A′. To better compare the overall excitation of A-A′ with that of the inner shell, IS, and D-D′, the line diagnostic diagrams shown in Figure 7 also include emission line ratios from these regions. The spectra of A-A′ show enhanced emission of low-excitation lines: the relative intensities of [O i], [O ii], [N ii], and [S ii] are up to 10 times higher than those in the spectrum of IS, while the relative intensities of [O i], [N ii], and [S ii] are larger than these of D-D′ by a factor of 2. The relative intensity of the [O iii] lines of both A-A′ and D-D′ is only 10–15 lower than these in IS, while the He i and [Ar iii] lines have similar intensities among these different regions, indicating that the radiation field reaching both A-A′ and D-D′, modified by the absorption in the IS, is similar in both cases and capable of ionizing species with ionization potential 30 eV. We have obtained the [O iii]/[O ii] intensity ratio, which is indicative of the ionizing parameter for a photoionized gas, for the three different regions. The largest value (i.e., the largest ionizing parameter) corresponds to the inner shell, as expected, with a value of 250. A-A′ and D-D′ show lower values in the narrow range from 70 to 80, thus indicating that these structures have similar local ionizing conditions (somewhat lower in A-A′). Even though the ionizing parameters are similar in D-D′ and A-A′, the latter shows stronger emission of low excitation lines (see above), indicating shock excitation.
Fig. 7 also reveals the progressive change in the [N ii] and [O iii] temperatures with distance from the central star of IC 4634: the [N ii] 6584/5755 emission line ratio increases (and so the temperature inferred from this line ratio decreases) from IS to A-A′, while the [O iii] 5007/4363 emission line ratio decreases (and so the temperature derived from this line ratio increases) as we move outwards from regions of low [N ii]/H values at IS to regions with larger values of this ratio. The electron temperatures of A and A′ are, respectively, 10,200 K and 12,200 K from the [N ii] lines, and 10,800 K and 11,400 K from the [O iii] lines. Similarly, the electron density from the [S ii] doublet line ratio is found to be 2,800 cm-3 in A and 1,500 cm-3 in A′, i.e., 3–7 times lower than in IS.
3.3.3 Kinematics
The large opening angle of these bow shock-like structures (A and A′ have almost flat morphologies) suggests a low inclination angle with the plane of the sky. This is confirmed by the PV diagrams of the bow shock-like structures A-A′ and B-B′ displayed in Figure 8 that show low radial velocities with respect to the systemic velocity: 20 km s-1 for A-A′, and 3 km s-1 for B-B′. The H and [N ii] 6584 Å echellogram along PA=120∘ (not shown in Fig. 8) shows faint emission from C and C′ moving at radial velocities with respect to the systemic velocity of 30 km s-1. We note that A, B, and C (A′, B′, and C′) are receding from (approaching) us, opposite to the motion of D (D′).
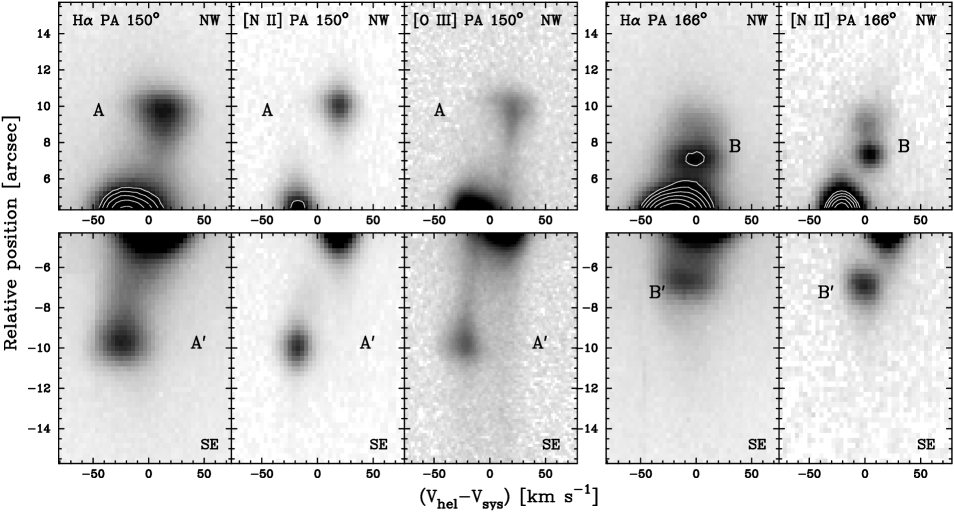
It is also interesting to note the detailed line shape in the PV diagrams of Fig. 8 at A-A′ and B-B′. At the location of A-A′, the H and [O iii] emission lines are wedge-shaped with the widest side at the line tip (the leading edge of the bow shock), while the [N ii] line shape is nearly round. The FWHM of the H emission line of both A-A′ increases from 30 km s-1 at the narrow end of this wedge-shaped feature to 70 km s-1 at its wide end. A close examination of the H and [O iii] 5007 Å PV diagrams reveals a velocity gradient at the leading edge of A-A′, whereas the velocities in the region behind the bow shock seem to be rather constant. The lowest velocities are found at the leading edge of the bow shock, facing away from the central star of IC 4634, where the radial velocity of the H line decreases 10 km s-1 within 1′′. Across B-B′, the radial velocity is roughly constant. The H emission line profiles show a mean FWHM of 40 km s-1. The emission ends in a sharp drop at the outer edge of B-B′.
Finally, the string of [N ii] knots that arises from the edge of the A and A′ bow shocks may be suggestive of a trail of material left in their motion forward. Indeed, the radial velocity in the outer low-ionization arcs shows an abrupt change from the bow shock structure to the linear string of knots, suggesting a deceleration. We will show in that the interaction between a precessing collimated outflow with time-dependent velocity and the surrounding medium offers an alternative explanation to the string of [N ii] knots.
3.4. The [O iii] Skin
It has been mentioned that the [O iii]/H ratio is clearly enhanced in cap-like structures just outside the bow shocks A-A′, B-B′, and C-C′. The [O iii]/H ratio map (Fig. 1-right-center) reveals that these [O iii] enhanced cap-like structures extend on a strip that inscribe the inner regions of IC 4634, like a thin shell or skin of enhanced [O iii] emission. Only the outer envelope (Env) and helical structures (H and Hd) are located outside this skin of enhanced [O iii]/H ratio.
The presence of a skin of enhanced [O iii]/H ratio is rare among PNe; only in NGC 6543 a structure of this kind has been reported (Balick, 2004). In his detailed analysis of narrow-band HST WFPC2 images of NGC 6543, Balick noticed that there is no observational artifact (contamination of [N ii] emission in the H image or incorrect correction for wavelength-dependent geometric distortions in the camera optics), nor ionization effects or local variations of the O/H abundances or the electronic temperature in NGC 6543 able to produce the observed increase of the [O iii]/H ratio at the nebular edge. Observational artifacts can also be dismissed as the origin of the observed morphology in the [O iii]/H ratio map of IC 4634, as the emission in [N ii] is much weaker than in H, as well as a local variation of the O/H abundances which are rather constant throughout the nebula. Emission from the main nebula scattered in the PN outer layers can also be excluded as the [O iii]/H ratio in this skin is significantly different from the ratio value measured in the bright, innermost regions of the nebula. The only plausible cause of the observed enhancement in the [O iii]/H ratio is a local increase of O++/H+ or .
The origin of the skin of enhanced [O iii]/H ratio in NGC 6543 was concluded to be uncertain (Balick, 2004). In IC 4634, this structure is related to the bow shock structures A-A′, B-B′, and C-C′ and, therefore, it can be speculated that it originates in the interaction of fast collimated outflows with the nebular material. The shocks produced by fast collimated outflows would excavate a cavity in the low density nebular envelope and propagate outwards, inducing a marginal increase of the electronic temperature in a forward shock that enhances the [O iii] as also observed in wind-blown bubbles around WR stars (Gruendl et al., 2000). A similar origin can be attributed to such structure in NGC 6543, as suggested by the caps of enhanced [O iii]/H associated with the jet-like features of NGC 6543 (see Figure 2 of Balick 2004).
3.5. The Outer Envelope
The HST images of IC 4634 reveal an envelope of faint emission surrounding its central regions that we have labeled as Env in Fig. 1. This envelope has a patchy appearance, with a distinct arc towards the East, and individual filamentary (F-F′) and arc-like (G) features towards the West. Some of these features are best seen in the [O iii]/H ratio map shown in Fig. 1-right-bottom. Overall, the morphology of the envelope can be classified as elliptical, with its major axis along PA120∘.
Since the envelope is more clearly detected in the H and [O iii] images than in the [N ii] image, it suggests a high excitation. Its surface brightness is low, up to 1,000 lower than that of the inner shell in the H line. If we assume the same electron temperature as in the inner shell, its density can be scaled down from that of the inner shell to 100 cm-3.
Finally, the envelope is detected in the high-dispersion spectra, especially in the echellograms of the H line. Its emission shows a broad, unresolved line with a radial velocity similar to the systemic velocity. This structure seems to be an inert irregularly shaped, low-density outer envelope.
3.6. The Outer Helical Structure
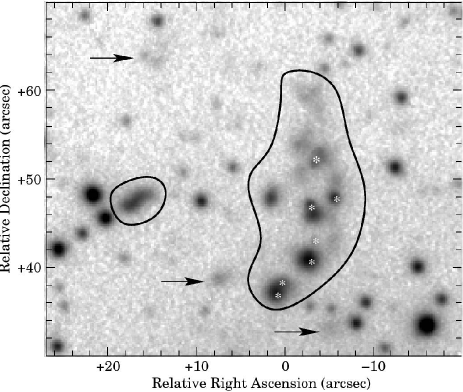
The existence of a distant string of faint knots associated with IC 4634 was first reported by Guerrero et al. (2004). This feature, labeled H and Hd in Fig. 1-right-top, is shown in greater detail in the deep NOT H+[N ii] image presented in Figure 9. In this figure, H and Hd are composed of several knots detected from PA 5∘ to 20∘ at angular distances – from the central star of IC 4634. In the HST images, the knots in the structure H are resolved into compact cores surrounded by clumpy emission or show the appearance of a string of knots. Morphologically, component H forms an arc-like string of knots whose orientation is different from that of the major nebular axis, but similar to this of components B-B′ and D-D′. Component Hd consists of several faint diffuse knots, including a large ( 25′′) corkscrew-shaped structure oriented along the South-North direction. We have obtained deep narrow-band images to search for a possible Southern counterpart of H and Hd, but our search has yielded negative results.
The H and [N ii] emission from H and Hd is detected in the high-dispersion spectroscopic observations. The emission lines can be fit with a single Gaussian profile with of 25 km s-1 in the H line and 20 km s-1 in the [N ii] 6584 line. The systemic radial velocity derived from these lines is very similar to the nebula systemic radial velocity.
4. A Precessing Collimated Outflow in IC 4634
4.1. Observational Evidence and Similarities with Herbig-Haro Objects
The morphology of the bow-shaped features A-A′, B-B′, and C-C′ resembles that of Herbig-Haro (HH) jets. These jets are morphologically characterized by chains of aligned knots with bow shock-like appearance, and a leading bow shock, the “head” of the jet, where the supersonic flow slams into the surrounding material. Observations of the knots of HH jets have been interpreted by several authors as the result of time-dependent variations in the velocity of the flow (see, e.g., Raga et al., 1990). Such a jet model with variable ejection velocity has been shown to reproduce the overall morphology and kinematical properties of the high-velocity jets of the proto-planetary nebula Hen 3-1475 (Velázquez, Riera & Raga, 2004). The bow shock structure of A-A′, B-B′, and C-C′ is consistent with those features being the result of a jet, ejected with variable velocity, interacting with the AGB remnant.
The suggestion drawn from the morphology of IC 4634 is reinforced by the kinematics of A-A′. Its H and [O iii] PV diagrams clearly show a wedge-shaped feature analogous to those observed in several HH objects (e.g., Böhm & Solf, 1985). A wedge-shaped feature in the PV diagram is expected for a bow shock moving nearly on the plane of the sky, as predicted by the traditional “3/2”-dimension bow shock model which is a reasonable approximation to the leading bow shock of an HH jet (Raga & Böhm, 1985, 1986; Hartigan et al., 1987). In such case, the radial velocity dispersion increases suddenly at the stagnation point of the bow shock, producing a line broadening that looks like an horizontal edge in the PV diagram. The amount of broadening of the emission line profiles can be related to the velocity of the bow shock (Hartigan et al., 1987). In the case of A-A′, the observed width of the line would indicate a bow shock velocity of 100 km s-1. We conclude that the PV diagrams of A-A′ are, at least qualitatively, compatible with the predictions of a leading bow shock (i.e., the “head” of a jet) nearly on the plane of the sky.
Further support for this scenario is provided by the spectral properties of A-A′. The dereddened emission line ratios in these regions with intense emission in low-ionization lines are reminiscent of shock-excited nebula such as HH objects. While shocks might be collisionally exciting the low ionization emission lines of A-A′, a detailed comparison of the observed emission line ratios with spectra predicted by photoionized shock models (e.g., Dopita, 1997) is not straightforward, since the bow shocks in IC 4634 are illuminated by the stellar ionizing flux from the post-shock direction. A more realistic comparison is enabled by the axisymmetric numerical simulations of a shocked, dense cloudlet moving away from a source of ionizing photons through a uniform and photoionized environment that have been recently obtained by Riera & Raga (2007) and Raga et al. (2007). These simulations not only produce synthetic spectra that are qualitatively consistent with the spectra of A-A′, but also reproduce the ionization stratification of A-A′, with the gas in the downstream region being more highly ionized than the outward-facing edge and the [O iii] emission showing a larger extension towards the photoionizing source.
It is thus tempting to interprept the point-symmetry morphology of IC 4634 as the result of moderate velocity jets with a time-dependent ejection velocity. Furthermore, the point-symmetric morphology of IC 4634, which gives its S-shaped appearance to the nebula, and the varying sign of the radial velocity are commonly interpreted as the direct result of a time-dependent direction of ejection of the source. In the next section, we explore into further detail this supposition that can, in general, be of interest to other point-symmetric PNe (Cliffe et al., 1995; Lee & Sahai, 2003; García-Arredondo & Frank, 2004; Velázquez, Riera & Raga, 2004; Soker & Bisker, 2006).
4.2. Modeling a Precessing Collimated Outflow in IC 4634
4.2.1 Initial Conditions and Numerical Methods
The morphology and kinematics derived for IC 4634 place important constrains and clues on some of the parameters describing the motion of such a precessing outflow. The bow shock morphology of A-A′, and the spatial distribution of the [O iii] and H emission, preceding the [N ii] emission, reveals shock excitation. The observed radial velocities are low, suggesting that the angle between the precession axis and the plane of the sky, the inclination angle , is small. We will thus assume that the precession axis is on the plane of the sky. Finally, the semi-angle of the aperture of the precession cone, , can be derived by measuring the angle subtended by A and B with respect to the central star. This angle is estimated to be 11°.
Numerical simulations were carried out with the 3D code Yguazú-a (Raga, Navarro-González, & Villagran-Muniz, 2000; Raga et al., 2002), using a 5-level binary adaptive grid. The dimensions of the computational domain are 2.21017 cm, in the x- and y-directions, and 4.41017 cm in the z-direction, i.e., 63127 at a distance of 2.3 kpc, with a maximum resolution of 8.61014 cm, i.e., 0025. This code integrates the gas-dynamic equations by using the ”flux vector splitting” scheme of Van Leer (1982). Together with the gas-dynamic equations, several rate equations for the atomic/ionic species are also integrated. These species are: H i, H ii, He i, He ii, He iii, C ii, C iii, C iv, N i, N ii, N iii, O i, O ii, O iii, O iv, S ii, and S iii (see details about the reaction and the cooling rates in Raga et al., 2002). These rate equations enable the computation of a non-equilibrium function for the radiative losses. Given a set of initial conditions for the jet and surrounding circumstellar medium (CSM), Yguazú-a determines the temperature and density distributions at a given time. The temperature and density distributions allow us to compute the emission line coefficients of the H, [N ii] 6584, and [O iii] 5007 emission lines. The intensity of the H line is computed considering the contributions from the recombination cascade and from collisional excitations. The intensity of the forbidden lines [N ii] 6584 and [O iii] 5007 are calculated by solving 5-level atom problems, using the parameters of Mendoza (1983). These intensities can be integrated along the line of sight to produce synthetic emission maps and PV diagrams for a wide slit covering completely the working surfaces.
A jet of number density is injected in the base of the computational domain () at position (1.11017 cm, 1.11017 cm) in the -plane, with a radius and length of 2.61015 cm and 4.31015 cm, respectively. The jet density is assumed to be 104 cm-3. The jet velocity is modeled by the relationship:
| (1) |
where is the mean velocity, is the amplitude of the velocity variation, is the time, and is the period of the velocity variation. The symmetry axis of this jet precesses with period .
The surrounding CSM has been assumed to be produced by an AGB wind of constant mass-loss rate, , and expansion velocity, . The dependence of the density of such medium with the radial distance to the central star, , is given by:
| (2) |
where the density, , at radius is determined by the mass loss-rate and expansion velocity of the AGB wind as . In our simulations, the mass-loss rate and expansion velocity of the AGB wind were assumed to be yr-1 and 20 km s-1, respectively. The temperature of the CSM has been set to 100 K.
4.2.2 Results of the Numerical Simulations
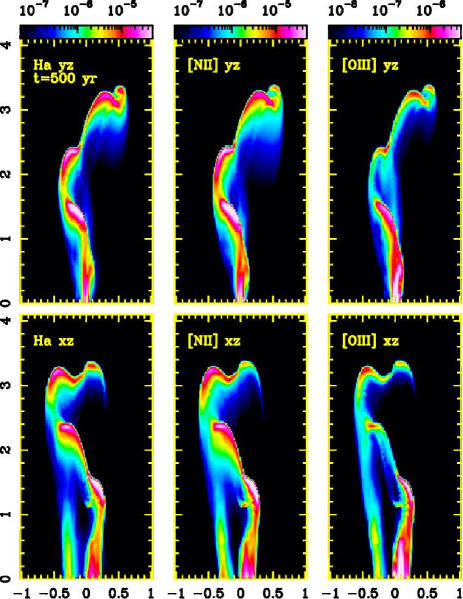
Several numerical simulations were carried out varying , , , and , to produce synthetic emission maps and PV diagrams that can be directly compared to the observed images and long-slit echellograms of A-A′, B-B′, and D-D′. There is a qualitative agreement between the synthetic and observed images and PV diagrams for =300 km s-1, =25 km s-1, =460 yr, and =110 yr (Figures 10 and 11). The jet expansion velocity implies a jet mass-loss rate of 210 yr-1.
Fig. 10 displays the H, [N ii], and [O iii] simulated emission maps obtained for a calculation time of 500 yr. At this time, the jet structure achieves a length of 3.31017 cm, which corresponds to an angular size of 98 at a distance to IC 4634 of 2.3 kpc. The upper panels correspond to the -projection (i.e., the line of sight is along the -axis), while the bottom panels represent the -projection (i.e., the line of sight is along the -axis), basically meaning the initial direction along which the jet is emitted. Several working surfaces are observed in these maps at distances of 1.41017 cm, 2.41017 cm, and 3.31017 cm, which are produced by the variability of the jet velocity, when slow gas is swept up by fast material. The observed morphology and spatial distribution of A-A′ and B-B′ are more closely reproduced by the -projection than by the -projection. We notice that the spatial separation seen at the head of the A-A′ features between the H and [O iii] emissions are not reproduced by the synthetic emission maps because the spatial structure of the region behind the shock, where the [O iii] emission arises mainly, is poorly resolved in our simulations.
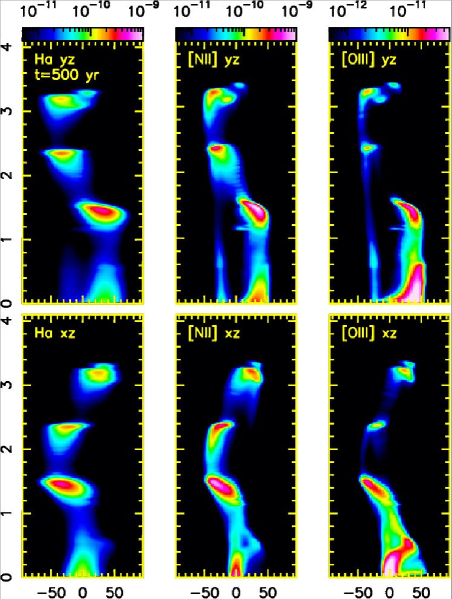
Fig. 11 displays the H, [N ii], and [O iii] simulated PV diagrams obtained at the same calculation time as Fig. 10. The centroids of the working surfaces in these PV diagrams do not show exactly the alternate positive and negative velocities observed in A-A′ and B-B′, although they display similar sinusoidal variations with respect to the systemic velocity. This indicates that the initial direction along which the jet is emitted is not coincident with neither the - and -projections, or that the inclination angle differs from the one that has been assumed. On the other hand, a close examination of the PV diagrams in Fig. 11 reveals a good agreement with the detailed kinematics of the working surfaces: the velocity widths or of the synthetic emission lines are comparable to the observed ones, with larger values of the for the H line, and the wedge-shaped tips of the H and [O iii] emission line profiles of A-A′ are also well reproduced.
5. Discussion
5.1. Multiple Shaping Agents in IC 4634
The data presented in the previous sections reaffirm the known complexity of IC 4634. The nebula is composed of a series of morphological components that clearly reveal the action of different shaping agents. Among the prevalent shaping mechanisms in IC 4634, we shall consider the interaction of the current fast stellar wind with the slow AGB wind, the ionizing flux of photons from its central star, and a series of fast collimated outflows. We discuss below the effects that the fast stellar wind and fast collimated outflows have had in the shaping of IC 4634.
IUE observations of the central star of IC 4634 uncovered prominent P Cygni profiles in the C iii, C iv, N v, and O v lines superposed on the stellar continuum. These P Cygni profiles manifest the presence of a fast stellar wind whose terminal velocity has been derived to be 3,500–4,000 km s-1 (Hyung et al., 1999). This fast stellar wind has excavated a central cavity within the nebula, compressing the nebular material into a thin shell. This thin shell and the central cavity can be identified with the inner shell IS, while the nebular envelope can be associated with the faint shell OS surrounding this inner shell. In this respect, the double-shell morphology of the inner regions of IC 4634 compares well with other PNe (e.g., NGC 6826).
The bow shock morphology and spatial distribution of A-A′, B-B′, and C-C′ are highly indicative of the interaction of precessing collimated outflows with surrounding material. Indeed, the detailed morphology and kinematics of A-A′ and B-B′ are successfully reproduced assuming the interaction of a precessing jet with a time-dependent velocity in the range of 300 km s-1 and a precession period 460 yrs. This jet is interacting with material in the outer regions of IC 4634 that forms the envelope, Env, a region of rough elliptical symmetry that may represent an episode of major mass loss prior to the one that formed IC 4634 inner regions. In their interaction, the collimated outflows generate bow-shocks structures and drive a forward shock that produces a high excitation skin.
One of the new nebular components revealed in this work is the outermost features H and Hd. The location of H and Hd with respect to IC 4634 and their similar radial velocities make it unlikely that these components are unrelated to the nebula. The morphology of the H feature, composed of a series of knots distributed along an arc-like structure, can be interpreted as a loop on the surface of an imaginary cone whose vertex is coincident with the central star of IC 4634. Therefore, H and Hd may correspond to an ancient precessing ejection. It is worth emphasizing that the precession axis of this ancient ejection would be almost orthogonal to the axis of the precessing ejection that has been considered for A-A′ and B-B′.
There are, thus, clear signs that IC 4634 innermost shell, IS, and the envelope, Env, formed by the action of the current fast stellar wind on material associated to episodes of mildly asymmetric mass loss produced during the late AGB, while the bow shock structures A-A′, B-B′, and C-C′, and the arc-like features H and Hd have been produced by the action of fast, precessing collimated outflows. These collimated outflows may have also played some role in the shaping of the innermost regions of IC 4634, although the evidence is not overwhelming. The inner shell of IC 4634, IS, is elongated and shows morphological and kinematical signs of blowout along its tips. While the origin of the asymmetry of IS can be attributed to a density enhancement in the equator of the nebular envelope as suggested by the bright emission in the surrounding material along the minor axis in the H and [O iii] images, it is worthwhile noting that the orientation and inclination of the collimated outflows associated with A-A′ are coincident with those of the blowout along the tips of the inner shell. Therefore, it is possible that the collimated outflows responsible of A-A′ may have been involved in the emergence of the blowout structures of IS and in the development of the axisymmetry of this shell. This may also be the case of the inner shells of several PNe with collimated outflows (e.g., NGC 6210 and NGC 6884) that also show the mild point-symmetry exhibited by the inner shell of IC 4634.
Similarly, the origin of the D-D′ features may be associated with the action of collimated outflows. The kinematics and morphology of D-D′ are very similar to those of the low-ionization polar caps described in NGC 6543 (Miranda & Solf, 1992; Balick, 2004), although these structures may have different inclinations. A thorough discussion of the possible origins of knots and low-ionization structures in PNe is provided by O’Dell et al. (2002). As in NGC 6543, the D-D′ arcs of IC 4634 can be interpreted as intrusions of low-ionization, high-density knots that are expanding with the shell that surrounds its inner shell (Balick & Hajian, 2004). These features may represent the relic of the interaction of a collimated outflow with the nebular envelope. On the other hand, Dm-Dm′, that has higher excitation than D-D′, and that are separated from these in the velocity space, can be related to the density enhancement around the equatorial region of IS.
5.2. Bow Shocks in Planetary Nebulae
PNe display a large variety of low-ionization structures of which fast collimated outflows deserve special attention because of their outstanding kinematical properties (e.g., Gonçalves, Corradi, & Mampaso, 2001). The origin and nature of the fast collimated outflows seen in PNe has been disputed, but the morphological, kinematical, and physical properties of some of them seem to be suggestive of high-density bullets moving supersonically through the nebular material (Balick et al., 1994). If this were the case, the interaction of the PN fast collimated outflows with the nebular material should lead to the formation of bow shocks whose morphologies would share some similarities with these of HH objects. Bow shocks would then be expected to be common among PNe with fast collimated outflows; the number of bow shocks identified in PNe, however, is small. In IC 4634, we find one of the rare cases of bow shocks in PNe. The detailed morphology and kinematics of the bow shock structures A-A′ and B-B′ of IC 4634 can be unambiguously ascribed to a precessing fast collimated outflow, and the morphology and ionization of the bow shock structures C-C′ are reminiscent of the interaction of a fast, dense bullet with the nebular material. In view of these findings, it is worthwhile to revisit other cases of bow shocks in PNe.
So far, the best studied case of a bow shock in a PN is that of IC 4593 (Corradi et al., 1996). In this nebula, we find several systems of knots and inward facing tails that have been interpreted as multiple collimated outflows propagating along different directions. These knots are preceded by outward facing caps with bow shock morphologies. The bow shock structures in IC 4593 share many similarities with those of IC 4634. Both have low radial velocities, show a decrease in the observed radial velocity and the broadening of the emission profile, and display caps of enhanced [O iii] emission as expected in bow shock models. All these properties suggest the motion of medium velocity jets near the plane of the sky that are interacting with the surrounding material.
The ansae of NGC 7009 are another promising example of fast, dense bullets ramming through the outer shells of the nebula. This interpretation was questioned as the ionization state of the gas declines at the head of the bow shock (Balick et al., 1998), while the opposite is expected in bow shocks (Hartigan et al., 1987). However, the observed ionization gradient can be reproduced by the numerical simulations of a shocked cloudlet moving away from the central star if the stellar ionizing photon flux, which modifies the ionization and excitation structure of the shock, is included (Riera & Raga, 2007; Raga et al., 2007). In their study of IC 4593 bow shocks, Corradi et al. (1996) noted that the ionizing flux from the central star can play a predominant role in the ionization stratification of bow shocks in PNe. At any rate, an examination of a deep HST WFPC2 [O iii]/H ratio map of NGC 7009 reveals that the ansae of NGC 7009 are preceded by caps of enhanced [O iii] as expected in bow shocks (Medina et al., 2007; Guerrero et al., 2008).
Besides IC 4593, IC 4634, and NGC 7009, there are very few other cases of bow shock associated with PNe. The [O iii]/H ratio image of NGC 6543 (Balick, 2004) shows a bow shock structure enveloping the precessing-like collimated outflows along the polar directions of this nebula (Miranda & Solf, 1992), although this structure is not discussed in detail. A bow shock structure has also been described in NGC 6572, although the limited spatial resolution of ground-based images do not allow the authors to study the ionization stratification at the bow shock (Miranda et al., 1999). A comprehensive investigation of the occurrence of bow shocks associated with the expansion of fast collimated outflows or bullets in PNe is in progress (Guerrero et al., 2008).
6. Summary
Our spatio-kinematical study of IC 4634 has revealed new structural components in this nebula, including what seems to be the relic of ancient precessing collimated ejections, a triple shell morphology, and a thin skin of enhanced [O iii]/H enveloping the nebula and the bow shock structures at the tip of the collimated outflows. Furthermore, the HST images and ground-based echelle spectroscopy provide a detailed view of the physical structure of the bow shock associated with a collimated outflow in a PN. Their morphology and kinematics have been successfully modeled using hydro-dynamical simulations in which a precessing fast collimated outflow interacts with nebular material.
IC 4634 seems to have experienced a series of mildly asymmetric mass loss episodes that have removed the stellar envelope, yielding to the current fast stellar wind. These periods of mass loss are interspersed with two episodic ejections of collimated outflows that have interacted with the nebular material, having important consequences in the shaping of IC 4634. The most recent episode of ejection of collimated outflows is directly responsible of the formation of the bow shock structures A-A′, B-B′, and C-C′ within the envelope, and has played a significant role in the asymmetry and orientation of the inner shell. The probable interaction of this collimated outflow with circumstellar material might be linked to the formation of D-D′. Finally, the oldest episode of ejection of collimated outflows formed H and Hd in the outermost regions. The two ejections of collimated outflows took place at different times during the PN formation. The large misalignment between the ejection axes of the collimated outflows giving raise to A-A′, B-B′, and C-C′, on one hand, and H and Hd, on the other, imply that the collimating source had experienced important changes between the ejections.
References
- Aller & Czyzak (1983) Aller, L. H., & Czyzak, S. J. 1983, ApJS, 51, 211
- Balick (1987) Balick, B. 1987, AJ, 94, 671
- Balick (2004) Balick, B. 2004, AJ, 127, 2262
- Balick et al. (1998) Balick, B., Alexander, J., Hajian, A. R., Terzian, Y., Perinotto, M., & Patriarchi, P. 1998, AJ, 116, 360
- Balick & Hajian (2004) Balick, B., & Hajian, A. R. 2004, AJ, 127, 2269
- Balick et al. (1994) Balick, B., Perinotto, M., Maccioni, A., Terzian, Y., & Hajian, A. R. 1994, ApJ, 424, 800
- Böhm & Solf (1985) Böhm, K.-H. & Solf, J. 1985, ApJ, 294, 533
- Cliffe et al. (1995) Cliffe, J. A., Frank, A., Livio, M., & Jones, T. W. 1995, ApJ, 447, L49
- Corradi et al. (1996) Corradi, R. L. M., Guerrero, M. A., Manchado, A., & Mampaso, A. 1996, New Astr, 2, 461
- de Freitas Pacheco et al. (1992) de Freitas Pacheco, J. A., Maciel, W. J., & Costa, R. D. D. 1992, A&A, 261, 579
- Dopita (1997) Dopita, M. A. 1997, ApJ, 485, L41
- Durand et al. (1998) Durand, S., Acker, A., & Zijlstra, A. 1998, A&AS, 132, 13
- Fernández, Monteiro, & Schwarz (2004) Fernández, R., Monteiro, H., & Schwarz, H. E. 2004, ApJ, 603, 595
- García-Arredondo & Frank (2004) García-Arredondo, F., & Frank, A. 2004, ApJ, 600, 992
- García-Segura & López (2000) García-Segura, G., & López, J. A. 2000, ApJ, 544, 336
- Gonçalves, Corradi, & Mampaso (2001) Gonçalves, D.R., Corradi, R.L.M., & Mampaso, A. 2001, ApJ, 547, 302
- Gruendl et al. (2000) Gruendl, R. A., Chu, Y.-H., Dunne, B. C., & Points, S. D. 2000, AJ, 120, 2670
- Guerrero et al. (2008) Guerrero, M.A., Medina, J.J., Luridiana, V., Miranda, L.F., Riera, A., & Velázquez, P.F. 2008, in preparation
- Guerrero et al. (2004) Guerrero, M. A., Miranda, L. F., & Chu, Y.-H. 2004, Asymmetrical Planetary Nebulae III: Winds, Structure and the Thunderbird, 313, 30
- Hajian et al. (1997) Hajian, A. R., Balick, B., Terzian, Y., & Perinotto, M. 1997, ApJ, 487, 304
- Hartigan et al. (1987) Hartigan, P., Raymond, J. & Hartmann, L. 1987, ApJ, 316, 323
- Hyung et al. (1999) Hyung, S., Aller, L. H., & Feibelman, W. A. 1999, ApJ, 525, 294
- Johnson et al. (2006) Johnson, M. D., Levitt, J. S., Henry, R. B. C., & Kwitter, K. B. 2006, Planetary Nebulae in our Galaxy and Beyond, 234, 439
- Kwok et al. (1978) Kwok, S., Purton, C. R., & Fitzgerald, P. M. 1978, ApJ, 219, L125
- Lee & Sahai (2003) Lee, C.-F., & Sahai, R. 2003, ApJ, 586, 319
- McKeith et al. (1993) McKeith, C. D., García-López, R. J., Rebolo, R., Barnett, E. W., Beckman, J. E., Martín, E. L., & Trapero, J. 1993, A&A, 273, 331
- Medina et al. (2007) Medina, J.J., Guerrero, M.A., Luridiana, V., Miranda, L.F., Riera, A., & Velázque, P.F. 2007, proceedings of the Asymmetrical Planetary Nebulae IV Conference, eds. R.L.M. Corradi, A. Manchado and N. Soker, in press
- Mendoza (1983) Mendoza, C. 1983, in Planetary Nebulae, IAU Symp., 103, 143
- Miranda, Guerrero, & Torrelles (1999) Miranda, L. F., Guerrero, M. A., & Torrelles, J. M. 1999, AJ, 117, 1421
- Miranda & Solf (1992) Miranda, L. F., & Solf, J. 1992, A&A, 260, 397
- Miranda et al. (1999) Miranda, L. F., Vázquez, R., Corradi, R.L.M., Guerrero, M. A., López, J.A., & Torrelles, J. M. 1999, ApJ, 520, 714
- O’Dell et al. (2002) O’Dell, C. R., Balick, B., Hajian, A. R., Henney, W. J., & Burkert, A. 2002, AJ, 123, 3329
- Patriarchi & Perinotto (1991) Patriarchi, P., & Perinotto, M. 1991, A&AS, 91, 325
- Peimbert (1978) Peimbert, M. 1978, IAU Symp. 76: Planetary Nebulae, 76, 215
- Perinotto et al. (2004) Perinotto, M., Patriarchi, P., Balick, B., & Corradi, R. L. M. 2004, A&A, 422, 963
- Raga et al. (1990) Raga, A. C., Binette, L., Canto, J., & Calvet, N. 1990, ApJ, 364, 601
- Raga & Böhm (1985) Raga, A.C. & Böhm, K.-H. 1985, ApJS, 58, 201
- Raga & Böhm (1986) Raga, A.C. & Böhm, K.-H. 1986, ApJ, 308, 829
- Raga et al. (2002) Raga, A.C., de Gouveia Dal Pino, E.M., Noriega-Crespo, A., Mininni, P.D., & Velázquez, P.F. 2002, A&A, 392, 267
- Raga, Navarro-González, & Villagran-Muniz (2000) Raga, A.C., Navarro-González, R., & Villagran-Muniz, M. 2000, Revista Mexicana de Astr. y Astrof., 36, 67
- Raga et al. (2007) Raga, A.C., Riera, A., Mellema, G., Esquivel, A. & Velázquez, P.F. 2007, A&A(submitted)
- Riera & Raga (2007) Riera, A. & Raga, A.C. 2007, proceedings of the Asymmetrical Planetary Nebulae IV Conference, eds. R.L.M. Corradi, A. Manchado and N. Soker, in press
- Rijkhorst, Mellema, & Icke (2005) Rijkhorst, E.-J., Mellema, G., & Icke, V. 2005, A&A, 444, 849
- Sahai (2000) Sahai, R. 2000, ApJ, 537, L43
- Savage & Mathis (1979) Savage, B.D., & Mathis, J.S. 1979, ARA&A, 17, 23
- Schwarz (1993) Schwarz, H. E. 1993, Mass Loss on the AGB and Beyond, Second ESO/CTIO Workshop, eds. H. E. Schwarz (ESO; Garching), 223
- Soker & Bisker (2006) Soker, N., & Bisker, G. 2006, MNRAS, 369, 1115
- Stanghellini, Corradi, & Schwarz (1993) Stanghellini, L., Corradi, R. L. M., & Schwarz, H. E. 1993, A&A, 279, 521
- Toledano et al. (2003) Toledano, O., Riesgo-Tirado, H., López, J. A., Meaburn, J., Bryce, M., & Holloway, A. J. 2003, IAU Symposium, 209, 543
- Van Leer (1982) Van Leer, B. 1982, ICASE Report Nos. 82-30
- Velázquez, Riera & Raga (2004) Velázquez, P. F., Riera, A. & Raga, A. C. 2004, A&A, 419, 991