A large-scale optical-near infrared survey for brown dwarfs and very low-mass stars in the Orion OB1 association
Abstract
We report the initial results of a large-scale optical-near infrared survey to extend the known young population of the entire Orion star-forming region down to the substellar domain. Using deep optical I-band photometry and data from the 2MASS survey, we selected candidates across in the Myr old Ori OB1a subassociation and over in the Ori OB1b subassociation (age Myr), with completeness down to and respectively. We obtained low resolution optical spectra for a subsample of 4 candidates in Ori OB1a and 26 in Ori OB1b; as a result we confirmed 3 new members in Ori OB1a, one of which is substellar, and 19 new members in Ori OB1b, out of which 7 are at the substellar limit and 5 are substellar. We looked into the presence of accretion signatures by measuring the strength of the H line in emission. Accordingly, we classified the new members as having Classical T-Tauri star (CTTS) or Weak Lined T Tauri star-like (WTTS) nature. We found that all the new members confirmed in Ori OB1a are WTTSs, while of the new members in Ori OB1b exhibit CTTS-like behavior, suggestive of ongoing accretion from a circum(sub)stellar disk. Additionally we found that none of the members confirmed in OB1a show near-IR color excess while of OB1b members show H-K color excess. These results are consistent with recent findings for low mass young stars in Orion OB1. The similarity in CTTS-like properties and near-IR excess across the substellar boundary gives support to the idea of a common formation mechanism for low mass stars and at least the most massive brown dwarfs. Finally, we remark the discovery of two new members classified as CTTSs, both exhibiting Å, suggesting significant ongoing accretion.
1 Introduction
One of the main goals of contemporary astrophysics is understanding the processes of star and planet formation. In this context, the formation of the least massive stars and brown dwarfs is a key issue. Because brown dwarfs (BDs) are objects with masses intermediate between those of stars and planets (; Baraffe et al., 1998; Oppenheimer et al., 1998), understanding how they form can provide important links between the origin of stars and planetary bodies.
Current observational efforts seek to establish to what extent there is a continuity of the star formation process across the substellar limit (; Baraffe et al., 1998), and wether the properties of the resulting (sub)stellar populations depend on aspects like the surrounding environment. Observational evidence shows that for some very young populations the kinematic and spatial distributions of very low-mass stars (VLMSs) and BDs are similar, that there is continuity of the initial mass function between VLMSs and BDs with masses down to (Luhman et al., 2007), and that BDs accrete from circum-substellar disks, much like low-mass stars do (e.g. Jayawardhana et al., 2002; Muzerolle et al., 2005). These results suggest that the low mass star formation process extends across and below the substellar limit. However, these findings are based on observations of regions with ages between and Myr (Taurus, IC348, Trapezium and Chameleon I), much younger than the Myr time span in which giant planets are expected to form (Calvet et al., 2005). Also, these studies do not offer clear evidence on the dependency (if any) of the formation processes with the environment, because they compare different regions which do not share a common origin.
An important and required next step is the detection, minimizing spatial biases, of stellar and substellar pre-main sequence populations in star forming regions that show a variety of environmental conditions, span an age range from Myr, and ideally share the same “genetic” pool. Such samples can offer new insights into the formation and evolution of BDs: a) The time dependence of indicators of disks and of disk accretion, over a span of 10 Myr, will offer the best view yet of how disks evolve, under a diversity of environments and at both sides of the substellar limit. b) The space distribution and kinematics of these populations will provide important constraints to the formation models, e.g. the dynamical ejection scenario (Reipurth & Clarke, 2001), which suggests that BDs are stellar embryos ejected from their birth places as a consequence of dynamical interactions during the early stages of their formation, resulting in them being deprived from gaining mass from the surrounding gas.
The Orion star forming region meets all these requirements. It is a relatively nearby OB association ( 400 pc; Briceño et al. (2005)), representative of the birthplace for the majority of stars in our Galaxy (Briceño et al., 2007a), containing regions with ages Myr and differing ambient conditions (Genzel & Stutzki, 1989; Briceño et al., 2005). There is also a molecular cloud complex (Maddalena et al., 1986), in which the youngest star populations are embedded, that shares the same kinematics as the older stars (Briceño et al., 2007b), suggesting that the stellar populations at various ages share a common origin. Throughout the whole region there is now a significant number of confirmed pre-main sequence stellar members (Briceño et al., 2005, 2007b); however, substellar objects have only been confirmed so far in the younger, densest regions with small spatial extent, such as the Ori cluster (e.g. Béjar et al., 1999, 2001; Barrado y Navascués et al., 2003a; Caballero et al., 2004; Sherry et al., 2004; Kenyon et al., 2005; González-García et al., 2006) or the Orion Nebula Cluster (Hillenbrand & Carpenter, 2000; Preibisch et al., 2005; Slesnick et al., 2005). In order to look for the faintest, lowest mass members widely distributed across the Orion OB1 association, down to and beyond the substellar limit, we are conducting a large-scale optical-infrared search for BDs that spans 180 over the entire region. Our strategy is to combine deep, coadded, -band and -band data from our optical photometry obtained with the QUEST I CCD Mosaic Camera at Venezuela (Briceño et al., 2005), with near infrared measurements from the Two Micron All Sky Survey (2MASS) to select objects, which we call candidates, whose photometric magnitudes and colors are consistent with those of BDs and VLMSs. We then obtain follow-up spectra to confirm membership and establish their stellar or substellar status. Finally, we characterize objects in terms of spectroscopic signatures such as strong emission, which we use as a proxy for ongoing disk accretion.
In this work we present initial results in this effort to extend the known young population of the entire Orion star-forming region throughout the substellar limit. We selected optical/near infrared candidates within an area of 21 , encompassing part of the Orion OB1a and most of the Orion OB1b subassociations. We conducted spectroscopic follow-up of candidates in an area of 0.8 in OB1a, and 2.5 in OB1b. The optical photometric observations are described in section 2. Candidate selection was done by defining regions in optical/near-IR color-magnitude and color-color diagrams, as explained in section 3. Section 4 shows the results of the spectroscopic observations and spectral classification of a first sample of candidates, covering 3.3 . The criteria followed to establish membership and the stellar or substellar nature of the candidates are presented in section 5. In section 6 we study the spectral types and emission in order to classify the new BDs and VLMSs according to their Weak or Classical T-Tauri-like signatures, and compare the fraction of both types of objects with previous results obtained in the stellar low-mass regime () of the same region (Briceño et al., 2005, 2007b). In section 7 we discuss the infrared emission properties of the new members, and compare with similar mass objects confirmed as members in other subregions of Orion. In section 8 we estimate the extinctions, temperatures, luminosities and masses and plot the newly confirmed members in H-R diagrams. Finally in section 9 we summarize the results and conclusions.
2 Photometry
2.1 Coadding of optical images
Since 1998 a multi-band (Johnson-Cousins BVRI) and multi-epoch large-scale survey ( 180 ) of the Orion star-forming region (,) is being performed with the Jürgen Stock 1.0/1.5 Schmidt-type telescope and the QUEST-I camera, at the Venezuela National Astronomical Observatory. The camera was developed by the QUEST collaboration (Baltay et al., 2002) and consists of sixteen pixel CCDs in a array which, taking into account the gaps between CCDs, provides a field of view of 5.4 with a scale of 1.02 . The system is optimized for observations performed in drift-scan mode at declinations near to the celestial equator. In this mode of operation, the telescope is fixed while the sidereal motion is compensated by adjusting the angle of each row of CCDs, which ride on a common supporting Invar rod, and by fine-tuning the readout frequency for each chip. Each CCD row is oriented in the north-south direction and is provided with a filter, resulting in a quasi-simultaneous observation in four different filters with an integration time per filter of at . Thus, the system produces scans at a rate of .
Our main interest is the analysis of existing -band observations, for which the system attains a limiting magnitude , with a completeness limit of . In order to evaluate the faintest magnitude at which we could expect the substellar limit to correspond for each of the regions spanned by our optical data, allowing for uncertainties in ages, distance and reddening, we made the following estimates. Using the models of Baraffe et al. (1998), the substellar limit for OB1a on the 12.6 Myr isochrone is placed at (for a distance modulus and extinction ; Briceño et al. 2005, 2007b), and the substellar limit for Ori OB1b on the 6.3 Myr isochrone is placed at too (distance modulus and maximum extinction ; Briceño et al. 2005, 2007b). We consider these isochrones as rough upper limits for the age of each subregion based on the age ranges reported by Briceño et al. (2005) for OB1a and OB1b. Because the substellar limit in each region is near the completeness limit of our individual I-band observations, we use a coadding technique in order to increase the signal to noise ratio (SNR) and therefore the limiting and completeness magnitudes of our optical data.
For the coadd we selected 8 individual (single) scans centered at , that were obtained in the and bands between December 1998 and January 1999. The corresponding observation log is shown in Table 1111This publication makes use of the Sistema de Colección de Datos Observacionales del Telescopio Schmidt version 2000 (SCDObs2000; Ponsot et al., 2007). The sum was performed using the packages Offline (Baltay et al., 2002) and DQ developed by the QUEST collaboration. Offline automatically processes an individual scan considering each CCD of the array as an independent device, reducing the images by bias, dark current and flat field, using calibration images obtained in drift-scan mode during the observation runs (see Baltay et al. (2002) for further details on the reduction process). After these corrections, Offline performs the detection of point sources, aperture photometry, and finally computes the astrometric matrix for each CCD image, based on the USNOA-2.0 catalog (Monet et al., 1998). DQ processes the raw scans, regarding each CCD from different scans as independent devices; then does the bias subtraction, dark current and flat field corrections, following the same procedure as employed by Offline. Using the astrometric matrices produced by Offline, the DQ software computes the offsets, rotations and scale differences between images of the same area of the sky obtained from different scans. With these corrections DQ produces, for each scan, a new output “scan” composed by a set of processed images that can be added pixel by pixel to produce the final coadded scan. The final gain in depth was magnitude and the resulting coadded scan encompasses the region , for the and filters.
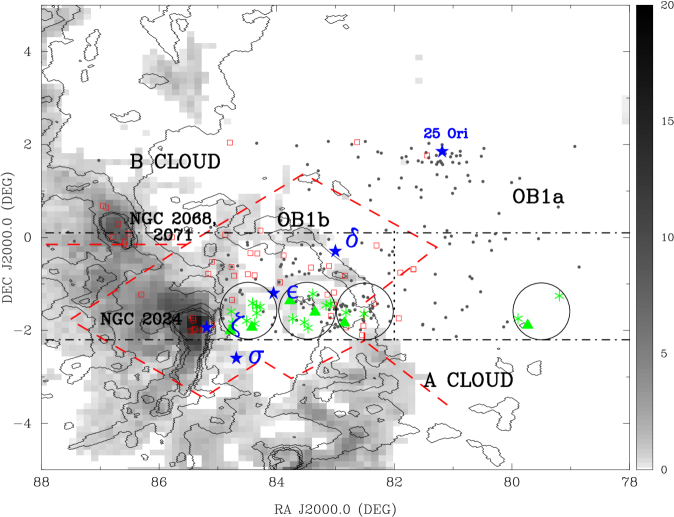
Our first step in defining the photometric candidate sample is the selection in I vs I-J diagrams of objects located above the isochrone that defines the upper age limit for each subassociation, because it is in these regions of the color-magnitude diagrams that the pre-main sequence populations are expected to fall. Because of the differences in age and distance we need to apply this procedure independently for each subassociation, which requires the definition of a spatial limit between the two. Using the integrated emissivity observed in the region by Bally et al. (1987), and the isocontours corresponding to the dust extinction map of Schlegel et al. (1998), as indicators of the position of the molecular clouds associated with OB1b, we considered as the rough limit between OB1a and OB1b within the 2.3 deg wide strip spanning the photometric sample analyzed in this work. This spatial limit between the two subassociations is consistent with that discussed by Briceño et al. (2005), who consider the molecular ringlike structure roughly centered on the Orion Belt star Ori, as a good tracer of the extent of the OB1b subassociation; within this gas ring are found the majority of low-mass PMS stars classified by them as members of OB1b. Figure 1 shows part of the entire area of our Orion optical survey, as well as the strip centered at considered here, the dust extinction map and emissivity used to define the limit between both regions and the fields of the spectroscopic followup analyzed in this work.
2.2 Optical photometry and 2MASS data
The detection of point sources in the coadded scan was performed with the daofind task in IRAF222IRAF is distributed by the National Optical Astronomy Observatories, which are operated by the Association of Universities for Research in Astronomy, Inc., under cooperative agreement with the National Science Foundation., extracting objects with and -band fluxes above . The small amount of crowding in our images ( 1.4 sources/arcmin2) justifies the use of aperture photometry. We used the phot task in IRAF, adopting an aperture radius (computed from growth curves) of , which is times the typical FWHM in both bands. Because our pixel scale is and the typical FWHM of the images is , each stellar profile is well sampled.
The astrometric solutions were computed using the WCStools package (Mink, 1999). and astrometric standards of the Guide Star Catalog GSCII333The Guide Star Catalog was produced at the Space Telescope Science Institute under U.S. Government grant. These data are based on photographic data obtained using the Oschin Schmidt Telescope on Palomar Mountain and the UK Schmidt Telescope., yielding a median offset between -band and -band catalogs of with a standard deviation of .
The photometric calibration to the Cousins system was performed by defining a set of 416 secondary photometric standards, located in four fields within our Orion strip. We made sure that each of the 4 strips at constant declination that compose a single driftscan observation, as produced by each of the 4 rows of detectors in the QUEST-I camera, would enclose roughly 100 of these secondary standard stars. The stars were chosen as objects known not to be variable from our multi-epoch survey data; only those flagged as non-variable at the mag level were used. The secondary standards span a range of brightness but are not saturated in any single observation, and they are not too faint, so that each star would yield a S/N ratio . The secondary standards were in turn calibrated using 12 primary photometric standard stars located in the SA92 and PG0231 Landolt fields (Landolt, 1992), observed at various airmasses under photometric conditions, with the 4-SHOOTER CCD camera on the 1.2 m telescope at the Smithsonian Astrophysical Observatory. The seeing was ″ throughout the observations. The 4-SHOOTER camera contains four Loral CCDs separated by 45″ and arranged in a grid. After binning during readout, the plate scale was . In order to achieve more uniform and consistent measurements, we placed all the standard stars on the same CCD detector (chip 3). Bias and flat field corrections were applied to the raw images using the standard tasks in the IRAF ccdproc package. We then performed aperture photometry with the apphot package, and derived zero points, extinction coefficients and color terms using the photcal package. The photometric errors of the secondary photometric standard stars are in the R and I bands.
The calibration of sources from the coadded images was performed independently for each CCD using standard IRAF tasks, yielding an mag and mag in the and bands respectively. Sources without detections in the band were calibrated independently in the band using zero points only. Therefore, we obtained two sets of data calibrated in different ways: one including an R-I color term and the other without it. In the transformation equation used to convert instrumental magnitudes to the secondary standard star system, the R-I color coefficient has a rather small mean value of for the I band. The observed R-I color of the candidates are in the interval , therefore, the difference between I magnitudes computed using a color term and those computed without it is magnitudes for the bluest and brighter candidates (expected to have an spectral type) and magnitudes for the reddest an fainter candidates (expected to have an spectral type). The final optical data catalog includes objects with typical instrumental errors of at and at . Therefore, the calibration using secondary standard stars offers adequate photometric accuracy for the VLMSs and substellar candidate selection and the subsequent analysis presented at this study. The limiting magnitudes obtained are and , with completeness limits of and . We define here completeness as the value at which the magnitude distribution departs from a linear behavior. Saturation occurs at .
A total number of sources were observed in our survey region by the 2MASS project, with limiting magnitudes of , , and completeness limits of , , , computed following the same procedure used for our optical data. Typical uncertainties in the 2MASS data are between completeness and limiting magnitudes for the three bands. A total number of objects from the optical catalog were identified in the 2MASS data, resulting in a median offset between both catalogs of with a standard deviation of .
3 Candidate selection
The candidate selection was performed using optical-infrared color-magnitude and color-color diagrams. This method has proved successful in identifying VLMS and BD candidates in young clusters and various star-forming regions (Briceño et al., 2002; Luhman et al., 2003a).
We compared the optical and infrared magnitudes and colors with isochrones and evolutionary tracks from Baraffe et al. (1998) models, in diagrams that included , , and -band data. As mentioned in section 2.1, we assumed a distance modulus of for OB1a, and for OB1b (Briceño et al., 2005). The first step was the selection in the vs diagram of objects placed above isochrones assumed to be a reasonable upper age limit for each subassociation, 12.6 Myr for OB1a and 6.3 Myr for OB1b (§2.1). In addition, because we are interested here in the lowest mass PMS stars and BDs, we required that candidates were located below the evolutionary track of the Baraffe et al. (1998) models444The census and study of the Orion OB1 PMS stars with masses above is the subject of works like Briceño et al. (2001, 2005).. These diagrams are shown in Figure 2. The objects selected from the vs diagrams were then plotted on the vs. plane. There we checked their positions with respect to the same isochrones and evolutionary tracks as we used in the vs diagrams, in order to verify the consistency of the first selection step. Finally, in order to reduce the contamination from reddened early type (and therefore more massive) stars, we selected only objects located above the reddening line corresponding to a spectral type M5 in the vs diagrams shown in Figure 3. On average, only objects later than M5 (), at different reddening values, are expected in this region of the diagram as we show in figure 3.
The reddening lines and vectors were computed according to the Cardelli et al. (1989) extinction law with (representative of OB associations), Baraffe et al. (1998) models, and temperature-spectral type relationships from Luhman et al. (2003b). The resulting catalog includes 64 VLMSs candidates in OB1a and 118 in OB1b, and 58 BDs candidates in OB1a and 77 in OB1b. Based on the completeness limits in the and bands, and Baraffe et al. (1998) models, we estimate the photometric sample to be complete down to members with masses with for OB1a, and masses for OB1b with as we show in Figure 2. Both reddening values are representative of the typical upper limits measured on our spectroscopic sample (see below) and in low mass stars confirmed in both subregions by Briceño et al. (2005, 2007a).
4 Optical spectroscopy
4.1 Spectroscopic observations
Though the photometric candidate selection technique is particularly sensitive to young VLMSs and BDs, a fraction of % of the sample is expected to be composed of background and foreground objects, contaminating the candidate lists. Actually, the field dwarfs 2MASS 05395200-0059019 (L5V; Fan et al., 2000) and the 2MASS 05012406-0010452 (L4V; Reid et al. in preparation) were detected in our photometric survey with , () and , () respectively and are included in our candidate list. Also, background late-type giants may be present. Therefore, spectroscopic confirmation of membership to the association is necessary.
We obtained low resolution spectra of a first sample composed of 30 objects: 4 candidates located in OB1a and 26 in OB1b. We used the Hectospec Multi-fiber spectrograph on the 6.5 MMT telescope (Fabricant et al., 1998). In its configuration the telescope offers a field of view, in which 300 fibers of the spectrograph can be placed. We used the 270 grating, that provides a spectral resolution of Å with a spectral coverage from 3700 to 9150 Å. Each fiber subtends on the sky and requires accurate coordinates for positioning. We used 2MASS coordinates for all our candidates.
The observations were performed as part of the spectroscopic followup of the CIDA Variability Survey of Orion (Briceño et al., 2005) in which the main goal is the identification of low mass stars in the range . Because of this, the spatial coverage in each OB1a and OB1b was dictated by the number of fields observed with Hectospec in each region for the shallow survey, out of which only fields containing VLMSs and BDs candidates from our deep coadd are considered here. The 4 candidates located in OB1a all fall within one Hectospec field, spanning . The 26 objects in OB1b are distributed over a larger area of (three Hectospec fields). For all fields the total integration time was . Because in Hectospec all objects placed in the same field have the same integration time, many of our faint VLMSs and BDs candidates had low . However, this did not affect in a significant way the spectral classification as we explain in the following section.
All the spectra were processed, extracted and wavelength calibrated by S. Tokarz at the CfA Telescope Data Center, using customized IRAF routines and scripts developed by the Hectospec team. A typical number of 37 fibers per field were used to obtain sky spectra; these were combined and the resulting spectra subtracted from the target spectra. The fields in the OB1b subassociation were selected far enough from the the molecular clouds to avoid problems due to the high sky background caused by nebulosity, however, some objects placed in the easternmost OB1b field do show some contamination by cloud emission lines (however, these lines did not affect the spectral classification). The spectra were wavelength calibrated using arc lamp data. The appropriate correction for the sensitivity function of the detector was applied, and the effects of the atmospheric extinction were computed, using standard IRAF routines based on observations of the spectrophotometric standard star BD+284211. Light sources inside the fiber positioner of Hectospec contaminate of the fibers at the red edge, starting at Å (N. Caldwell, private communication), therefore, during the analysis we ignored data at wavelengths beyond this value. The observations log is shown in Table 2.
4.2 Spectral classification
We performed the spectral classification based on the comparison with of temperature-sensitive spectral indices. We extended the semi-automated procedures of Hernández et al. (2004) and Sicilia-Aguilar et al. (2005) for their application to VLMSs and BDs, by adding indices measured for the 16 spectral features listed in Table 3, and a library of standard spectra of field dwarfs from Kirkpatrick et al. (1999). Our set of spectral indices span a wavelength range 4775-7940Å, including spectral features such as TiO absorption bands, that increase in strength from K5 to M7 spectral types, and VO absorption bands, that start dominating spectra from M7 to early L types.
Spectral types for noisy spectra were checked directly with the standard star spectral sequence using the visual extinction as a free parameter to get a more accurate result. The classification 555This procedure has been done using the code SPTCLASS, available at http://www.astro.lsa.umich.edu/hernandj/SPTclass/sptclass.html is shown in Table 4, and Figure 4 shows the spectra, with adopted spectral types of the new members shown in labels.
5 Association membership and substellar nature
5.1 Membership diagnostics
Candidates classified as late-M type objects can be divided into three different groups: first, the VLMSs and BDs that belong to the Orion OB1 association; second, background stars composed by late type giant stars; and third, foreground, old M-dwarf field stars. We have used several criteria to assign Orion OB1 membership to each candidate. These include the location above the ZAMS in color-magnitude diagrams, values close to the characteristic absorption towards each region, and spectroscopic indicators that characterize young, low-mass objects.
First, we consider the H line in emission, with equivalent width increasing toward later spectral types (Barrado y Navascués et al., 2003b; White & Basri, 2003). Strong H emission is a common feature of chromospherically active young objects, and of young objects accreting from a circumstellar disk (for the largest equivalent widths; e.g. Muzerolle et al., 2005). By adopting this criterion we eliminated contamination from background giant stars. Still, H emission can occur in dMe stars. In order to distinguish PMS objects from these late type field stars, and considering that PMS objects are still contracting, we chose as an additional youth indicator the strength of the Na I absorption feature. This doublet is sensitive to surface gravity and varies significantly between dwarf field stars and PMS objects; equivalent widths in young M dwarfs fall between those of field M dwarfs and M giant stars (Luhman et al., 2003b). Figure 5 shows the Na I lines of M type objects confirmed as members, superimposed on spectra of field dwarfs from Kirkpatrick et al. (1999), and of young M dwarfs from Luhman et al. (2003b) of the same spectral type. All these spectra were smoothed to the same resolution of 16 Å, and normalized in the range 8000-8400 Å. Both criteria used simultaneously offer a good membership indication. Additionally, the Av values obtained in this sample are in good agreement with the characteristic values measured in both subassociations by Briceño et al. (2007b) for low mass stars. Summarizing, M-type objects were classified as members if they showed H emission, Na I absorption clearly weaker than in field M dwarfs, and consistent with the known values for each subassociation. The confirmed new members (3 in OB1a and 19 in OB1b) are shown in Table 4. In the OB1a candidate sample we identified one late type (M6) object from the field, and in OB1b we classified 7 objects as field stars, 4 with late spectral types (M3, M5, M6 and M7) and 3 reddened early type stars.
Taking our entire spectroscopic sample of 30 objects, we find that 8 were classified as field stars (1 out of 4 in OB1a and 7 out of 26 in OB1b). Applying the exact test for the success rate in a binomial experiment (R-Statistical Software, Ihaka & Gentleman 1996), we find that the proportion of objects classified correctly as members is 0.73, with a 95% confidence interval of 0.54-0.87. Therefore, the selection technique described here identifies correctly 73.3% of objects.
5.2 Substellar status
According to the models of Baraffe et al. (1998), objects with masses at the substellar limit () and ages between 7.9 Myr and 3.2 Myr (that correspond to the mean ages of OB1a and OB1b computed by Briceño et al. (2005) based on PMS low-mass stellar populations), have effective temperatures of 2936 K and 2993 K respectively. Therefore, adopting the temperature to spectral type relationship from Luhman et al. (2003b) the substellar limit at these ages corresponds to a spectral type between M6 (2990 K) and M6.5 (2935 K). Following this criterion, we consider as BDs those members with spectral types later than M6. In the Hectospec field located in the OB1a subassociation we confirmed 1 VLMS with spectral type M4.5, 1 VLMS at the substellar limit with spectral type M6, and 1 BD with a spectral type M7. In the Ori OB1b subassociation we identified 14 VLMSs, out of which 7 have M6 spectral types, and 5 BDs (two with spectral types M6.5, two M7 and one M7.5).
6 T Tauri signatures across the substellar limit
The paradigm for low-mass star formation draws a picture in which a central low-mass star (T Tauri star) accretes mass from a circumstellar gas and dust disk, via magnetospheric accretion. Meanwhile the inner regions of the circumstellar disk are disrupted by the stellar magnetosphere, which then channels viscously accreting material out of the disk plane and towards the star along magnetic field lines (Königl., 1991; Shu et al., 1994). Signposts of this process, which have been directly observed in CTTSs, include: a) infrared emission from dust at a range of temperatures in the disk heated by stellar irradiation and viscous dissipation (from K at a few stellar radii, down to K at AU, e.g. Meyer et al., 1997; Hartmann, 1998; Muzerolle et al., 2003); b) blue/UV continuum excess emission from the accretion shock formed as accreting material falls onto the stellar surface (Valenti et al., 1993; Hartigan et al., 1995; Calvet & Gullbring, 1998); c) broad permitted emission lines produced in the ballistic magnetospheric gas flows (Muzerolle et al., 2001); and d) forbidden emission lines produced in accretion-powered winds and jets (Hartigan et al., 1995).
Recent studies have searched for similar characteristics in the lowest-mass CTTSs and young BDs, as one way to ascertain whether similar formation mechanisms apply between both types of objects. There is indeed considerable evidence for magnetically-mediated disk accretion, including broad permitted emission line profiles (especially H) and optical continuum veiling in BDs (e.g. White & Basri, 2003; Muzerolle et al., 2005; Jayawardhana et al., 2003). Furthermore, the infrared excess emission detected in many objects confirms the presence of irradiated circumstellar disks (Muench et al., 2001; Liu et al., 2003; Jayawardhana et al., 2003; Mohanty et al., 2004) and high resolution observations of H emission allowed the measurements of the mass accretion rates in BDs (Muzerolle et al., 2000) resulting in a much lower value than stellar-mass CTTSs with similar ages (e.g. Muzerolle et al., 2005; Luhman et al., 2007). It now seems well established that there is a continuum of CTTS-like properties across the substellar limit, shared by both the lowest-mass CTTSs and at least the higher mass young BDs.
Low-resolution spectra provide an appropriate means to look for H emission in CTTS. The dividing line between accreting (CTTSs) and non-accreting (WTTSs) was first set in terms of H emission at W(H) Å by Herbig & Bell (1988). More recently, White & Basri (2003) have revised this classification. In their new scheme, a star is considered to be a CTTS if Å in the range K0-K5, Å for K7-M2.5, Å for M3-M5.5, and Å for M6-M7.5. Here we followed their criteria to classify an object as a CTTS or a WTTS. Additionally Figure 6 shows the emission for the spectra in which this line was detected. Figure 7 shows the classification, with plotted as a function of the spectral type, with the CTTS/WTTS divide from White & Basri (2003) indicated by the dotted line. The results are summarized in Table 4.
7 Disks among the widely spread PMS population of Orion OB1
7.1 Trends in accretion-related indicators
The fraction of objects exhibiting CTTS-like properties can be used as an indicator of the population of disk-bearing objects which are still accreting from circum(sub)stellar disks. How these numbers compare among samples with differing ages, but presumably sharing a common origin, can provide insight into the time scale for the shutting off of accretion near and below the substellar boundary.
Using the same disk indicators we consider here, the first determination of the CTTS and WTTS fractions for the low-mass, widespread stellar population in Orion by Briceño et al. (2005), over an area of showed that 11% of the members in OB1a and 23% of the members on OB1b are CTTS. More recently Briceño et al. (2007b) found a lower CTTS fraction of 6% in Ori OB1a and 13% in Ori OB1b. However, this study was restricted to a much smaller area (totaling ). It is worth noting that because there are regions with higher concentrations of CTTS, like the very young clusters NGC 2024/2068 located on the Orion molecular clouds (e.g. see Figures 5 and 6 of Briceño et al. 2005), the CTTS fraction on small spatial scales is strongly dependent on the location of the region being considered.
The very small size of our sample in OB1a (only 3 members) does not allow us to derive any meaningful estimate, other than saying that it is completely dominated by WTTSs. In OB1b, we find that 7 of the 18 members that could be assigned a TTS type, are CTTS (because of suspected contamination from nebular emission, 05390910-0200267 could not be classified as either WTTS or CTTS). If we again apply the exact test for the success rate in a binomial experiment (R-Statistical Software, Ihaka & Gentleman 1996), we find that the proportion of CTTS in OB1b is 0.39, with a 95% confidence interval of 0.17 - 0.64; the large size of the confidence interval being due to the relatively small sample size. These results are largely consistent with previous findings, in the sense that the OB1a population is dominated by non-accreting PMS stars, whereas the accretor fraction in the younger OB1b region can be estimated in the range % depending on the region being considered and the sample size.
Our findings suggest that the overall number of accretors among VLMSs and BDs in OB1b is similar to that determined for low-mass () stars by Briceño et al. (2005). Also, it seems that, as it happens in the low-mass PMS members, the VLMS/BD accretor fraction falls off by a significant amount once the population reaches ages Myr. Determining the detailed evolution of the accretion fractions is similar between low-mass stars and VLMSs/BDs will require larger samples.
7.2 Near IR disk indicators
We analyzed the , and band emission of all the new members confirmed in this work. Figure 8 shows the observational vs. diagrams with the members classified as WTTSs and CTTSs. The members confirmed in OB1a (age Myr) do not show excess emission in either color. In the Myr old OB1b, where a fraction of the low-mass PMS stars () identified by Briceño et al. (2005) show infrared excesses, 7/19 members confirmed in this work (1 BD WTTS, 4 VLMSs WTTSs and 2 VLMSs CTTSs) have and lie to the right of the reddening line for an M6 star in figure 8, the region expected for objects with excess emission produced by hot dust in the innermost part of the disk ( AU; Meyer et al. (1997); Muzerolle et al. (2003)). The resulting inner-disk fraction for the entire sample (VLMSs AND BDs) is 0.38, and using the exact test for the success rate in binomial experiments (R-Statistical Software, Ihaka & Gentleman (1996)) we find a 95% confidence level interval 0.17-0.64. These numbers are very similar to what we found from disk accretion indicators (7.1), and consistent with the findings reported by Briceño et al. (2005).
Five of the new members confirmed in this work classified as WTTS VLMSs with masses () are located in the OB1b field studied with the Spitzer Space Telescope by Hernández et al. (2007b). Unfortunately, there are no similar observations for the objects we identified here in OB1a. For the five OB1b objects we have photometry in the four IRAC bands with the exception of 05312373-0150245, not detected in the band. These five members have all been classified as WTTS and Table 5 provides the IRAC photometry. Figure 9 shows the [3.6]-[4.5] vs. [4.5]-[5.8] and [3.6]-[4.5] vs. [5.8]-[8.0] color-color diagrams with the excess region defined by Luhman et al. (2005) (left panel) and the photospheric and CTTS locus defined by Hartmann et al. (2005) (right panel). All the objects exhibit photospheric colors in both diagrams, consistent with their optical classification as non-accreting objects; the exception is 05300324-0138428, classified as WTTS but whose [3.6]-[4.5] vs. [5.8]-[8.0] colors fall within the CTTS locus defined by Hartmann et al. (2005), albeit offset toward smaller excess values.
Having only four objects in OB1b (all WTTS) with full IRAC photometry prevents us from deriving a meaningful disk fraction; however, it is worth mentioning that for this same dataset Hernández et al. (2007b) derived a disk frequency of 13%, using low-mass () PMS stars. Their determination agrees well with the CTTS fraction derived by Briceño et al. (2007b) in the same area. Our inner-disk fraction of % (see above), obtained in an area times larger that of the Hernández et al. (2007b), is higher than their estimate, but consistent with the results from Briceño et al. (2005). As we have discussed in section 7.1, the discrepancy could well be due, at least in part, to the largely non-uniform spatial distribution of disk-bearing CTTS in OB1.
In the young Orionis cluster (age Myr) Caballero et al. (2007) combined optical, near-IR and Spitzer IRAC/MIPS measurements to derive a disk fraction of % in a sample of 30 BDs down to . However, this sample is a mixture of spectroscopically confirmed members and candidates selected on the basis of photometry only. If we restrict the analysis to the 13 objects in their Table B.1 which have spectral types, in the range M6-M7.5 (a spectral type range that overlaps the sample in this work), we find that only 5 objects exhibit excess IR emission that can be attributed to circum(sub)stellar disks. This produces a somewhat lower disk fraction of 38%, which agrees very well with the value we found above, from the near-IR disk indicators.
As in the case of the accretion-related indicators, our results from the JHK 2MASS photometry suggest that: 1) Disk fractions are similar in VLMSs/BDs and the lower mass PMS stars () at a given age. 2) The disk fraction near the substellar boundary falls off significantly, as occurs for the lower mass stars (), during the period Myr. However, the present small size of the available samples precludes any detailed analysis on how these fractions may evolve on both sides of the substellar limit.
We want to remark that strictly following the classification scheme by White & Basri (2003), of the 7 objects which show IR excesses, namely 05300324-0138428, 05312373-0150245, 05350579-0121443, 05322069-0125511, 05340726-0149380, 05345443-0144473 and 05390054-0150469, only the last two have been classified as CTTS. Object 05300324-0138428 shows an emission equivalent width at the WTTS/CTTS limit in Figure 7, and its IRAC colors place it at the borderline between photospheric colors and IR excesses on both color-color diagrams of Figure 9. A similar situation is that of 05312373-0150245, which is located near the WTTS/CTTS boundary in Fig.7, given our 0.5 subclass uncertainty in the spectral type classification, and its IRAC colors suggest it may have a small IR excess. Objects 05322069-0125511 and 05340726-0149380 have emission equivalent widths well below the WTTS/CTTS boundary. We have IRAC photometry only for 05322069-0125511, and its colors are clearly photospheric. In the near-IR JHK diagram (Fig. 8) both objects have the smallest values among the “excess emission” objects, lying closest to the limit of our JHK excess box. BD 05350579-0121443 whose J, H and K magnitudes are among the faintest of the sample, has an “ABB” 2MASS photometric flag which indicates a lower SNR in the H and K bands, and hence a larger uncertainty in the color. We conclude that, of the 5 objects classified as WTTS but showing IR excess, 4 have equivalent widths, from our low-resolution spectra, that place them on or close to the border between WTTS and CTTS types. High resolution spectroscopy will be needed to analyze the line profile and determine the presence of line wings extending to large velocities, characteristic of accreting stars (e.g. Muzerolle et al., 2005).
Of the 7 objects classified as CTTS only 2 fall within the IR excess box in Fig. 8. However, 3 out of the 5 CTTS outside the box have large enough errorbars that would bring them into the excess emission region. Therefore, within errors, only two CTTS really seem to lack IR excess emission at JHK. This is consistent with findings for very low-mass stars in other star-forming regions like Taurus (Luhman et al., 2003a). Observations at longer wavelengths should allow to detect excess IR emission in these two objects.
8 Reddening and H-R diagrams
The extinction towards each object was estimated from the color, for which possible contributions from excess emission at short and long wavelengths are minimized (Luhman et al., 2003b). In order to compute the intrinsic colors as a function of spectral type, we interpolated the corresponding temperature from the spectral type-temperature relationship of Luhman et al. (2003b), into the Baraffe et al. (1998) models corresponding to ages of 7.9 Myr for OB1a, and 3.2 Myr for OB1b.
The resulting intrinsic colors and computed extinctions are listed in Table 4. Extinctions are in the range for OB1a and for OB1b consistent with previously reported values in both regions by Briceño et al. (2005). Bolometric magnitudes were calculated using absolute band magnitudes and the bolometric correction from Legget et al. (1996) where is the intrinsic color from Kenyon & Hartmann (1995). Figure 10 shows the resulting H-R diagrams and table 4 the mass estimates that result from the interpolation of luminosities and temperatures within the Baraffe et al. (1998) models. The mean ages derived are and for OB1a and OB1b respectively, in good agreement with ages derived based on low-mass stars (Briceño et al., 2005).
9 Summary and Conclusions
We have presented initial results of our search for substellar objects and VLMSs in the widely dispersed populations of the Orion OB1a and OB1b subassociations. Our results can be summarized as follows:
-
•
Using deep optical I-band photometry and data from the 2MASS survey, we constructed optical-infrared color-color and color-magnitudes diagrams, in which we selected candidates across in Ori OB1 and over in Ori OB1b with completeness down to with for OB1a, and with for OB1b. We obtained low resolution optical spectra for a subsample of 4 candidates over of OB1a, and 26 candidates within of OB1b.
-
•
Through spectral signatures we confirmed 3 new members in OB1a, one of which is clearly substellar (spectral type M7, with an inferred mass ) and 2 are VLMSs, one of which is at the substellar limit (spectral type M6, with mass ). In OB1b we found 19 new members: 14 are VLMSs, of which 7 are at the substellar limit, and 5 are substellar members with spectral types between M6.5 and M7.5. From the spectroscopy we find that our photometric candidate selection technique is highly efficient (73%) in picking out young, very low-mass and substellar members of the Orion OB1 association. Masses were estimated according to the (Baraffe et al., 1998) models, and the less massive member (M7.5 spectral type), has an estimated mass .
-
•
The new members have been classified as CTTSs or WTTSs following the scheme of White & Basri (2003). We found that all three members confirmed in OB1a are WTTSs, while % of the members in OB1b are CTTSs. These results are largely consistent with recent findings, in the sense that the OB1a population is dominated by non-accreting PMS stars, whereas the accretor fraction in the younger OB1b region can be estimated in the range % depending on the exact location and area being considered, and the sample size. Our findings indicate that in OB1b, the number of accretors in VLMSs/BDs is similar to that derived for low-mass PMS stars (Briceño et al. (2005)); also, that the overall number of accretors, both in low-mass stars and among VLMSs/BDs falls off by a significant amount by ages Myr.
-
•
Of the 19 newly confirmed members of Ori OB1b, 7 (1 BD WTTS, 4 VLMSs WTTSs and 2 VLMSs CTTSs) exhibit excess emission in the 2MASS H-K color as would be expected of thermal emission from hot dust in the innermost part of a circumstellar disk. None of the 3 Ori OB1a members show near-IR excesses. We derive an inner-disk fraction of %, which is in excellent agreement with our result for the accretor fraction. Our inner-disk estimate for VLMSs and BDs is also consistent with the results from Briceño et al. (2005) for higher mass stellar objects (), and with findings for BDs spectroscopically confirmed in Ori by Caballero et al. (2007). The few Ori OB1b members with Spitzer data are all WTTS, by optical indicators; the IRAC photometry is largely consistent with this classification. Only one object shows marginal indication of excess emission at m.
As in the case of the accretion-related indicators, the near-IR indicators suggest that: 1) At a given age, the inner-disk fraction of objects at/near the substellar boundary is similar to that determined in the lower-mass () PMS stars. 2) The inner-disk fraction seems to fall off significantly, both in VLMSs/BDs and low-mass stars, once the population has aged to Myr, as in Ori OB1a. However, the present small size of the available samples precludes any detailed analysis on how these fractions may evolve on both sides of the substellar limit.
-
•
Finally we remark the discovery of two new members 05335219-0156398 (M7) and 05390532-0135327 (M6) classified as CTTSs, without contamination by emission lines from the cloud, both exhibiting strong H emission, with Å, suggesting significant ongoing accretion.
References
- Bally et al. (1987) Bally, J., Stark, A.A., Wilson, R.W., & Langer, W. D. 1987, ApJ, 312, L45.
- Baltay et al. (2002) Baltay et al. 2002, PASP, 114, 780.
- Baraffe et al. (1998) Baraffe, I., Chabrier, G., Allard, F. & Hausschildt, P. H. 1998, A&A, 337, 403.
- Barrado y Navascués et al. (2003a) Barrado y Navascués, D., Béjar, V. J. S., Mundt, R., Martín, E. L., Rebolo, R. 2003, A&A, 404, 171
- Barrado y Navascués et al. (2003b) Barrado y Navascués, D. & Martin E. 2003, AJ, 126, 2997-3006
- Basri (1998) Basri, G. 2000, ARA&A, 38:845, 519
- Béjar et al. (1999) Béjar, V. J. S., Zapatero-Osorio, M. R., Rebolo, R. 1999, ApJ, 521, 671
- Béjar et al. (2001) Béjar, V. J. S., Martín, E. L., Zapatero-Osorio, M. R., Rebolo, R., Barrado y Navascués, D. et al. 2001, 2001, ApJ, 556, 830
- Briceño et al. (1997) Briceño C., Hartmann L. W., Stauffer J., Gagné M., Stern R., and Caillault J. 1997, AJ, 113, 740
- Briceño et al. (2001) Briceño, C., Vivas, A.K., Calvet, N., Hartmann, L. et al. 2001, Science, 291, 93
- Briceño et al. (2002) Briceño, C., K. L. Luhman, K. L., Hartmann, L., Stauffer, J.R. & Kirkpatrick, D. 2002, ApJ, 580, 317.
- Briceño et al. (2005) Briceño, C., Calvet, N., Hernández, J. Vivas, A.K., Hartmann, L., Downes, J.J. & Berlind P. 2005, AJ, 129, 907.
- Briceño et al. (2007b) Briceño, C., Hartmann, L., Hernández, J., Calvet, N., Vivas, A. K., Furesz, G., Szentgyorgyi, A. 2007, ApJ, 661, 1119. (2007b).
- Briceño et al. (2007a) Briceño, C., Preibisch, T., Sherry, W. H., Mamajek, E. A., Mathieu, R. D., Walter, F. M., Zinnecker, H. 2007, in Protostars & Planets V., B. Reipurth, D. Jewitt, and K. Keil (eds), University of Arizona Press, Tucson, pp. 345-360 (2007a).
- Caballero et al. (2004) Caballero, J. A., Béjar, V. J. S., Rebolo, R., Zapatero-Osorio, M. R. 2004, A&A, 424, 857
- Caballero et al. (2007) Caballero, J. A., Béjar, V. J. S., Rebolo, R., Eislöffel, M. R., Zapatero-Osorio, M. R., Mundt, R., Barrado y Navascués, D. Bihain, G., Bailer-Jones, C. A. L., Forveille, T., Martín, E. L. 2007, arxiv:0705.0922
- Calvet & Gullbring (1998) Calvet, N. & Gullbring, E. 1998, ApJ, 509, 802.
- Calvet et al. (2005) Calvet, N., Briceno, C., Hernandez, J., Hoyer, S., Hartmann L., Sicilia-Aguilar A., Megeath T. & D’Alessio P. 2005, AJ, 129 935.
- Cardelli et al. (1989) Cardelli, J. A., Clayton, G. C. & Matis, J. S. 1989, ApJ, 345, 245.
- Fabricant et al. (1998) Fabricant, D. G., Hertz, E. N., Szentgyorgyi, A. H., Fata, R. G., Roll, J. B., Zajac, J. M. 1998, Proc. SPIE, 3355, 285.
- Fan et al. (2000) Fan, X., Knapp, G. R., Strauss, M. A., Gunn, J. E., Lupton, R. H. et al. 2000, AJ, 119, 928.
- Genzel & Stutzki (1989) Genzel, R. and Stutzki, J., 1989, ARA&A, 27, 41.
- González-García et al. (2006) González-García, B. M., Zapatero Osorio, M. R., Béjar, V. J. S., Bihain, G., Barrado Y Navascués, D., Caballero, J. A., Morales-Calderón, M. 2006, A&A, 460, 799
- Hartmann (1998) Hartmann, L. 1998, Accretion Processes in Star Formation, Cambridge University Press: Cambridge.
- Hartmann et al. (2005) Hartmann, L., Megeath, S. T., Allen, L., Luhman, K., Calvet, N., D’Alessio, P., Franco-Hernandez, R. & Fazio, G. 2005, ApJ, 629, 881-896.
- Hartigan et al. (1995) Hartigan, P., Edwards, S., Ghandour, L. 1995, ApJ, 452, 736.
- Herbig & Bell (1988) Herbig G. H. and Bell K. R. (1988) Lick Observatory Bulletin, Lick Observ., Santa Cruz.
- Hernández et al. (2004) Hernández J., Calvet N., Briceño, C., Hartmann, L., & Berlind P. 2004, AJ, 127, 1682.
- Hernández et al. (2007a) Hernández, J., Hartmann, L., Megeath, T., Gutermuth, R., Muzerolle, J., Calvet, N., Vivas, A. K., Briceño, C., Allen, L., Stauffer, J., Young, E., Fazio, G. 2007, ApJ, 662, 1067.
- Hernández et al. (2007b) Hernández, J., Calvet, N., Briceño, C.., Hartmann, L., Vivas, A. K., Muzerolle, J., Downes, J., Allen, L., Gutermuth, R. 2007, ApJ, 671, 1784.
- Hillenbrand & Carpenter (2000) Hillenbrand, L. A. and Carpenter, J. M. 2000, ApJ, 540, 236.
- Ihaka & Gentleman (1996) Ihaka, R. and Gentleman, R. 1996, Journal of Computational and Graphical Statistics 5, 299-314.
- Jayawardhana et al. (2002) Jayawardhana, R., Mohanty, S., Basri, G., 2002, ApJ, 578, 141.
- Jayawardhana et al. (2003) Jayawardhana, R., Ardila, D. R., Stelzer, B., & Haisch, K. E. 2003, AJ, 126, 1515.
- Jeffries et al. (2006) Jeffries, R. D., Maxted, P. F. L., Oliveira, J M., Naylor, T. 2006, MNRAS, 371, L6
- Kenyon & Hartmann (1995) Kenyon, S., Hartmann, L. ApJS, 101,117
- Kenyon et al. (2005) Kenyon, M. J., Jeffries, R. D., Naylor, T., Oliveira, J. M., Maxted, P. F. L. 2005, MNRAS, 356, 89
- Kirkpatrick et al. (1999) Kirkpatrick, J. D., Reid, I. N., Liebert, J., Cutri, R. M., Nelson, B. et al. 1999, ApJ, 519, 802.
- Königl. (1991) Königl, A. 1991, ApJ, 370, L39.
- Landolt (1992) Landolt, A. U. 1992 AJ, 104, 340.
- Legget et al. (1996) Legget, S. K., Allard F., Berriman, G., Dahn, C. C., Hauschildt, P., 1996, ApJS, 104,117.
- Liu et al. (2003) Liu, M. C., Najita, J., Tokunaga, A. T. 2003, ApJ, 585, 372.
- Luhman et al. (2003a) Luhman, K. L., Briceño, C., Stauffer, J. R., Hartmann, L., Barrado y Navascués, D., & Nelson, C. 2003, ApJ, 590, 348 (2003a).
- Luhman et al. (2003b) Luhman, K. L., Stauffer J. R., Muench, A. A. Rieke, G. H., Lada, E. A., Bouvier, J., Lada, C. J. 2003, ApJ, 593, 1093 (2003b).
- Luhman (2004) Luhman, K. L. 2004, ApJ, 602, 816.
- Luhman et al. (2005) Luhman, K., Lada, C., Hartmann, L., Muench, A., Megeath, T., Allen, L., Myers, P., Muzerolle, J., Young, E. & Fazio, G. ApJ, 631, L69-L72.
- Luhman et al. (2007) Luhman, K. L., Joergens, V., Lada, C., Muzerolle, J., Pascucci, I., White, R., 2007, in Protostars & Planets V., B. Reipurth, D. Jewitt, and K. Keil (eds.), University of Arizona Press, Tucson, pp. 443-457.
- Maddalena et al. (1986) Maddalena, R. J., Morris, M., Moscowitz, J., Thaddeus, P. 1986, ApJ, 303, 375.
- Meyer et al. (1997) Meyer, M. R., Calvet N., & Hillenbrand, L. A. 1997, AJ, 114, 288.
- Mink (1999) Mink, D. J. 1999 A.S.P. Conference Series, Vol. 172, pp. 498-501.
- Mohanty et al. (2004) Mohanty, S., Jayawardhana, R., Natta, A., Fujiyoshi, T., Tamura, M., Barrado y Navascués, D. 2004, ApJ, 609, L33.
- Mohanty et al. (2005) Mohanty, S., Jayawardhana & . Basri G., 2005, ApJ, 498, 522.
- Monet et al. (1998) Monet, D. , et al. 1998, PMM USNO-A2.0 Catalog (Washington:USNO)
- Muench et al. (2001) Muench, A. A., Alves, J., Lada, C. J., & Lada, E. A. 2001, ApJ, 558, L51.
- Muzerolle et al. (2000) Muzerolle, J., Briceno, C., Calvet, N., Hartmann, L., Hillenbrand, L. & Gullbring, E., 2000, ApJ141, 144.
- Muzerolle et al. (2001) Muzerolle, J., Calvet, N., Hartmann, L. 2001, ApJ, 550, 944.
- Muzerolle et al. (2003) Muzerolle, J., Calvet, N., Hartmann, L., D’Alessio, P. 2003, ApJ, 597, L149.
- Muzerolle et al. (2005) Muzerolle, J., Luhman, K., Briceño, C., Hartmann, L., Calvet, N. 2005, ApJ, 625, 906.
- Oppenheimer et al. (1998) Oppenheimer et al. (1998)
- Ponsot et al. (2007) Ponsot, E. A., Briceño, C., Vivas, A. K. 2007, Interciencia, 32, 76.
- Preibisch et al. (2005) Preibisch, T., McCaughrean, M. J., Grosso, N., Feigelson, E. D., Flaccomio, E. et. al., 2005, ApJS, 160, 582
- Reipurth & Clarke (2001) Reipurth, B. and Clarke, C., 2001, AJ, 122, 432.
- Schlegel et al. (1998) Schlegel, D.J., Finkbeiner, D.P., Davis, M. 1998, ApJ, 500, 525.
- Scott (1978) Scott, 1978
- Sherry et al. (2004) Sherry, W. H., Walter, F. M., Wolk, S. J. 2004, AJ, 128, 2316
- Shu et al. (1994) Shu, F., Najita, J., Ostriker, E., Wilkin, F., Ruden, S., & Lizano, S. 1994, ApJ, 429, 781.
- Sicilia-Aguilar et al. (2005) Sicilia-Aguilar, A., Hartmann, L., Hernandez, J., Briceno, C.; & C., Nuria 2005, AJ, 188, 209
- Slesnick et al. (2005) Slesnick, C. L., Hillenbrand, L. A. & Carpenter, J. M. 2005, ApJ, 625, 1063.
- Snyder (1998) Snyder J. A. 1998 Proc. SPIE, 3355, 635.
- Strom et al. (1989) Strom, K. M., Wilkin, F. P., Strom, S. E., Seaman, R. L. 1989, AJ, 98, 1444.
- Valenti et al. (1993) Valenti, J. A., Basri, G., Johns, C. M. 1993, AJ, 106, 2024.
- Warren & Hesser (1977) Warren, W.H., & Hesser, J.E. 1977, ApJS, 34, 115.
- White & Basri (2003) White, R. J., & Basri, G. 2003, ApJ, 582, 1109.
- Zapatero-Osorio et al. (2007) Zapatero-Osorio, M. R., Caballero, J. A., Béjar, V. J. S., Rebolo, R., Barrado y Navascués, D., Bihain, G., Eislöffel, M. R., Martín, E. L., Bailer-Jones, C. A. L., Mundt, R., Forveille, T., Bouy, H. 2007, A&A, 472, L9.
| Date | Scan | Filters | Mean Seeing (”) | ||
|---|---|---|---|---|---|
| 1998-12-13 | 504 | 04:10:00 | 05:51:00 | RBIV | 2.81 |
| 1998-12-13 | 505 | 04:10:00 | 05:51:00 | RBIV | 2.95 |
| 1998-12-29 | 501 | 04:10:00 | 05:51:00 | RBIV | 2.91 |
| 1999-01-09 | 527 | 03:55:00 | 05:53:00 | RBIV | 2.93 |
| 1999-01-09 | 528 | 03:55:00 | 05:53:00 | RBIV | 2.92 |
| 1999-01-10 | 529 | 03:55:00 | 05:53:00 | RBIV | 2.85 |
| 1999-01-09 | 528 | 03:55:00 | 05:53:00 | RBIV | 2.92 |
| 1999-01-10 | 529 | 03:55:00 | 05:53:00 | RBIV | 2.85 |
| 1999-01-10 | 530 | 03:55:00 | 05:53:00 | RBIV | 2.95 |
| 1999-01-22 | 501 | 03:55:00 | 05:53:00 | RBIV | 3.06 |


| Date | Subregion | Field ID | Integration [seg] | ||
|---|---|---|---|---|---|
| Apr/09/2005 | OB1a | decm160_04 | 05:17:59.67 | -01:35:19.4 | 2700 |
| Nov/03/2004 | OB1b | decm160_07 | 05:30:00.47 | -01:35:33.7 | 2700 |
| Mar/04/2005 | OB1b | decm160_08 | 05:33:55.64 | -01:34:29.8 | 2700 |
| Nov/19/2004 | OB1b | decm160_09 | 05:37:55.32 | -01:34:33.0 | 2700 |
| Feature ID | (Å) | (Å) |
|---|---|---|
| TiO-1 | 4775 | 30 |
| TiO-2 | 4975 | 50 |
| TiO-3 | 5225 | 75 |
| TiO-4 | 5475 | 75 |
| TiO-5 | 5600 | 50 |
| TiO-6 | 5950 | 75 |
| TiO-7 | 6255 | 50 |
| TiO-8 | 6800 | 50 |
| TiO-9 | 7100 | 50 |
| TiO-10 | 7150 | 50 |
| VO-1 | 7460 | 100 |
| VO-2 | 7840 | 100 |
| VO-3 | 7940 | 100 |


| 2MASS-ID | adST | W[H] | Lines | WTTS/CTTS | Av | |||||||||
|---|---|---|---|---|---|---|---|---|---|---|---|---|---|---|
| 05164635-0115233 | 19.2250.047 | 17.1210.010 | 14.946 | 14.415 | 14.127 | M6.00.5 | M6 | -26.8 | …… | W | 0.6 | -1.81 | 2990 | 0.07 |
| 05185578-0153232 | 20.2040.100 | 17.7670.015 | 15.364 | 14.640 | 14.260 | M7.01.0 | M7 | -18.5 | …… | W | 0.5 | -1.80 | 2880 | 0.06 |
| 05193522-0144501 | 18.7060.023 | 16.8820.007 | 14.864 | 14.330 | 14.020 | M4.70.5 | M4.5 | -13.3 | …… | W | 0.9 | -1.79 | 3197 | 0.15 |
| 05300324-0138428 | ……………….. | 16.2720.013 | 13.419 | 12.515 | 11.895 | M2.70.5 | M3 | -20.0 | …… | W | 3.9 | -0.64 | 3415 | 0.40 |
| 05311727-0136587 | 19.0490.037 | 16.9890.008 | 14.944 | 14.432 | 14.078 | M6.00.5 | M6 | -16.8 | …… | W | 0.1 | -1.63 | 2990 | 0.08 |
| 05312373-0150245 | 19.9670.066 | 17.8390.016 | 15.643 | 15.104 | 14.485 | M6.20.5 | M6 | -24.4 | …… | W | 0.6 | -1.85 | 2990 | 0.07 |
| 05322069-0125511 | 18.3760.015 | 16.5690.005 | 14.656 | 14.205 | 13.709 | M4.80.5 | M5 | -8.8 | …… | W | 0.2 | -1.56 | 3125 | 0.13 |
| 05323839-0127204 | ……………….. | 18.0590.018 | 15.800 | 15.298 | 14.986 | M5.50.5 | M5.5 | -26.0 | …… | C | 1.0 | -1.91 | 3057 | 0.09 |
| 05332365-0136234 | 20.0810.071 | 17.8190.014 | 15.379 | 14.856 | 14.458 | M6.01.0 | M6 | -22.3 | …… | W | 1.3 | -1.67 | 2990 | 0.08 |
| 05333251-0112519 | 18.1580.024 | 16.2400.009 | 14.013 | 13.347 | 12.921 | M5.01.0 | M5 | -31.1 | …… | C | 1.2 | -1.19 | 3125 | 0.17 |
| 05335219-0156398 | ……………….. | 18.1020.024 | 15.736 | 14.967 | 14.579 | M7.01.5 | M7 | -207.4 | …… | C | 0.3 | -1.73 | 2880 | 0.06 |
| 05340726-0149380 | 20.1480.100 | 17.8760.017 | 15.641 | 15.271 | 14.766 | M5.51.0 | M5.5 | -10.4 | …… | W | 1.0 | -1.83 | 3057 | 0.09 |
| 05345443-0144473 | 17.0200.005 | 15.7730.004 | 13.381 | 12.511 | 11.901 | M3.00.5 | M3 | -32.8 | HeI | C | 2.5 | -0.78 | 3415 | 0.40 |
| 05350579-0121443 | ……………….. | 18.9280.040 | 16.341 | 15.835 | 15.229 | M6.51.0 | M6.5 | -18.1 | …… | W | 1.4 | -2.00 | 2935 | 0.07 |
| 05370790-0129204 | 20.3440.090 | 18.1730.017 | 15.869 | 15.564 | 15.216 | M4.80.5 | M5 | -4.7 | …… | W | 1.4 | -1.91 | 3125 | 0.13 |
| 05372198-0129140 | 18.6760.020 | 16.4840.005 | 14.209 | 13.703 | 13.333 | M6.10.5 | M6 | -26.8 | …… | W | 0.8 | -1.26 | 2990 | 0.10 |
| 05373853-0124270 | 18.6170.026 | 16.7010.007 | 14.592 | 14.037 | 13.625 | M6.20.5 | M6 | -32.4 | …… | W | 0.3 | -1.47 | 2990 | 0.09 |
| 05374145-0155519 | ……………….. | 18.2950.031 | 15.987 | 15.484 | 15.115 | M7.00.5 | M7 | -47.0 | HeI | C | 0.2 | -1.83 | 2880 | 0.06 |
| 05380232-0147405 | 18.4060.020 | 16.2490.004 | 14.088 | 13.487 | 13.103 | M6.50.8 | M6.5 | -16.5 | …… | W | 0.1 | -1.24 | 2935 | 0.08 |
| 05390054-0150469 | 19.6130.065 | 17.7320.018 | 15.476 | 15.020 | 14.539 | M6.21.0 | M6 | -67.1 | …… | C | 0.7 | -1.78 | 2990 | 0.07 |
| 05390532-0135327 | 19.6040.041 | 17.6190.011 | 15.356 | 14.784 | 14.454 | M5.80.5 | M6 | -140.3 | HeI | C | 0.8 | -1.72 | 2990 | 0.07 |
| 05390910-0200267 | ……………….. | 19.1020.086 | 16.166 | 15.559 | 15.413 | M7.71.0 | M7.5 | -93.5 | …… | ? | 1.6 | -1.90 | 2795 | 0.04 |


.

| ID-2MASS | STad | WHa | WTTS/CTTS | [3.6] | [3.6] | [4.5] | [4.5] | [5.8] | [5.8] | [8.0] | [8.0] |
|---|---|---|---|---|---|---|---|---|---|---|---|
| 05300324-0138428 | M3 | -20.0 | W | 11.180 | 0.003 | 10.922 | 0.003 | 10.785 | 0.008 | 10.273 | 0.008 |
| 05311727-0136587 | M6 | -16.8 | W | 13.708 | 0.009 | 13.635 | 0.012 | 13.684 | 0.054 | 14.297 | 0.239 |
| 05312373-0150245 | M6 | -24.4 | W | 14.464 | 0.012 | 14.223 | 0.017 | 13.995 | 0.059 | ……… | …….. |
| 05322069-0125511 | M5 | -8.8 | W | 13.528 | 0.008 | 13.458 | 0.011 | 13.501 | 0.048 | 13.523 | 0.090 |
| 05323839-0127204 | M5.5 | -26.0 | W | 14.611 | 0.014 | 14.570 | 0.022 | 14.533 | 0.100 | 15.197 | 0.420 |

