The evolution of the colour-magnitude relation and of the star formation activity in galaxy clusters since
Abstract
We present recent results on the evolution of the colour-magnitude relation and of the star formation activity in galaxy clusters since . Results are based on the ESO Distant Cluster Survey (EDisCS) - an ESO large programme aimed at the study of cluster structure and cluster galaxy evolution over a significant fraction of cosmic time - and are discussed in the framework of the current standard paradigm of structure formation.
Max Planck Institut für Astrophysik, Postfach 1317, D-85748
Garching bei München, Germany
INAF - Osservatorio Astronomico di Padova, I-35122, Italy
1. Introduction
Galaxy clusters are commonly considered as good laboratories for studying the physical processes that drive galaxy evolution. This foremost role is primarily due to the practical advantage of having many galaxies (all approximately at the same redshift) in a relatively small region of the sky, so that efficient observations can be carried out even with modest fields of view, and with limited amounts of telescope time. Within our current standard paradigm for structure formation, galaxy clusters represent, however, biased environments originating from the highest (and rarest) peaks in the primordial density field, whose evolution appears to be more rapid and perhaps more violent than in regions of the Universe with average density (see discussion in De Lucia 2007).
The instrumental capabilities achieved in recent years, and the completion of modern large photometric and spectroscopic surveys have provided a rapidly growing database of high–redshift clusters, and widened the mass range of the examined systems. It is now becoming evident that the physical properties of cluster galaxies depend not only on redshift but also on cluster mass, and that this dependency needs to be taken into account for a correct interpretation of observational data in terms of evolution. In this framework, the EDisCS cluster sample represents an ideal dataset.
EDisCS provides homogeneous photometry and spectroscopy for fields containing galaxy clusters from to . Cluster candidates were selected from the Las Campanas Distant Cluster Survey (Gonzalez et al. 2001) by identifying positive surface brightness fluctuations in the background sky. The parent EDisCS sample was constructed by selecting from the highest surface brightness candidates, and confirming the presence of an apparent cluster and of a possible red-sequence with shallow VLT exposures in two filters. cluster candidates were then followed up with deep optical photometry with FORS2/VLT (White et al. 2005), near-IR photometry with SOFI/NTT (Aragón-Salamanca et al. in preparation), and multislit spectroscopy with FORS2/VLT (Halliday et al. 2004; Milvang-Jensen et al. 2008).
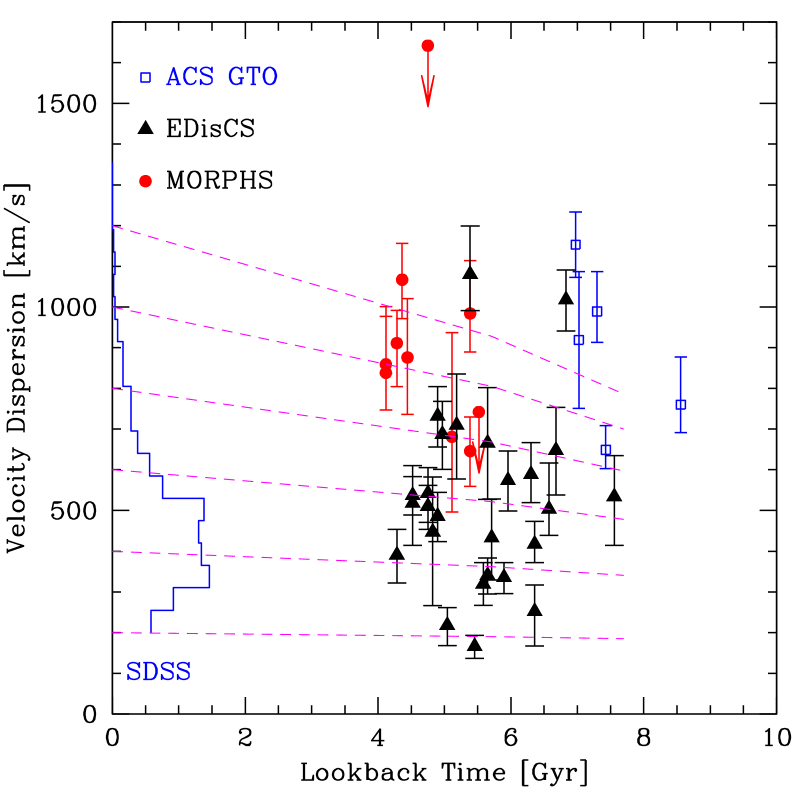
At the time of writing, all phases of the programme have been completed, and most of the data have been made publicly available111http://www.mpa-garching.mpg.de/galform/ediscs/. A first basic characterisation of our sample is presented in White et al. (2005) and shows that the EDisCS sample covers a wide range of masses and structural properties. Fig. 1 shows that the EDisCS clusters have velocity dispersions that are generally lower than those of other well studied clusters at similar redshift. They fill quite nicely the redshift gap between the MORPHS and the ACS GTO clusters which are the only two large high-redshift cluster samples studied in similar details. Perhaps more interestingly, Fig. 1 shows that the EDisCS sample spans the appropriate range of cluster velocity dispersions for comparison with local samples.
In this review, we summarise the results of two studies based on EDisCS data and related to the evolution of the star formation activity (Sec. 2.) and of the colour-magnitude relation (Sec. 3.).
In the following, we will assume a CDM cosmology: , , and . With this cosmology, - the highest redshift probed by the EDisCS sample - corresponds to more that per cent of the look-back time to the Big Bang. All magnitudes used in the following are Vega magnitudes.
2. The star formation activity
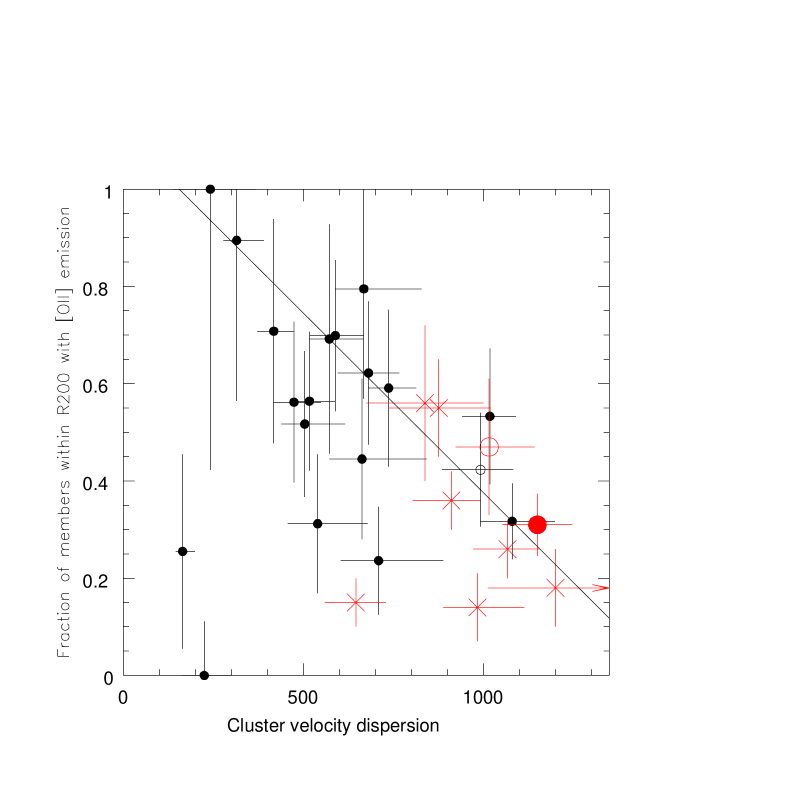

Fig. 2 shows the fraction of galaxies with [Oii] emission as a function of the cluster velocity dispersion for clusters in the redshift range in the left panel, and for a sample of low-redshift clusters from the SDSS in the right panel. All galaxies with an EW of [Oii] and within the cluster virial radius are considered (for details, see Poggianti et al. 2006). The error bars are large and there is a large scatter for clusters with similar velocity dispersion. The general trend, however, is of a broad anti-correlation for high redshift clusters, where data indicate the presence of an ‘envelope’ in the sense that more massive clusters have at most a certain fraction of star forming galaxies. Interestingly, the trend is not visible when considering only the most massive systems. For clusters at low redshift, the fraction of star forming galaxies is approximately constant for systems with velocity dispersion larger than , and shows a very large scatter for systems with lower velocity dispersion.


In order to investigate a possible connection between the observed trends and the growth history of cosmic structures, we used two different approaches: (i) the extended Press & Schechter formalism was used to estimate the fraction of final mass that resides in haloes of different mass at earlier times; (ii) semi-analytic techniques coupled to -body simulations were used to estimate the number of galaxies in haloes of different mass at higher redshifts. The results of this analysis are shown in Fig. 3. The figure shows that the fraction of passive222Here we consider ‘passive’ all galaxies with no [Oii] emission. The fraction of passive galaxies is therefore where is the fraction of star forming galaxies shown in Fig. 2 galaxies at high-z is largely determined by the fraction of mass/galaxies that were already in haloes with mass at (left panel). The fraction of passive galaxies in low-z clusters is in nice agreement with the fraction of mass/galaxies in haloes with mass at (right panel).
The redshift corresponds to a lookback time of Gyr. This time-interval can be considered a reasonable upper limit for the time required to extinguish star formation in newly accreted galaxies by taking into account the time-scales associated to various physical processes that might lead to a suppression of the star formation activity, and the spectro-photometric timescale for the evolution of the [Oii] signature. The trends shown in Fig. 2 are therefore consistent with a scenario where today cluster passive galaxies consist of two different populations: ‘primordial’ passive galaxies whose stars formed at , and ‘quenched’ passive galaxies whose star formation has been suppressed at later times, possibly by physical processes at play in dense environments.
3. The colour-magnitude relation
The first three panels of Fig. 4 show the number of ‘red-sequence galaxies’ as a function of their I-band magnitude. For the histograms shown in Fig. 4, we have used all cluster members within 0.3 mag from the best fit colour-magnitude relation, determined using spectroscopically confirmed members with absorption line spectra. Clusters have been combined in three redshift bins correcting colours and magnitudes to the central redshift of the corresponding bin. Corrections are based on a single burst model with formation redshift and a metallicity-dependent normalisation333As explained in the original papers, the relation between the metallicity and luminosity has been calibrated so as to reproduce the metallicity-luminosity relation observed for the Coma cluster.. We have shown that this simple model provides a good fit to the observed red-sequence over all the redshift range sampled by the EDisCS clusters, as well as for the Coma cluster and for a local cluster sample from the SDSS.

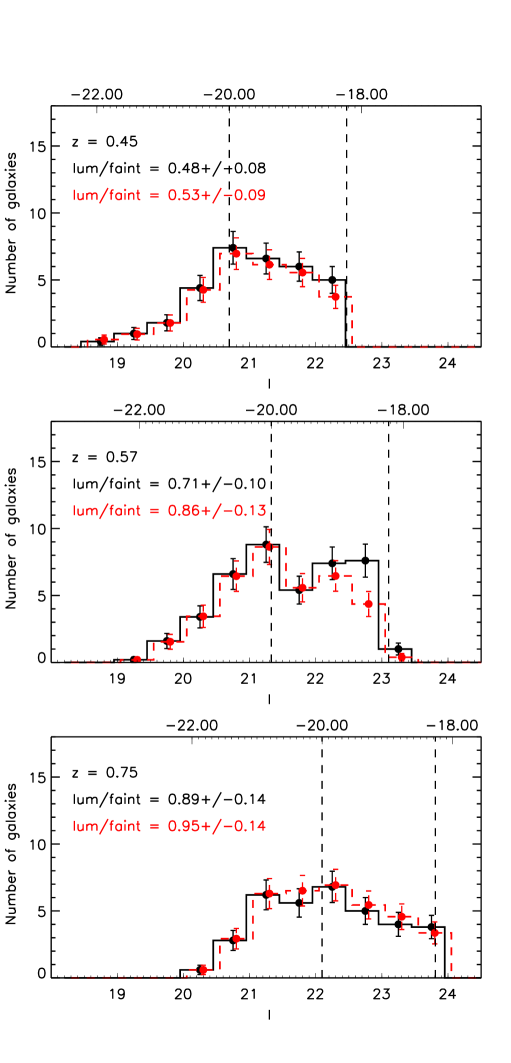

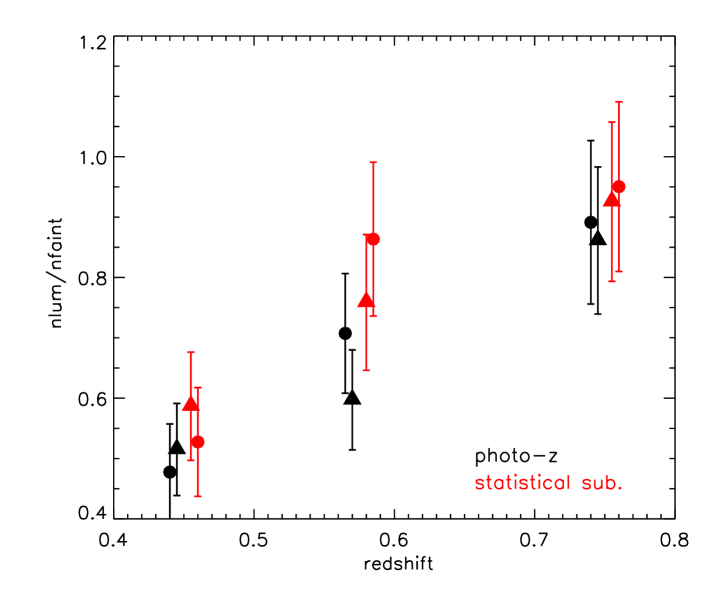
Black and red histograms in Fig. 4 correspond to different criteria for cluster membership. The scale on the top of each panel shows the rest-frame V-band magnitude corresponding to the observed I-band magnitude after correcting for passive evolution between the redshift of the bin and (for details, see De Lucia et al. 2004 and De Lucia et al. 2007). By defining as ‘luminous’ all galaxies brighter than , and as ‘faint’ all galaxies fainter than this limit and brighter than , we find a clear trend for a decreasing luminous-to-faint ratio as a function of redshift. The trend is confirmed independently of the method used to select cluster members and of the area used for the analysis (bottom-right panel of Fig. 4).
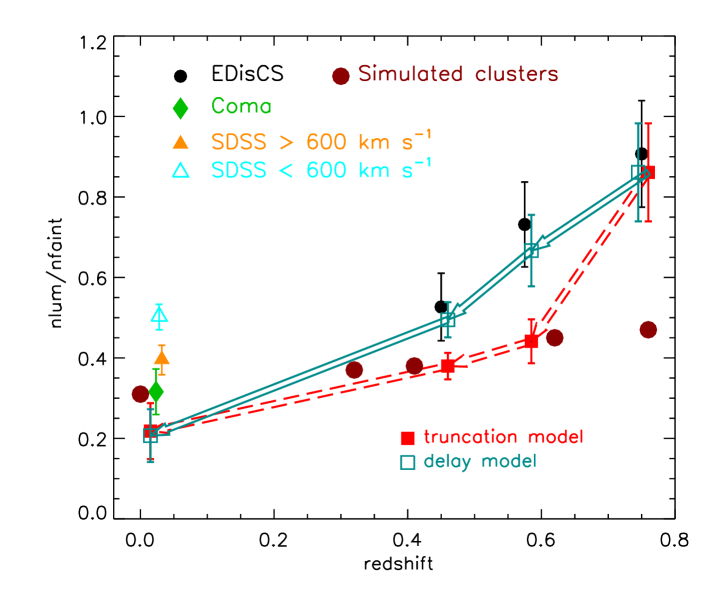
The trend of Fig. 4 can be reproduced by simple evolution of the combined blue and red galaxies that populate the colour-magnitude diagram of our high-redshift clusters. This is shown explicitly in Fig. 5. The average behaviour of the EDisCS data is shown with black circles, while the blue and red symbols connected by arrows represent the evolution predicted by simple models obtained evolving all galaxies at earlier redshifts. Red arrows correspond to a model where the star formation histories of the galaxies under consideration are truncated at the redshift of the observation of each cluster, while blue arrows correspond to a model where the star formation histories are suppressed 1 Gyr later than the redshift of observation (see original paper for details). The red filled circles in Fig. 5 show predictions from the semi-analytic model described in De Lucia & Blaizot (2007).
Fig. 5 shows that both the ‘truncation’ and the ‘delayed’ model predict an amount of evolution from the highest redshift considered to that is in good agreement with that measured using the highest redshift EDisCS clusters and the Coma cluster (green diamond). In the truncation model, galaxies move onto the red-sequence very rapidly and the predicted luminous-to-faint ratio lies below the measured value in the intermediate redshift bins. In the delayed model, galaxies stay blue longer and the predicted evolution is closer to the observed trend at all redshifts sampled by the EDisCS clusters. The local sample of SDSS clusters used in our analysis lies above the value measured for the Coma cluster, with luminous-to-faint ratios compatible with those measured for the EDisCS clusters at . The zero-point of the colour-magnitude relation predicted by our semi-analytic model shows the same level of evolution measured from the data, and the luminous-to-faint ratio measured for simulated clusters at is in very nice agreement with that measured for Coma. The predicted evolution as a function of redshift is, however, weaker than observed. This indicates that in these models the transition from blue to red occurs on a time-scale which is shorter than observed (see also Wang et al. 2007, and discussion in De Lucia 2007).
4. Discussion and Conclusions
In this review, we have summarised the results of recent work studying the evolution of the star formation activity and of the colour-magnitude relation in galaxy clusters since . Our dataset is based on systems with a wide range of velocity dispersion from the EDisCS sample, which we have complemented with other clusters at similar redshift from the literature, and with a local cluster sample from the SDSS. The complementarity between the EDisCS sample and other well studied systems at similar redshift has revealed an important element to better quantify evolution as a function of redshift and of cluster mass444In the studies summarised here, we have used the cluster velocity dispersion as a proxy for the mass of the system.
Using the presence of the [Oii] line in emission as a signature of ongoing star formation, we have demonstrated that the fraction of star forming galaxies varies as a function cluster velocity dispersion, and that this dependency changes as a function of redshift. Interestingly, our results can be explained by linking the ‘passive’ systems with the mass/number of objects that have experienced different environments at earlier times. The model proposed is quite simple and it does not provide useful insight on the physical process(es) responsible for the suppression of the star formation in cluster galaxies. It is, however, suggestive that a simple model based on structure formation is able to explain quantitatively the evolution measured from our data. In fact, structure formation is an important - and often neglected - element to be taken into account when interpreting observational data in terms of evolution.
Our study on the evolution of the colour-magnitude relation has demonstrated that there is significant evolution in the luminosity distribution of red-sequence galaxies. Compared to clusters in the local Universe, the EDisCS clusters exhibit a significant deficit of faint red galaxies. Our results clearly indicate that the red–sequence population of high–redshift clusters does not contain all progenitors of nearby red–sequence cluster galaxies. A significant fraction of these must have moved onto the red–sequence below . We have shown that the evolution in the relative distribution of ‘luminous’ and ‘faint’ red-sequence galaxies can be explained by evolution of the blue bright galaxies that populate the colour-magnitude diagram of high redshift clusters. The model used is extremely simplified (e.g. it assumes a single redshift of formation, it neglects the accretion of new galaxies), and results should be interpreted with caution. A semi-analytic model coupled with high-resolution -body simulations predicts a much smaller evolution than observed, and we have argued that this is due to a too rapid decline of the star formation of galaxies accreted onto larger systems.
Future studies comparing in detail results like those presented here with predictions from semi-analytic models coupled to high-resolution simulations, will provide important constraints on galaxy formation models, and on the physical processes governing evolution of galaxies in clusters.
Acknowledgments.
We acknowledge contributions from all EDisCS team. GDL thanks the organisers of the meeting for their wonderful hospitality.
References
- De Lucia (2007) De Lucia, G. 2007, in ASP Conf. Ser. Vol 379, Cosmic Frontiers, ed. N. Metcalfe & T. Shanks, 257
- De Lucia & Blaizot (2007) De Lucia, G., Blaizot, J. 2007, MNRAS, 375, 2
- De Lucia et al. (2004) De Lucia, G., Poggianti, B. M., Aragón-Salamanca, A., Clowe, D., Halliday, C., Jablonka, P., Milvang-Jensen, B., Pelló, R., Poirier, S., Rudnick, G., Saglia, R., Simard, L., White, S. D. M. 2004, ApJ, 610, 77
- De Lucia et al. (2007) De Lucia, G., Poggianti, B. M., Aragón-Salamanca, A., White, S. D. M., Zaritsky, D., Clowe, D., Halliday, C., Jablonka, P., von der Linden, A., Milvang-Jensen, B., Pelló, R., Rudnick, G., Saglia, R., Simard, L. 2007, MNRAS, 374, 809
- Gonzalez et al. (2001) Gonzalez, A. H., Zaritsky, D., Dalcanton, J. J., Nelson, A. 2001, ApJS, 137, 117
- Halliday et al. (2004) Halliday, C., Milvang-Jensen, B., Poirier, S., Poggianti, B. M., Jablonka, P., Aragón-Salamanca, A., Saglia, R. P., De Lucia, G., Pelló, R., Simard, L., Clowe, D. I., Rudnick, G., Dalcanton, J. J., White, S. D. M., Zaritsky, D. 2004, A&A, 427, 397
- Milvang-Jensen et al. (2008) Milvang-Jensen, B., Noll, S., Halliday, C., Poggianti, B. M., Jablonka, P., Aragón-Salamanca, A., Saglia, R. P., Nowak, N., von der Linden, A., De Lucia, G., Pelló, R., Moustakas, J., Poirier, S., Bamford, S. P., Clowe, D. I., Dalcanton, J. J., Rudnick, G. H., Simard, L., White, S. D. M., Zaritsky, D. 2008, A&A in press, arXiv:0802.0149
- Poggianti et al. (2006) Poggianti, B. M., von der Linden, A., De Lucia, G., Desai, V., Simard, L., Halliday, C., Aragón-Salamanca, A., Bower, R., Varela, J., Best, P., Clowe, D., Dalcanton, J., Jablonka, P., Milvang-Jensen, B., Pelló, R., Rudnick, G., Saglia, R., White, S. D. M., Zaritsky, D. 2006, ApJ, 642, 188
- White et al. (2005) White, S. D. M., Clowe, D., Simard, L., Rudnick, G., De Lucia, G., Aragón-Salamanca, A., Bender, R., Best, P., Bremer, M., Charlot, S., Dalcanton, J., Dantel, M., Desai, V., Fort, B., Halliday, C., Jablonka, P., Kauffmann, G., Mellier, Y., Milvang-Jensen, B., Pelló, R., Poggianti, B., Poirier, S., Rottgering, H., Saglia, E., Schneider, P., Zaritsky, D. 2005, A&A, 444, 365
- Wang et al. (2007) Wang, L., Li, C., Kauffmann, G., De Lucia, G. 2007, MNRAS, 377, 1419