The Evolution of Late-time Optical Emission from SN 1986J
Abstract
We present late-time optical images and spectra of the Type IIn supernova SN 1986J. HST ACS/WFC images obtained in February 2003 show it to be still relatively bright with mF606W = 21.4 and mF814W = 20.0 mag. Compared against December 1994 HST WFPC2 images, SN 1986J shows a decline of only 1 mag in brightness over eight years. Ground-based spectra taken in 1989, 1991 and 2007 show a 50% decline in H emission between and an order of magnitude drop between , along with the disappearance of He I line emissions during the period . The object’s [O I] 6300, 6364, [O II] 7319, 7330 and [O III] 4959, 5007 emission lines show two prominent peaks near 1000 km s-1 and 3500 km s-1, with the more blueshifted component declining significantly in strength between 1991 and 2007. The observed spectral evolution suggests two different origins for SN 1986J’s late-time optical emission: dense, shock-heated circumstellar material which gave rise to the initially bright H, He I, and [N II] 5755 lines, and reverse-shock heated O-rich ejecta on the facing expanding hemisphere dominated by two large clumps generating two blueshifted emission peaks of [O I], [O II], and [O III] lines.
Subject headings:
supernovae — supernova remnants — circumstellar matter1. Introduction
With a peak flux density of 128 mJy at 5 GHz, SN 1986J is one of the most radio-luminous supernovae ever detected (Weiler, Panagia, & Sramek, 1990). The supernova probably occurred early in in the edge-on galaxy NGC 891, more than three years before its August 1986 discovery in the radio (van Gorkom et al., 1986; Rupen et al., 1987; Bietenholz et al., 2002). With its optical outburst going unnoticed, the earliest optical detection showed the supernova at a magnitude of 18.4 in in January of 1984 (Rupen et al., 1987; Kent & Schild, 1987).
SN 1986J is classified as a Type IIn (see Schlegel 1990) and has been compared with other luminous SNe IIn like SN 1988Z and SN 1995N. Optical spectra of SN 1986J obtained in 1986 showed prominent and narrow ( 700 km s-1) H emission with no broad component (Rupen et al., 1987). Emission lines of [O I], [O II], and [O III] had somewhat larger widths of 1000 2000 km s-1. Many narrow and weak emission lines including those from helium were also observed. Spectra taken three years later in 1989 showed that the dominant narrow H emission had diminished in strength, with the forbidden oxygen emission lines relatively unchanged (Leibundgut et al. 1991; hereafter L91).
Early very long baseline interferometry (VLBI) revealed an aspherical source with marginal indication of an expanding shell (Bartel, Shapiro, & Rupen, 1989; Bartel et al., 1991). Subsequent VLBI observations show a distorted shell and a current expansion velocity of 6000 km s-1, considerably less than an extrapolated initial velocity of 20 000 km s-1 (Bietenholz et al., 2002).
In this Letter, we present Hubble Space Telescope (HST) images of SN 1986J showing it to still be relatively luminous optically more than two decades after outburst. We also present ground-based optical spectra obtained at three epochs spanning 18 yr to follow its late-time emission evolution.
2. Observations
Images of NGC 891 in the region around SN 1986J obtained by the Advanced Camera for Surveys (ACS) system aboard the HST using the Wide Field Channel (WFC) on 2003 Feb 18 and 20 were retrieved from STScI archives (GO 9414; PI:R. de Grijs). The images were taken using filters F606W and F814W. Standard IRAF/STSDAS data reduction was done including debiasing, flat-fielding, geometric distortion corrections, photometric calibrations, cosmic-ray and hot pixel removal, with the STSDAS drizzle task used to combine exposures.
Low-dispersion optical spectra of SN 1986J were obtained with the MMT on Mount Hopkins using the Red Channel spectrograph with a TI CCD on 1989 September 5 and again on 1991 October 14. For both observations, a 2 wide slit and a 150 lines mm-1 grating was used to obtain spectra spanning 4000–8000 Å, with a resolution of 30 Å. Total exposure times for each spectrum was 9000 s.
Spectra of SN 1986J were also obtained on 2007 September 11 at MDM Observatory using the 2.4 m Hiltner telescope with the Boller & Chivens CCD spectrograph (CCDS). A north–south 1.5 5 slit and a 150 lines mm-1 4700 Å blaze grating was used to obtain two sets of spectra, one consisting of s exposures spanning 4000 – 7100 Å, and another of s exposures covering 6900–9000 Å using an LG 505 order separation filter. Both spectra were of resolution of 10 Å. Another spectrum with this same setup consisting of s exposures was taken on 2007 Dec 20 spanning 6100 – 9000 Å. Seeing was around 1 for all spectra. The spectra were processed using standard procedures in IRAF111The Image Reduction and Analysis Facility is distributed by the National Optical Astronomy Observatories, which are operated by the Association of Universities for Research in Astronomy, Inc., under cooperative agreement with the National Science Foundation. using standard stars from Strom (1977).
3. Results
3.1. Late-Time Optical Photometry
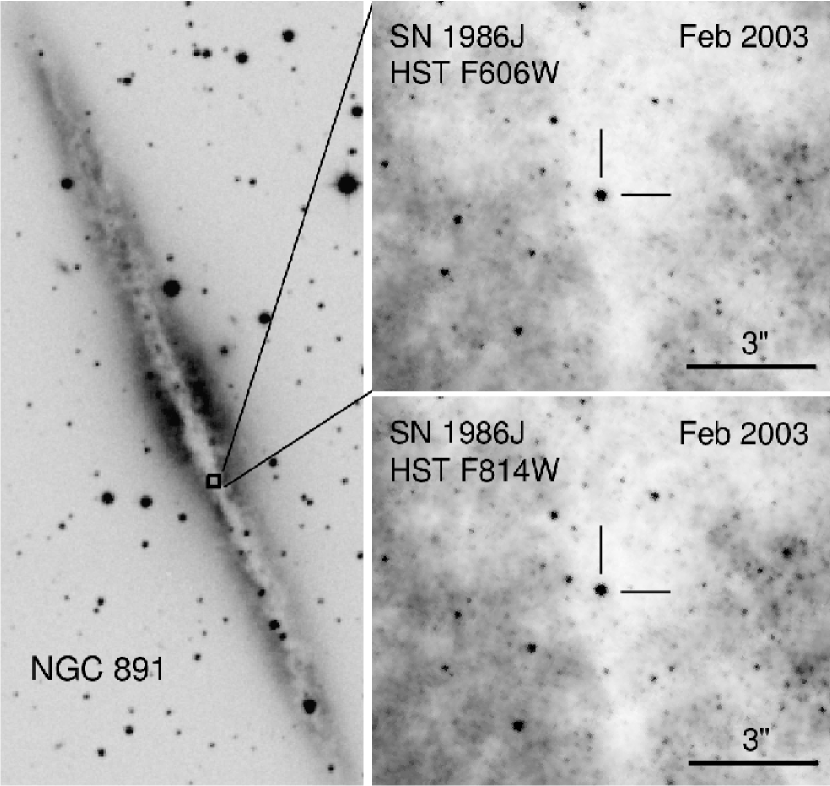
The left panel of Figure 1 shows the blue DSS2 image of NGC 891 with the location of SN 1986J marked, and the two right panels show HST ACS/WFC images of NGC 891 centered on the region around the supernova. With 2003 epoch VEGAMAG apparent magnitudes of mF606W = 21.4 and mF814W = 20.0 mag, these images indicate that SN 1986J has remained relatively bright nearly two decades after the estimated 1983 optical outburst.
The SN 1986J site in NGC 891 was also imaged some eight years earlier on 1994 December 1 by HST with the Wide Field Planetary Camera 2 (WFPC2) using the F606W filter (see van Dyk et al. 1999). Reduction of these 1994 data show m 21.3 mag. Accounting for differences in instrumental response between the WFPC2 and ACS, these observations suggest a decline of only 1 mag in the F606W filter over the eight years separating the observations.
3.2. Emission Line Changes Since 1989
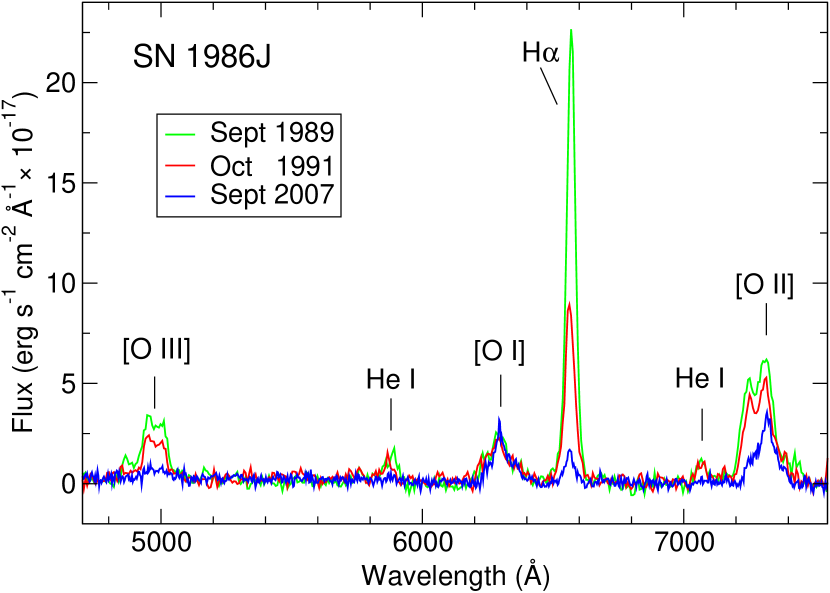
In Figure 2 we present optical spectra of SN 1986J at three epochs spanning 18 years: 1989.7 (published by L91) 1991.8, and . The 2007 spectrum is an average of the three spectra obtained in September and December of 2007, with the combined relative fluxes believed accurate to within 20%.
Between the three epochs, SN 1986J’s optical emission shows several significant changes. The greatest change is the decline in H emission. As of 2007, the H line observed centered around 6564 Å has a flux of 4 erg s-1 cm-2, down some 20 times from 9 erg s-1 cm-2 observed in 1989. The [N II] 6548,6583 emission lines are not resolved, and we measure the H emission in 2007 assuming nitrogen contributes approximately 1/4 of the total integrated flux around the line. We estimate that H emission declined by a factor of 2 between 1989 and 1991 and by a factor of 10 between 1991 and 2007.
The line center for SN 1986J’s H emission also showed an increasing blueshift between 1989 and 2007. In 1986, the line center roughly matched NGC 891’s redshift of +528 km s-1 (Rupen et al., 1987; de Vaucouleurs et al., 1991). However, by 1989 the shift had decreased to +330 km s-1 (L91), and in 2007 the center of the observed H emission shifted still more to the blue, virtually negating the galaxy’s systemic velocity and appearing practically unredshifted.
Other changes in the late-time spectra of SN 1986J include the fading beyond detectability of H and He I 5876 and 7065 emission lines in the 2007 spectrum which were present in 1989 and 1991. Also considerably diminished in 2007 is the emission associated with the [O III] 4959, 5007 emission observed around 4980 Å.
Changes in the profiles of some emission lines are evident. Broad emission around 7300 Å consisting of two prominent emission peaks at 7250 Å and 7320 Å seen in both the 1989 and 1991 spectra exhibits a significant diminishment along its blue side in the 2007 spectrum (see Fig. 2). We identify both emission peaks with the [O II] 7319, 7330 line emission. Although some contribution from [Ca II] 7291,7324 is possible, [O II] emission likely dominates the broad Å emission.
The bluer emission peak at 7250 Å, prominently visible in 1989 and 1991 spectra, faded significantly by 2007, evolving into a weak, broad emission feature blueward of 7300 Å. The other emission peak at 7320 Å showed a smaller intensity decline and a shift to the red by 10 Å relative to its appearance in 1989. Lastly, faint redshifted [O II] emission extending from 7380 to 7450 Å visible in the 1989 spectrum gradually weakened and decreased in velocity in the 1991 and 2007 spectra.
Other features show only minor changes in strength and/or profile. The broad emission centered around 6295 Å identified with the [O I] 6300 line has a 2007.8 epoch flux of 1.4 erg s-1 cm-2 assuming a ratio of 3:1 for the 6300 Å and 6364 Å lines. This is roughly the same as the combined flux of 2.7 erg s-1 cm-2 for the two lines lines measured in 1989 by L91.
4. Discussion
A steady drop in H emission strength together with smaller declines in forbidden oxygen emissions are consistent with our estimated m 1 mag decline between 1994 and 2003. To investigate possible changes in emission since then, we used synphot to compare the count rate of the 2003 F606W image against the expected count rate of the ACS/WFC F606W given the 2007 spectrum as input. The rates are marginally different and within the uncertainties associated with the relative flux of the spectra and light loss from the slit. This suggests that SN 1986J’s optical flux has not deviated appreciably from a continued, slow decline over the last four years.
4.1. Emission-Line Profiles from O-Rich SN Ejecta
While a blueshifted, double-peak emission profile is most apparent in the [O II] 7319,7330 lines in the 1989 and 1991 spectra, in fact, all of SN 1986J’s oxygen emissions display a similar double-peak emission profile blueshifted with respect to the host galaxy’s rest frame. Figure 3 presents an overlay of [O I], [O II], and [O III] line profiles plotted in velocity space. This figure shows good agreement for both the line profiles and emission peaks near 1000 and 3500 km s-1.
Added support for double-peak oxygen line profiles comes from faint emission near 4340 Å present in both 1989 and 1991 spectra which we interpret as [O III] 4363 line emission (see Fig. in L91). When corrected for NGC 891’s redshift, the positions and widths of the peaks observed at 4313 Å and 4338 Å match the 1000 km s-1 and 3500 km s-1 emission peaks observed in the other oxygen profiles. After correcting for foreground reddening of mag (Rupen et al., 1987), the observed [O III] I(4959+5007)/I(4363) line ratio suggests an electron density for the [O III] emitting region of cm-3 assuming an electron temperature of K like that found in shock-heated O-rich ejecta seen in young supernova remnants (Hurford & Fesen, 1996; Blair et al., 2000).
An interpretation of a spectrum dominated by two blueshifted, O-rich ejecta clumps is a very different one from that proposed by L91 for explaining the box-like [O III] 4959, 5007 profile. They suggested that the observed shape was due to the 5007/4959 line ratio being close to 1:1 instead of the optically thin ratio of 3:1 typically observed in low density nebulae. A ratio close to unity for both the [O I] and [O III] line doublets were interpreted as caused by emission originating from regions with electron densities of cm-3. However, in light of the strong similarity of all oxygen emission profiles, such high density estimates appear no longer valid.
4.2. Origin of the Late-Time Optical Emission
Our interpretation of line emission profiles together with the observed spectral evolution over the last two decades suggests two separate sites for SN 1986J’s late-time optical emission. The decline of SN 1986J’s H emission and its relatively low expansion velocity ( km s-1) suggests this emission comes from shock-heated circumstellar material (CSM). Early spectra showing an initially very bright H emission along with fainter emissions from He I and [Fe II] are consistent with an emission nebula generated by a km s-1 blast wave overrunning a dense CSM environment rich in CNO-processed material (Rupen et al., 1987). The apparent blueshift in the line center of H over the past 20+ years is likely due to increasing extinction of the receding hemisphere possibly due to dust formation in the SN ejecta.
Chugai & Danziger (1994) suggested SN 1986J’s late-time optical emission originates from shocked dense clouds of circumstellar gas in the progenitor star’s clumpy pre-SN wind. The presence of [N II] 5755 line emission and the lack of strong [N II] 6548, 6583 emission (Rupen et al., 1987) supports this scenario, suggesting relatively high densities ( cm-3) similar to that seen in the circumstellar ring around SN 1987A.
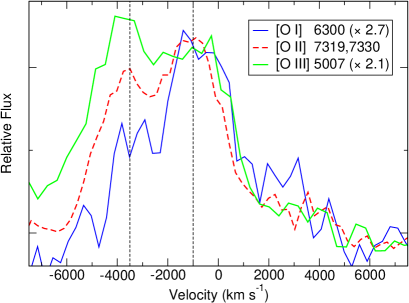
The interaction of the SN’s outward-moving blast wave with dense and clumpy CSM will generate a strong reverse-shock into slower expanding SN ejecta, leading to the observed forbidden oxygen line emissions. The presence of two prominent blueshifted emission peaks across three ionization stages implies this component of SN 1986J’s optical emission comes mainly from two large patches of reverse shock-heated, O-rich ejecta on the facing expanding hemisphere having radial velocity components in our line-of-sight around km s-1 and km s-1.
The gradual redward shift of the km s-1 emission component toward smaller blueshifted velocities seen most clearly in the [O II] 7319,7330 profile between 1989 and 2007 may signal the progression of reverse shock emission coming from inner, slower moving O-rich ejecta during the intervening two decades. Additionally, weak emission seen redward of 7330 Å together with weak emission near 5050 Å possibly associated with [O III] might indicate highly reddened O-rich ejecta located on the rear expanding expanding hemisphere with radial velocities up to km s-1.
Finally, mention should be made concerning the possibility for photoionization of SN 1986J’s ejecta by its bright central compact source (Chevalier, 1987). Early optical and radio observations of SN 1986J suggested that it may be a very young Crab Nebula-like remnant (Chevalier, 1987; Weiler, Panagia, & Sramek, 1990) and such a connection has been strengthened by recent VLBI observations showing a bright, compact radio component with an inverted spectrum near the center of the expanding shell (Bietenholz, Bartel, & Rupen, 2004; Bietenholz & Bartel, 2008). This central source is thought to be either emission from a young, energetic neutron star or accretion onto a black hole. The optical filaments in the Crab Nebula are mainly photoionized by its pulsar. With SN 1986J’s central component some 200 times more luminous than the Crab Nebula between 14 and 43 GHz Bietenholz & Bartel (2008), this raises the possibility of photoexcitation of SN 1986J’s ejecta.
However, during its first decade of evolution, SN 1986J’s strong [O III] 4363 line suggested temperatures more indicative of shock heating ( K) rather than photoionization ( K). Additionally, the high densities of the O-rich ejecta and/or formation of dust in the ejecta could limit the importance of photoionization by the central source. Indeed, the large Balmer decrement ratio of H/H (1986.8 epoch; L91) observed in early spectra may be an indication of high internal extinction.
At its current age ( yr), the importance of photoexcitation from the central source, quite possibly a young Crab-like neutron star, is less clear. Recent observations with XMM-Newton and Chandra have shown a sharp decline in X-ray luminosity, perhaps signaling a diminishing role of shock-heating in SN 1986J’s late-time optical emission (Temple, Raychaudhury, & Stevens, 2005). Future increased contribution from photoionization could be reflected as broadening in optical emission line widths like that predicted by Chevalier & Fransson (1994).
In view of SN 1986J’s strong oxygen line emissions, a better comparison than the Crab might be the yr old LMC remnant 0540-69.3. This remnant has a bright pulsar wind nebula surrounding a 50 ms pulsar and shock-heated, O-rich ejecta expanding at velocities km s-1 (Morse et al., 2006) much more in line with what is observed in SN 1986J.
References
- Bartel, Shapiro, & Rupen (1989) Bartel, N., Shapiro, I. I., & Rupen, M. P. 1989, ApJ, 337, L85
- Bartel et al. (1991) Bartel, N., Rupen, M. P., Shapiro, I. I., Preston, R. A., Rius, A. 1991, Nature, 350, 212
- Bietenholz & Bartel (2008) Bietenholz, M. F., & Bartel, N. 2008, Adv. in Space Res., 41, 424
- Bietenholz, Bartel, & Rupen (2004) Bietenholz, M. F., Bartel, N., & Rupen, M. P. 2004, Science, 304, 1947
- Bietenholz et al. (2002) Bietenholz, M. F., Bartel, N., & Rupen, M. P. 2002, ApJ, 581, 1132
- Blair et al. (2000) Blair, W. P., et al. 2000, ApJ, 537, 667
- Chevalier & Fransson (1994) Chevalier, R. A., & Fransson, C. 1994, ApJ, 420, 268
- Chevalier (1987) Chevalier, R. A. 1987, Nature, 329, 611
- Chugai & Danziger (1994) Chugai, N. N., & Danziger, I. J. 1994, MNRAS, 268, 173
- de Vaucouleurs et al. (1991) de Vaucouleurs, G., et al. 1991, Third Reference Catalogue of Bright Galaxies, v9.
- Hurford & Fesen (1996) Hurford, A. P., & Fesen, R. A. 1996, ApJ, 469, 246
- Kent & Schild (1987) Kent, S., & Schild, R. 1987, IAU Circ. No. 4423
- Leibundgut et al. (1991) Leibundgut, B. et al. 1991, ApJ, 372, 531 (L91)
- Morse et al. (2006) Morse, J. A., Smith, N., Blair, W. P., Kirshner, R. P., Winkler, P. F., & Hughes, J. P. 2006, ApJ, 644, 188
- Rupen et al. (1987) Rupen, M. P., van Gorkom, J. H., Knapp, G. R., Gunn, J. E., & Schneider, D. P. 1987, AJ, 94, 61
- Schlegel (1990) Schlegel, E. 1990, MNRAS, 244, 269
- Strom (1977) Strom, K. M. 1977, Kitt Peak National Observatory Memorandum, “Standard Stars for Intensified Image Dissector Scanner Observations”.
- Temple, Raychaudhury, & Stevens (2005) Temple, R. F., Raychaudhury, S., & Stevens, I. R. 2005, MNRAS, 362, 581
- van Gorkom et al. (1986) van Gorkom, J., Rupen, M., Knapp, G., Gunn, J., Neugenbauer, G., & Matthews, K. 1986, IAU Circ., No. 4248
- Weiler, Panagia, & Sramek (1990) Weiler, K. W., Panagia, N., & Sramek, R. A. 1990, ApJ, 364, 611
- van Dyk et al. (1999) van Dyk, S. D., Peng, C. Y., Barth, A. J., & Filippenko, A. V. 1999, AJ, 118, 2331