THE SDSS DISCOVERY OF A STRONGLY LENSED POST-STARBURST GALAXY AT z=0.766
Abstract
We present the first result of a survey for strong galaxy-galaxy lenses in Sloan Digital Sky Survey (SDSS) images. SDSS J082728.70+223256.4 was selected as a lensing candidate using selection criteria based on the color and positions of objects in the SDSS photometric catalog. Follow-up imaging and spectroscopy showed this object to be a lensing system. The lensing galaxy is an elliptical at z = 0.349 in a galaxy cluster. The lensed galaxy has the spectrum of a post-starburst galaxy at z = 0.766. The lensing galaxy has an estimated mass of 1.2 and the corresponding mass to light ratio in the -band is 26 inside 1.1 effective radii of the lensing galaxy. Our study shows how catalogs drawn from multi-band surveys can be used to find strong galaxy-galaxy lenses having multiple lens images. Our strong lensing candidate selection based on photometry-only catalogs will be useful in future multi-band imaging surveys such as SNAP and LSST.
1 INTRODUCTION
Gravitational lensing is a highly useful phenomenon in astrophysics. It allows us to study faint galaxies that have been magnified, and can be used for a variety of cosmological constraints. For example, a strong lens forming multiple images of a background source allows us to determine the mass distribution of the lensing object (e.g. Bolton et al., 2006). Moreover, the discovery of a substantial number of lens systems makes it possible to study the potential wells of lensing galaxies in a statistical way (e.g. Koopmans et al., 2006). The lensed galaxy itself is magnified, allowing us to study its properties in detail (e.g. Seitz et al., 1998; Richard et al., 2006). When a background quasar is strongly lensed, this magnification sometimes makes the host galaxy visible (Peng et al., 2006). The statistics of strong lenses allow constraints on the cosmological parameters (e.g. Kochanek, 2003; Oguri, 2007), including models of dark energy (Fedeli & Bartelmann, 2007; Oguri et al., 2008).
Because of the importance of gravitational lensing systems, there have been many systematic studies of them and surveys for them. In particular, strong gravitational lensing of quasars has been studied systematically by the CASTLES collaboration (Muñoz et al., 1998), the CLASS (Myers et al., 2001), and the Sloan Digital Sky Survey (SDSS) (Inada et al., 2007). While various surveys of galaxy lensing have been carried out (e.g., Fassnacht et al., 2004; Moustakas et al., 2007), many discoveries of lensed galaxies have been serendipitous, such as the discovery of the lensed galaxy cB58 at z=2.7 (Yee et al., 1996; Seitz et al., 1998). Systematic searches for strongly lensed galaxies have been also made in the fields of massive clusters (e.g. Pelló et al., 2005). For example, HST WFPC2 images were used to find giant arcs around galaxy clusters (Sand et al., 2005). Hennawi et al. (2008) obtained deep images of 240 rich galaxy clusters selected from SDSS, discovering 16 new giant arc systems. These giant galaxy cluster lenses allow us to determine the mass distribution on scales of several hundred kpc.
The large volume spectroscopic survey of the SDSS (York et al., 2000) allows systematic searches for galaxy-galaxy lenses. Bolton et al. (2004) and Willis et al. (2006) searched for objects whose spectra show features of both low-redshift ellipticals and higher-redshift emission lines. Deep HST imaging confirms that the foreground elliptical is lensing the background galaxy. This method has discovered enough strong lensing cases to allow a statistical study of lensing galaxies (e.g. Bolton et al., 2006, 2007).
Using SDSS imaging data, Allam et al. (2007) serendipitously discovered a lensed Lyman break galaxy at z = 2.73 around a lensing galaxy at z = 0.38. The lensing galaxy of this lens system has an SDSS spectrum, which does not show any features of the lensed background galaxy because the separation between the lensing galaxy and the lensed image is larger than the 15 radius of the spectrograph fiber. This lens therefore did not enter the Bolton et al. (2004) sample.
These discoveries suggest an automated search for galaxy lenses in wide-field imaging data. Several recent studies have used automatic image analysis techniques to find strong lenses in deep images (Lenzen et al., 2004; Horesh et al., 2005; Alard, 2006; Seidel & Bartelmann, 2006; Cabanac et al., 2007). Estrada et al. (2007) have also applied a similar method to SDSS images to find giant arcs around clusters of galaxies. These methods use the characteristic arc shape of lens images by calculating the ellipticity or the length-to-width ratios of objects in the imaging data. These arc-shape detection programs can find a hidden compact ring around a lensing galaxy, as shown by Cabanac et al. (2007).
However, strong lensing detection based on the shape of objects has several difficulties. First, this kind of survey depends on several parameters that are tuned for an optimal detection rate. For example, when the properties of the images such as signal-to-noise ratio and seeing change, the parameters have to be retuned before the codes are applied to the new images. Second, it does not work well when the images are not deep enough to show a bright arc shape, even if the lensed galaxy is quite visible. Third, it is computationally demanding to process massive quantities of wide field image data with shape detection codes when we want to search all lensing possibilities around all elliptical galaxies. A simpler method to search for strong galaxy-galaxy lensing would be valuable.
We find that a lensing search based only on a photometric catalog can be used to detect strong galaxy-galaxy lenses in SDSS images, even though they are not deep enough to show the full morphology of lensed arcs. All SDSS imaging data are processed by an automated pipeline (Lupton et al., 2002). Measured parameters of detected objects including multi-band magnitudes and correlations with neighboring objects are archived to a database from the pipeline. Indeed, the photometric catalog has enough information to allow us to separate the rare lenses from other objects.
In this paper we show the first results of our search for strong galaxy-galaxy lenses in SDSS. We explain the candidate selection strategy in the following section. In §3, we present follow-up observational data of the first confirmed lensing object, SDSS J082728.70+223256.4. A possible lens model is given in §4. The properties of the lensing galaxy are described in §5. Discussion and conclusions follow in §6. In this paper we focus on demonstrating the use of a multi-band photometry catalog to find lensing systems. We are still refining our selection algorithm, so we will quantify the completeness of our sample and give details of our final candidate selection method in a subsequent paper.
2 CANDIDATE SELECTION
The SDSS produces a photometric catalog in five bands using a 2.5m telescope equipped with 30 CCDs (Gunn et al., 1998, 2006) as well as a spectroscopic catalog of objects selected from the imaging data. The properties of all objects detected above 5 in at least one band over the imaged to date are measured by a dedicated pipeline (Lupton et al., 2002) and are calibrated photometrically (Tucker et al., 2006) and astrometrically (Pier et al., 2003). We use the fifth public data release (Adelman-McCarthy et al., 2007) in selecting lens candidates. Since most possible lensing galaxies are early-type galaxies because of their large velocity dispersions (Turner et al., 1984; Fukugita & Turner, 1991), we assume that lensing galaxies are red galaxies in the SDSS images. Because only the most luminous of those possible lensing galaxies have redshifts above 0.2 (Strauss et al., 2002; Eisenstein et al., 2001), we do not restrict our analysis to the sample of objects with redshifts.
Our candidate selection method is still being developed, so we only outline the criteria that were used in finding the reported lens system here. First, we identify all red galaxies in the photometric catalog that have a model magnitude in -band 23.0 without correction for Galactic extinction. Red galaxies are defined using color cuts suggested by Goto et al. (2002):
| (1) | |||
| (2) |
where we use model magnitudes throughout. This color cut selects intrinsically red galaxies up to redshift 0.4. We next select those red galaxies that have at least two photometric companions between 24 and 36 away, a typical radius of strongly lensed systems, and a large enough separation that the image deblender separates the lens images from the red galaxy.
In order to discriminate a lensing system from a galaxy group or cluster, we require that the colors of the possible lens images differ by more than two magnitudes from that of the lensing galaxy. This color difference is much larger than the observed color range of cluster ellipticals (e.g. Goto et al., 2002). This color difference cut was adopted to test our preliminary selection method and to reduce possible contamination of neighbor galaxies around red galaxies. While cluster ellipticals are red and tend to be undetected in , background lensed galaxies are often quite blue and have very different colors. We discuss refinement of this color cut in §5.
In most strong quadruple lensing systems we expect to find at least two bright knots on one side of the lensing galaxy 111The case of double images is discussed in §5.. We therefore require that the angle between the two companion objects with respect to the possible lensing galaxy be less than 90∘. Even though the surface brightness of the arc may not be high enough to appear in the SDSS images, the positions of the bright knots are precise enough to check whether the positions of the photometric objects are consistent with a lensing system.
Finally, we eye-inspect the objects that satisfy our criteria. We found 38154 galaxies that satisfy the color cut and have at least one companion with color difference of more than two magnitudes in the separation bin of 24 and 36. Among the galaxies found, 1644 objects have more than one companion. But only 38 objects have an angle of less than 90∘ between the two lens images; these we examine by eye.
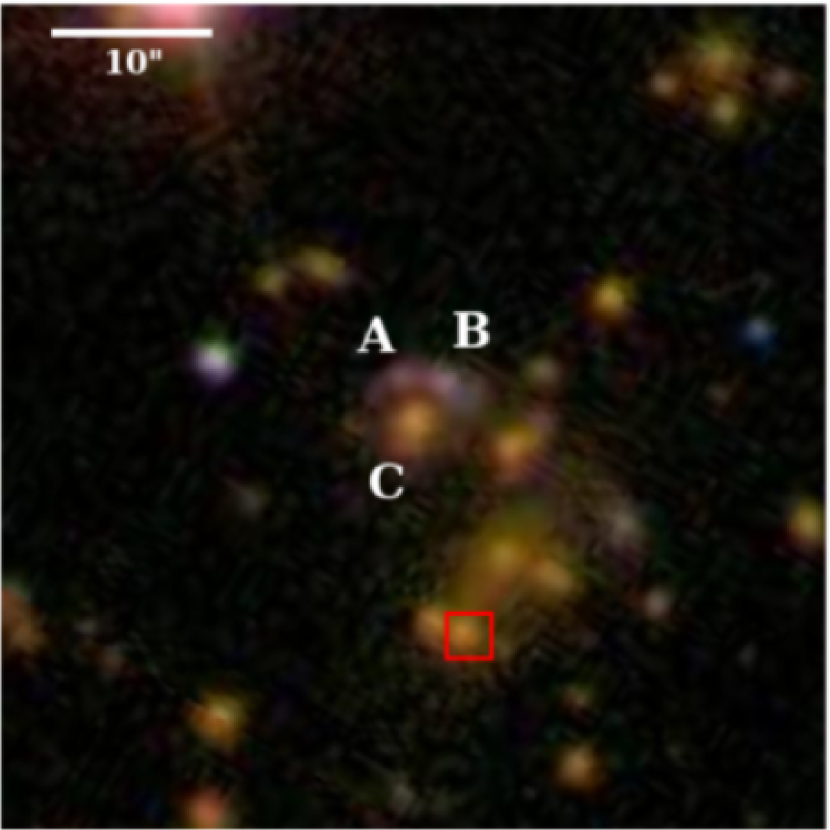
From its appearance in the SDSS images (Figure 1), SDSS J082728.83+223253.9 (G) was the most promising lensing galaxy in our search. The basic SDSS photometry data are given in Table 1. The model magnitude color of this elliptical galaxy is 4.48 without Galactic extinction correction. The lensing galaxy is undetected in , as expected for a red elliptical. Therefore, the color of the lensing galaxy should be interpreted as a lower limit. Meanwhile, the lens images are deblended as three photometric objects: SDSS J082728.87+223256.5 (A), SDSS J082728.70+223256.4 (B), and SDSS J082728.86+223252.6 (C). The first two objects are classified as galaxies by the SDSS software while the last one is star-like. The distances of objects A and B from the lensing galaxy are 30, and satisfy our selection criteria. Although image C is also close to the lensing galaxy, its model magnitude in the -band is fainter than 23 mag, and therefore was not selected by our criteria. The angle between images A and B is 40°, i.e. less than 90°. Images A and B have = 0.36 0.65 and without Galactic extinction correction, respectively. The larger color error for A simply reflects the fact that it is 2 magnitudes fainter than B. The difference of between the lensing galaxy and the lens images is larger than the color error itself. The fact that two objects with different colors from the lensing galaxy are on the same side of the galaxy strongly suggests that they are images of a gravitationally lensed background galaxy.
3 FOLLOW-UP OBSERVATIONS
3.1 APO 3.5m Spectroscopy
We observed the brightest object A using the Double Imaging Spectrograph (DIS) of the Astrophysical Research Consortium 3.5m telescope at Apache Point Observatory (APO) on 2006 December 17 (UT). We set the two gratings to cover the wavelength ranges from to and from to , with dispersions of 1.83 per pixel and 2.31 per pixel for the blue and red channels of DIS, respectively. We exposed for 2400 seconds using a 15 slit. The spectrum given in Figure 2 has signal-to-noise ratio of 7.5 per pixel around , allowing us to measure the redshift and to identify the characteristics of the object. The spectrum shows strong Balmer absorption lines of redshift z=0.7654 0.0004, characteristic of post-starburst galaxies (Goto et al., 2003). The spectrum does not show any strong emission lines. E+A galaxies are rare objects, representing % of the galaxy population at z0 (Quintero et al., 2004; Yan & DEEP2 Team, 2006), and lensed E+A galaxies are rarer still; there is only one previously known lensed E+A galaxy, at z = 1.394 (Fassnacht et al., 1996).
The spectrum has a blue continuum and shows strong absorption by MgII , although the doublet is not resolved in our low-resolution spectrum. As shown in Tremonti et al. (2007), the MgII absorption might be a feature of an outflow in this post-starburst galaxy. Because outflows in post-starburst galaxies are thought to originate from galactic winds, the spatial location of this absorption feature in the galaxy would be valuable for understanding the galactic wind scenario. Thanks to the strong lensing of this galaxy, spatially resolved spectroscopy should allow us to map the MgII absorption feature across the galaxy.
3.2 Subaru Imaging and Spectroscopy
We conducted imaging and spectroscopic follow-up observations with the Faint Object Camera And Spectrograph (FOCAS; Kashikawa et al., 2002) on the Subaru 8.2-meter telescope on 2007 January 21. The spectroscopic observation was performed with 2x2 on-chip binning with the 300B grism and SY47 filter. A 1″ slit was aligned to observe objects B and C and the lensing galaxy G simultaneously. An 1800 sec exposure was taken with seeing of . We also took 120 sec - and -band images. All the data were reduced using standard tasks in IRAF.
The spectra of the lens images B and C in Figure 2 show the same redshift as object A. The redshift of object B, z=0.7659 0.0003, is determined by the absorption lines H8, H7, H6, H, and H. The lines are also used in estimating the redshift of object C, resulting in z=0.7660 0.0007.
The spectrum of the lensing galaxy G (Figure 2) has a redshift of z= 0.3492 0.0007 based on the CaII K & H, G-band, and Mg lines. This is in good agreement with the SDSS DR5 photometric redshift (Csabai et al., 2003), 0.305 0.039. An object 132 away, SDSS J082728.62+223241.0, has an SDSS redshift of z=0.3347 0.0002. The lensing galaxy is surrounded by other red galaxies of similar color, suggesting a similar redshift. The lensing galaxy thus appears to be a member of a galaxy cluster. The case for this is strengthened by the presence of a X-ray source in the ROSAT All-Sky Survey Faint Source Catalog (Voges et al., 2000), 1RXS J082726.8+223237, that is ”, i.e. a projected distance of kpc, away from the lensing galaxy. The positional error of this faint source is ” (Voges et al., 2000), thus this position is consistent with that of the apparent cluster of galaxies. Assuming that the X-ray source is at the same redshift as the lensing galaxy, the estimated flux from the ROSAT catalog is about with the Galactic absorption correction, assuming a Raymond-Smith plasma spectrum (Raymond & Smith, 1977) or a simple power-law spectrum of index -0.5. It corresponds to a luminosity of about in the range 0.5 - 2.0 keV. This value is close to the luminosities of typical galaxy clusters (Mullis et al., 2003). The confirmation of the galaxy cluster is discussed further in §5.
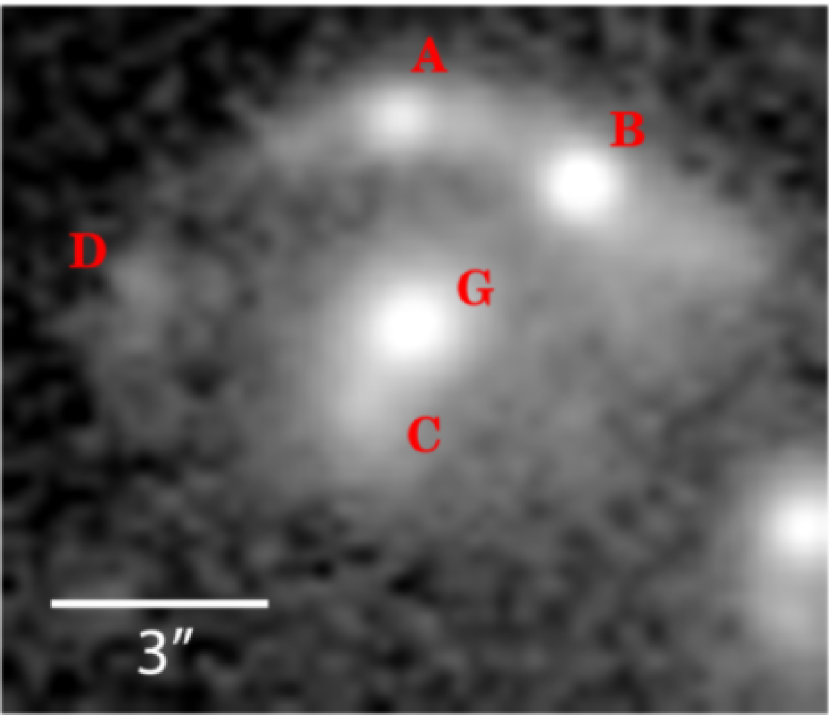
The Subaru -band image (Figure 3) shows the blue lensed objects more distinctly than SDSS, because it is deeper and has better seeing. We measure the positions of the brightness peaks using SExtractor (Bertin & Arnouts, 1996). To deblend the faintest lens image C from the lensing galaxy, we used a Mexican hat filter with a full-width at half-maximum of 06. The derived relative positions of the lens images are used to constrain a lens model in §4.
We suspect that the faint object D, at 082729.11+223253.76 in Figure 3 is the fourth lens image. In order to check this hypothesis, we measure color differences among the lens images. The color is measured through a 3″ diameter aperture. Between objects D and A, is 0.13 0.04 while between D and B is 0.20 0.04, where the errors are from photon statistics only. Given the uncertainties in deblending, this agreement is consistent with the hypothesis that D is the possible fourth lens image.
4 THE LENS MODEL
We fit a model of a singular isothermal ellipsoid (SIE) with external shear to the positions of the four components A, B, C and D system using the gravlens software (Keeton, 2001); this is the simplest model which can fit quadruple lenses in general (Keeton et al., 1997). However, the cluster environment of the lens (§5) suggest a more complicated model (e.g. Keeton & Zabludoff, 2004; Kawano et al., 2004). The perturbation of mass substructures in the lensing environment will affect the lensing magnification (e.g. Saha et al., 2007). For this reason, we do not use relative flux ratios among the lens images in constraining the lens model, but just use their relative positions.
A well-fitted lens model is found with a positional error of 02 between the derived and observed positions of lens images, as shown in Figure 4. The derived central position of the lensing galaxy is within 01 of the optical position. The required external shear is about 0.1 in this model. The direction of the critical curve is completely inconsistent with the position angle of the lensing galaxy. But this discrepancy could be explained by the dominance of the external shear. The position angle of the quadrupole term is within of the direction to the brightest cluster galaxy. This angle difference is acceptable when considering the possible offset between the position of the brightest cluster galaxy and the center of mass of the cluster, and the degeneracy between the strength and position angle of the external shear. The Einstein radius () from the fitted model is 2230.01″, corresponding to 10.8 kpc in the lens plane 222We adopt cosmological parameters of , , and h=0.72 as given in Spergel et al. (2007). The error of the represents only a fitting error of the mass parameter.. is the mass parameter of a singular isothermal ellipsoid, that is related to the velocity dispersion of the lensing galaxy as used in Keeton & Zabludoff (2004). The configuration of the source and lens images is consistent with what we expect from strong lensing in a galaxy cluster environment (e.g. King, 2007).
5 THE LENSING GALAXY
We present a simple estimation of the properties of the lensing galaxy. A detailed lensing model and other properties of lensing galaxies will be given as part of a study of a larger sample.
We can estimate a rough total mass of the lensing galaxy inside derived in the previous section:
| (3) |
where , , and are angular-diameter distances to the lensed galaxy, to the lensing galaxy, and between the two galaxies, respectively. The SDSS photometric pipeline gives a de Vaucouleurs effective radius of the lensing galaxy of 196 0.17″, or 9.5 0.8 kpc in the SDSS -band. Therefore, is roughly 1.1 effective radii. The velocity dispersion of the lensing galaxy is poorly measured at 210 130 km/s due to the low resolution of the spectrum, R = 500. With this large uncertainty, it is not meaningful to compare this velocity dispersion with that derived from the SIE model.
We next estimate a mass-to-light ratio. The model magnitude is 21.0 in the -band within 1.1 effective radii, after correction for Galactic extinction from Schlegel et al. (1998). Therefore, the absolute magnitude of the lensing galaxy is in the -band, applying the K-corrections given in Fukugita et al. (1995). The estimated of the lensing galaxy is in the -band. We have taken the absolute magnitude of the Sun to be 5.45 mag in the -band (Blanton & Roweis, 2007).
This mass-to-light ratio is higher than that of typical elliptical galaxies, 10 (Bahcall et al., 1995; Keeton et al., 1998; Wilson et al., 2001; Padmanabhan et al., 2004), and is comparable to that of a galaxy group (Bahcall et al., 1995; Parker et al., 2005). This mass-to-light ratio is acceptable when we remember that the lensing galaxy is near the center of a galaxy cluster as shown in §3.2, and the lensing is sensitive to all the projected mass. Most massive early-type galaxies reside in dense regions like galaxy clusters (e.g., Kauffmann et al., 2004). Indeed, many lensing ellipticals are known to lie in galaxy group or cluster environments (Fassnacht & Lubin, 2002; Williams et al., 2006; Auger et al., 2007), partly because of enhancement of the strong lensing probability by external convergence from dark matter in the group/cluster (Oguri et al., 2005). Note that the redshift difference between the lensing galaxy and the SDSS spectroscopic object SDSS J082726.8+223241.0 is equivalent to a radial velocity difference of 3000 km/s. This implies either that this galaxy cluster is quite massive, or that there are multiple superposed clusters along the line of sight. Further spectroscopy of galaxies in the field is needed to distinguish these cases.
Figure 5 shows the color-magnitude diagram and color distribution of galaxies within 3′, i.e. 870 kpc on the lens plane, around the lensing galaxy. The lensing galaxy appears to be a member of a galaxy cluster, although it is not the brightest member. As shown in Goto et al. (2002), the expected color of ellipticals at z 0.3 is 1.6. We select ellipticals with -band model magnitude 21.5 using the criterion that the de Vaucouleurs model fitting likelihood is 10% larger than that of the exponential model. There is a clear concentration of ellipticals around the expected 1.6. The brightest member galaxy SDSS J082728.42+223245.7 is about 10″ away from the lensing galaxy. That is, the projected distance is about 48 kpc. Therefore, the lensing might be affected by the dense central part of the galaxy cluster, as we argued above.
6 DISCUSSION & CONCLUSION
We have shown that it is possible to detect strong galaxy-galaxy lenses with photometric catalogs drawn from large multi-band imaging surveys. Thus our method can be applied to the next-generation of wide-field multi-band surveys including UKIDSS (Lawrence et al., 2007), Pan-STARRS (Kaiser, 2004), SNAP (Kim et al., 2002), LSST (Tyson, 2005), the Sky Mapper Southern Sky Survey (Keller et al., 2007), and VISTA (McPherson et al., 2003).
In SDSS and future surveys, our approach can be improved using photometric redshifts as well as color information; the precision of photometric redshifts is good enough to discriminate low-redshift elliptical galaxies from the high-redshift lensed galaxy. Moreover, photometric-redshift techniques also allow an estimate of the intrinsic colors of galaxies (Csabai et al., 2003), allowing red galaxies to be identified in a more sophisticated way than we have.
The photometric pipelines and databases of future multi-band wide-field imaging surveys must have several components in order for our approach to work. First, the detection of the lens system described in this paper was possible due to the successful deblending algorithm used by the SDSS photometric pipeline 333http://www.sdss.org/dr5/algorithms/deblend.html (Lupton et al., 2002). When the lensing arc is not bright enough to be classified as an extended object, the lens images often look like a series of disconnected, deblended knots, as we saw in Figure 1. So, we expect our approach to have better efficiency for detecting faint lensed galaxies than do image analysis methods. The second important consideration is a database which links close neighbors together, given our criteria on the angular distance between possible lensing galaxies and lensed images.
Given that our method uses position and color information only, it can easily be used with archival data in the Virtual Observatory. In particular, the application of our approach to combined catalogs over a range of wavelengths will benefit from improved photometric redshifts. For example, the recent discovery of high-redshift galaxy clusters with massive dark matter halos (e.g. Stanford et al., 2005; Brodwin et al., 2006) suggests applying our method to the database of a deep multi-band imaging survey of high-redshift clusters.
We note that our strategy has several disadvantages. First, our method is restricted by the angular resolution of the data. The poor angular resolution of SDSS, 12, does not permit us to find compact lenses. Future surveys like LSST will be much superior in that regard. Second, our selection criteria are based on our incomplete understanding of the properties of possible lensing galaxies. As we mentioned in §2, we narrowed the color range of possible lensing galaxies to increase the lensing detection probability. Third, our method will be contaminated by foreground objects mistaken as possible lens images. Improved photometric redshifts should reduce this problem.
We continue to refine our lens candidate selection method. First of all, our requirement of a color difference of more than two magnitudes between the candidate lensed and lensing galaxies is rather crude, and can be replaced with a criterion based on photometric redshifts. In addition, we can use other colors like or to separate lenses from galaxy clusters. In particular, early-type galaxies have a narrow range of color, suggesting that color differences could be better discriminant of background lensed galaxies. We can also loosen the criterion on the angular separation between the two lens images to find double lens systems, and the criterion on separation between a lensing galaxy and images also can be modified to include large-separation lenses.
We have described a new method to search for strong galaxy-galaxy lenses from the SDSS photometric catalog. We have demonstrated the use of our method with the discovery of a new strong galaxy lens. A lensing elliptical galaxy at z = 0.349 in a galaxy cluster magnifies a background post-starburst galaxy at z = 0.766, producing four images. Our selection method will be useful for future imaging surveys, with their superior depth and angular resolution.
It is possible to combine our lensing search method based on a photometric catalog with a direct image analysis method (e.g. Cabanac et al., 2007). By using both approaches, we will be able to detect various classes of lenses, ranging from faint lens images to giant arcs around galaxy clusters. For example, after selecting a possible lensing system using our method, one can easily apply the image analysis method to the selected object, reducing the time required to apply the direct image analysis approach to a massive imaging dataset.
We are refining our selection criteria and plan follow-up observations of several candidates. We will publish our full sample and present details of lens models for each object, statistical properties of the lenses, and the detection statistics of our lens sample in future papers. The high magnification that the lensing gives allows us to study the populations of these otherwise faint and distant galaxies in detail. In particular, for the lensed E+A galaxy we present here, we plan observations using an integral field unit spectrograph and adaptive optics to understand the spatial distribution of the MgII absorption and blue continuum; given a precise lensing model, we may be able to spatially resolve the outflow across the face of the galaxy.
References
- Adelman-McCarthy et al. (2007) Adelman-McCarthy, J. K., et al. 2007, ApJS, 172, 634
- Alard (2006) Alard, C. 2006, preprint (astro-ph/0606757)
- Allam et al. (2007) Allam, S. S., Tucker, D. L., Lin, H., Diehl, H. T., Annis, J., Buckley-Geer, E. J., & Frieman, J. A. 2007, ApJ, 662, L51
- Auger et al. (2007) Auger, M. W., Fassnacht, C. D., Abrahamse, A. L., Lubin, L. M., & Squires, G. K. 2007, AJ, 134, 668
- Bahcall et al. (1995) Bahcall, N. A., Lubin, L. M., & Dorman, V. 1995, ApJ, 447, L81
- Bertin & Arnouts (1996) Bertin, E., & Arnouts, S. 1996, A&AS, 117, 393
- Blanton & Roweis (2007) Blanton, M. R., & Roweis, S. 2007, AJ, 133, 734
- Bolton et al. (2006) Bolton, A. S., Burles, S., Koopmans, L. V. E., Treu, T., & Moustakas, L. A. 2006, ApJ, 638, 703
- Bolton et al. (2004) Bolton, A. S., Burles, S., Schlegel, D. J., Eisenstein, D. J., & Brinkmann, J. 2004, AJ, 127, 1860
- Bolton et al. (2007) Bolton, A. S., Burles, S., Treu, T., Koopmans, L. V. E., & Moustakas, L. A. 2007, ApJ, 665, L105
- Brodwin et al. (2006) Brodwin, M., et al. 2006, ApJ, 651, 791
- Cabanac et al. (2007) Cabanac, R. A., et al. 2007, A&A, 461, 813
- Csabai et al. (2003) Csabai, I., et al. 2003, AJ, 125, 580
- Eisenstein et al. (2001) Eisenstein, D. J., et al. 2001, AJ, 122, 2267
- Estrada et al. (2007) Estrada, J., et al. 2007, ApJ, 660, 1176
- Fassnacht et al. (1996) Fassnacht, C. D., Womble, D. S., Neugebauer, G., Browne, I. W. A., Readhead, A. C. S., Matthews, K., & Pearson, T. J. 1996, ApJ, 460, L103
- Fassnacht & Lubin (2002) Fassnacht, C. D., & Lubin, L. M. 2002, AJ, 123, 627
- Fassnacht et al. (2004) Fassnacht, C. D., Moustakas, L. A., Casertano, S., Ferguson, H. C., Lucas, R. A., & Park, Y. 2004, ApJ, 600, L155
- Fedeli & Bartelmann (2007) Fedeli, C., & Bartelmann, M. 2007, A&A, 461, 49
- Fukugita et al. (1995) Fukugita, M., Shimasaku, K., & Ichikawa, T. 1995, PASP, 107, 945
- Fukugita & Turner (1991) Fukugita, M., & Turner, E. L. 1991, MNRAS, 253, 99
- Goto et al. (2003) Goto, T., et al. 2003, PASJ, 55, 771
- Goto et al. (2002) Goto, T., et al. 2002, AJ, 123, 1807
- Gunn et al. (1998) Gunn, J. E., et al. 1998, AJ, 116, 3040
- Gunn et al. (2006) Gunn, J. E., et al. 2006, AJ, 131, 2332
- Hennawi et al. (2008) Hennawi, J. F., et al. 2008, AJ, 135, 664
- Horesh et al. (2005) Horesh, A., Ofek, E. O., Maoz, D., Bartelmann, M., Meneghetti, M., & Rix, H.-W. 2005, ApJ, 633, 768
- Inada et al. (2007) Inada, N., et al. 2007, AJ, 133, 206
- Kaiser (2004) Kaiser, N. 2004, in Presented at the Society of Photo-Optical Instrumentation Engineers (SPIE) Conference, Vol. 5489, Ground-based Telescopes. Edited by Oschmann, Jacobus M., Jr. Proceedings of the SPIE, Volume 5489, pp. 11-22 (2004)., ed. J. M. Oschmann, Jr., 11–22
- Kashikawa et al. (2002) Kashikawa, N., et al. 2002, PASJ, 54, 819
- Kauffmann et al. (2004) Kauffmann, G., White, S. D. M., Heckman, T. M., Ménard, B., Brinchmann, J., Charlot, S., Tremonti, C., & Brinkmann, J. 2004, MNRAS, 353, 713
- Kawano et al. (2004) Kawano, Y., Oguri, M., Matsubara, T., & Ikeuchi, S. 2004, PASJ, 56, 253
- Keeton et al. (1997) Keeton, C. R., Kochanek, C. S., & Seljak, U. 1997, ApJ, 482, 604
- Keeton et al. (1998) Keeton, C. R., Kochanek, C. S., & Falco, E. E. 1998, ApJ, 509, 561
- Keeton (2001) Keeton, C. R. 2001, preprint (astro-ph: 0102340)
- Keeton & Zabludoff (2004) Keeton, C. R. & Zabludoff, A. I. 2004, ApJ, 612, 660
- Keller et al. (2007) Keller, S. C., Schmidt, B. P., & Bessell, M. S. 2007, preprint (astro-ph: 0704.1339)
- Kim et al. (2002) Kim, A. G., et al. 2002, Proc. SPIE, 4836, 53
- King (2007) King, L. J. 2007, MNRAS, 382, 308
- Kochanek (2003) Kochanek, C. S. 2003, ApJ, 583, 49
- Koopmans et al. (2006) Koopmans, L. V. E., Treu, T., Bolton, A. S., Burles, S., & Moustakas, L. A. 2006, ApJ, 649, 599
- Lawrence et al. (2007) Lawrence, A., et al. 2007, MNRAS, 379, 1599
- Lenzen et al. (2004) Lenzen, F., Schindler, S., & Scherzer, O. 2004, A&A, 416, 391
- Lupton et al. (2002) Lupton, R. H., Ivezic, Z., Gunn, J. E., Knapp, G., Strauss, M. A., & Yasuda, N. 2002, Proc. SPIE, 4836, 350
- McPherson et al. (2003) McPherson, A. M., Craig, S. C., & Sutherland, W. 2003, Proc. SPIE, 4837, 82
- Muñoz et al. (1998) Muñoz, J. A., Falco, E. E., Kochanek, C. S., Lehár, J., McLeod, B. A., Impey, C. D., Rix, H.-W., & Peng, C. Y. 1998, Ap&SS, 263, 51
- Moustakas et al. (2007) Moustakas, L. A., et al. 2007, ApJ, 660, L31
- Mullis et al. (2003) Mullis, C. R., et al. 2003, ApJ, 594, 154
- Myers et al. (2001) Myers, S. T., & The Class Collaboration in Gravitational Lensing: Recent Progress and Future Goals, ASP Conference Proceedings, Vol. 237. Edited by Tereasa G. Brainerd and Christopher S. Kochanek. San Francisco: Astronomical Society of the Pacific, 2001.
- Oguri (2007) Oguri, M. 2007, ApJ, 660, 1
- Oguri et al. (2008) Oguri, M., et al. 2008, AJ, 135, 512
- Oguri et al. (2005) Oguri, M., Keeton, C. R., & Dalal, N. 2005, MNRAS, 364, 1451
- Padmanabhan et al. (2004) Padmanabhan, N., et al. 2004, New Astronomy, 9, 329
- Parker et al. (2005) Parker, L. C., Hudson, M. J., Carlberg, R. G., & Hoekstra, H. 2005, ApJ, 634, 806
- Pelló et al. (2005) Pelló, R., Schaerer, D., Richard, J., Le Borgne, J.-F., & Kneib, J.-P. 2005, in IAU Symposium, ed. Y. Mellier & G. Meylan, 373–386
- Peng et al. (2006) Peng, C. Y., Impey, C. D., Rix, H.-W., Falco, E. E., Keeton, C. R., Kochanek, C. S., Lehár, J., & McLeod, B. A. 2006, New Astronomy Review, 50, 689
- Pier et al. (2003) Pier, J. R., Munn, J. A., Hindsley, R. B., Hennessy, G. S., Kent, S. M., Lupton, R. H., & Ivezić, Ž. 2003, AJ, 125, 1559
- Quintero et al. (2004) Quintero, A. D., et al. 2004, ApJ, 602, 190
- Raymond & Smith (1977) Raymond, J. C., & Smith, B. W. 1977, ApJS, 35, 419
- Richard et al. (2006) Richard, J., Pelló, R., Schaerer, D., Le Borgne, J.-F., & Kneib, J.-P. 2006, A&A, 456, 861
- Saha et al. (2007) Saha, P. and Williams, L. L. R., & Ferreras, I. 2007, ApJ, 663, 29
- Sand et al. (2005) Sand, D. J., Treu, T., Ellis, R. S., & Smith, G. P. 2005, ApJ, 627, 32
- Schlegel et al. (1998) Schlegel, D. J., Finkbeiner, D. P., & Davis, M. 1998, ApJ, 500, 525
- Seidel & Bartelmann (2006) Seidel, G., & Bartelmann, M. 2007, A&A, 472, 341
- Seitz et al. (1998) Seitz, S., Saglia, R. P., Bender, R., Hopp, U., Belloni, P., & Ziegler, B. 1998, MNRAS, 298, 945
- Spergel et al. (2007) Spergel, D. N., et al. 2007, ApJS, 170, 377
- Stanford et al. (2005) Stanford, S. A., et al. 2005, ApJ, 634, L129
- Strauss et al. (2002) Strauss, M. A., et al. 2002, AJ, 124, 1810
- Tremonti et al. (2007) Tremonti, C. A., Moustakas, J., & Diamond-Stanic, A. M. 2007, ApJ, 663, L77
- Tucker et al. (2006) Tucker, D. L., et al. 2006, Astronomische Nachrichten, 327, 821
- Turner et al. (1984) Turner, E. L., Ostriker, J. P., & Gott, III, J. R. 1984, ApJ, 284, 1
- Tyson (2005) Tyson, A. 2005, in Astronomical Society of the Pacific Conference Series, Vol. 339, Observing Dark Energy, ed. S. C. Wolff & T. R. Lauer, 95
- Voges et al. (1999) Voges, W., et al. 1999, A&A, 349, 389
- Voges et al. (2000) Voges, W., et al. 2000, VizieR Online Data Catalog, 9029, 0
- Williams et al. (2006) Williams, K. A., Momcheva, I., Keeton, C. R., Zabludoff, A. I., & Lehár, J. 2006, ApJ, 646, 85
- Willis et al. (2006) Willis, J. P., Hewett, P. C., Warren, S. J., Dye, S., & Maddox, N. 2006, MNRAS, 369, 1521
- Wilson et al. (2001) Wilson, G., Kaiser, N., Luppino, G. A., & Cowie, L. L. 2001, ApJ, 555, 572
- Yan & DEEP2 Team (2006) Yan, R., & DEEP2 Team. 2006, in Bulletin of the American Astronomical Society, Vol. 38, Bulletin of the American Astronomical Society, 1159
- Yee et al. (1996) Yee, H. K. C., Ellingson, E., Bechtold, J., Carlberg, R. G., & Cuillandre, J.-C. 1996, AJ, 111, 1783
- York et al. (2000) York, D. G., et al. 2000, AJ, 120, 1579
| object | coordinate | u | g | r | i | z |
|---|---|---|---|---|---|---|
| A | SDSS J082728.87+223256.5 | 21.93 0.62 | 21.57 0.19 | 24.23 2.29 | 23.39 1.96 | 21.27 0.95 |
| B | SDSS J082728.70+223256.4 | 20.17 0.07 | 20.18 0.03 | 20.27 0.05 | 19.42 0.03 | 19.38 0.09 |
| C | SDSS J082728.86+223252.6 | 22.52 0.27 | 24.11 0.40 | 24.80 0.66 | 23.9 0.59 | 22.39 0.43 |
| G | SDSS J082728.83+223253.9 | 24.93 2.07 | 20.45 0.04 | 18.86 0.02 | 18.24 0.02 | 17.82 0.03 |
Note. — Galactic extinction correction is not applied in this table.