The Second Survey of the Molecular Clouds in the Large Magellanic Cloud by NANTEN I: Catalog of Molecular Clouds
Abstract
The second survey of the molecular clouds in 12CO ( = 1–0) was carried out in the Large Magellanic Cloud by NANTEN. The sensitivity of this survey is twice as high as that of the previous NANTEN survey, leading to a detection of molecular clouds with . We identified 272 molecular clouds, 230 of which are detected at three or more observed positions. We derived the physical properties, such as size, line width, virial mass, of the 164 GMCs which have an extent more than the beam size of NANTEN in both the major and minor axes. The CO luminosity and virial mass of the clouds show a good correlation of with a Spearman rank correlation of 0.8 suggesting that the clouds are in nearly virial equilibrium. Assuming the clouds are in virial equilibrium, we derived an -factor to be cm-2 (K km s-1)-1. The mass spectrum of the clouds is fitted well by a power law of () above the completeness limit of . The slope of the mass spectrum becomes steeper if we fit only the massive clouds; e.g., () for .
1 Introduction
Star formation requires cool and high-density ISM in which most of the hydrogen is in molecular form so that the studies of distribution and properties of the molecular clouds are very important to understand the star formation processes. Emission from the tracer CO molecule has been widely used to estimate the distribution and amount of H2 in the Galaxy and other galaxies. Nevertheless, the CO lines in dwarf irregular galaxies are relatively weak (e.g., Ohta et al. 1993), making the surveys of molecular clouds toward the dwarf galaxies difficult.
The Large Magellanic Cloud (LMC) is one of the nearest galaxies to our own. Studies of this galaxy have provided valuable information for our understanding of the universe and galaxies concerning various aspects, including the evolution of stars and stellar clusters, owing to its unrivaled closeness to the solar system ( 50 kpc) and favorable viewing angle. The LMC also provides a unique opportunity for studying molecular clouds and star formation in galaxies whose environment is different from that in the Galaxy. In the LMC, the gas-to-dust ratio is 4 times higher (Koornneef 1982) and the metal abundance is about 3 to 4 times lower (Rolleston, Trundle, & Dufton 2002; Dufour 1984) than that of the Galaxy.
For these reasons, the LMC has been surveyed at a wide variety of wavelengths. H I maps of moderate (15′) to high (1′) angular resolution have been obtained with the Parkes 64 m telescope (McGee & Milton 1966; Rohlfs et al. 1984; Luks & Rohlfs 1992) and with the Australian Telescope Compact Array (e.g., Kim et al. 1998), respectively. These studies have shown that the H I distribution is dominated by many features, like filaments, shells, or holes. The ionized-gas content has been investigated with the aid of H photographs (e.g., Henize 1956; Davies et al. 1976; Meaburn 1980; Kennicutt & Hodge 1986) and the radio continuum (e.g., Haynes et al. 1991; Filipovic et al. 1996; Dickel et al. 2005). The H and radio continuum images show a variety of interstellar shells, ranging from small supernova remnants to large supergiant shells more than a few 100 pc across. The stellar contents of the LMC have been widely studied by photometry of the stars from NIR to optical bands (e.g., Ita et al. 2004, Zaritsky et al. 2004, Blum et al. 2006, Kato et al. 2006). Especially, the stellar clusters and associations in the LMC have been surveyed and cataloged by many authors (e.g., Lucke & Hodge 1970; Hodge 1988). Bica et al. (1996) estimated the ages of 504 stellar clusters and 120 associations based on their color indices in the bands. Soft X-ray images of the LMC have also been obtained by the ROSAT satellite (Snowden & Petre 1994), revealing a variety of discrete sources, like supernova remnants, X-ray binaries, supersoft sources, and also diffuse sources associated with superbubbles and supergiant shells. Recent Spitzer observations cover of the entire LMC revealing the distribution and properties of the dust, YSOs, and evolved stars (Mexiner et al. 2006).
Studies of molecular gas in the LMC began with the observations with either low angular resolution or a small spatial coverage. Cohen et al. (1988) obtained the first complete CO map of the LMC with the southern CfA 1.2 m telescope at CTIO. However, the survey was limited by the low spatial resolution, corresponding to 130 pc at the distance of the LMC. High-resolution CO observations of selected regions by the SEST 15 m telescope have been performed in the LMC (e.g., Israel et al. 1986; Johansson et al. 1994; Caldwell & Kutner 1996; Kutner et al. 1997; Johansson et al. 1998; Israel et al. 2003). They have mapped some of the well-known HII regions, for example, 30 Doradus, N 11, and the molecular cloud complex extending some 2 kpc south of 30 Doradus. Although these observations revealed detailed structure of the individual molecular clouds at a linear resolution of less than 10 pc, they are limited in spatial coverage, about one square degree.
Fukui et al. (1999) carried out and completed a survey of the LMC in CO 1–0 by NANTEN, a 4 m radio telescope installed at the Las Campanas Observatory, Chile to reveal a molecular gas distribution with resolution high enough to identify individual molecular clouds in the LMC. The 3 noise level of the velocity-integrated intensity was 1.8 K km s-1. This corresponds to cm-2, by using a conversion factor of cm-2(K km s-1)-1 (see section 4.2). The first results are presented in Fukui et al. (1999) with particular emphasis on the formation of populous clusters. The catalog of 107 molecular clouds and a comparison of these molecular clouds with HI distribution are described by Mizuno et al. (2001b). A comparison with the young stellar clusters and HII regions are the subjects of Yamaguchi et al. (2001c). The comparisons of the molecular clouds with HI gas and infrared emission by IRAS were made by Sakon et al. (2006) and Hibi et al. (2006).
In order to have more comprehensive understanding of the distribution and properties of the molecular clouds in the LMC, a survey in CO 1–0 with a sensitivity higher than that of the first survey has been carried out since 1999. Preliminary results focussing on the mass spectrum of this survey are presented by Fukui et al. (2001) and on the comparison of the molecular clouds with super giantshells by Yamaguchi et al. (2001a and 2001b). Hughes et al. (2006) made a comparison of Radio, FIR, HI and CO in the LMC and revealed the correlation of radio and FIR distributions.
In this paper, we present a catalog and properties of the molecular clouds from the complete dataset of the second survey. Comparisons of the molecular clouds with the indication of the formation of clusters and massive stars detected in optical or radio are found in elsewhere (Fukui 2005; Kawamura et al. 2006; Kawamura et al. 2008, “Paper II”, hereafter). Fukui (2007) introduces a comparison of the molecular clouds with HI gas distribution. The detailed studies of the HI and molecular gas distribution to seek for the molecular cloud formation will be presented in Fukui et al. (2008, “Paper III”, hereafter). In this paper, the survey by NANTEN is described in Section 2 and the spatial distribution and a catalog of molecular clouds are presented in Section 3. We also discuss the correlations among cloud properties, such as and the virial mass of the molecular clouds and mass spectrum in Section 3. A comparison of the cloud properties from the first survey and the discussion of the CO to (H2) conversion factor are presented in Section 4. Section 5 summarizes the paper.
2 Observations
We carried out sensitive CO(1–0) observations toward the LMC by NANTEN, a 4 m radio telescope of Nagoya University at Las Campanas Observatory, Chile. The half-power beam width was at 115 GHz. The telescope had a 4 K cooled Nb superconductor-insulator-superconductor mixer receiver, which provided a system noise temperature of 170–270 K, including the atmosphere toward the zenith.
The spectrometers were two acoust-optical spectrometers with 2048 channels; one had a velocity coverage and a resolution of 100 km s-1 and 0.1 km s-1, respectively. The other had a velocity coverage and a resolution of 650 km s-1 and 0.65 km s-1, respectively. The pointing accuracy was better than , as checked by optical observations of stars with a CCD camera attached to the telescope, as well as by radio observations of Jupiter, Venus, and the edge of the Sun. Further details about the telescope and related instruments are given by Ogawa et al. (1990) and by Fukui and Sakakibara (1992). The spectral intensities were calibrated by employing the standard room-temperature chopper wheel technique (Kutner & Ulich 1981). An absolute intensity calibration was made by observing Orion-KL [R.A. (B1950) = , Decl. (B1950) = 5∘24′] by assuming its absolute temperature to be 65 K. We also observed the strongest peak position of the LMC, N 159 [R.A. (B1950) = , Decl. (B1950) = 69∘47′] every 2 hours to confirm the stability of the system.
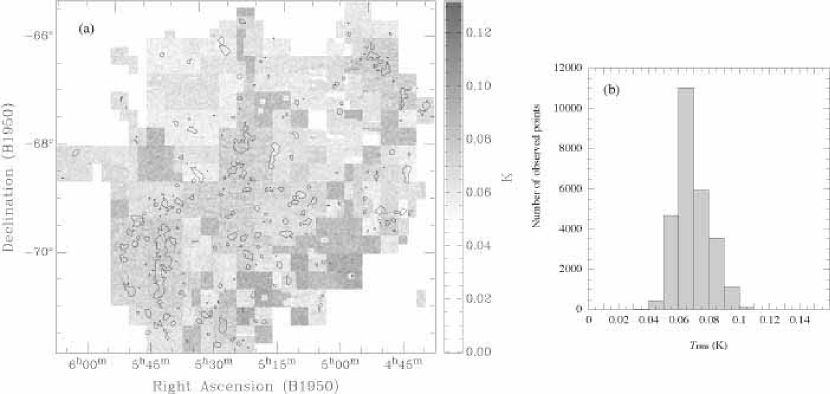
The observed region covers square degrees where the molecular clouds were detected by the 1st survey. Figure 1 shows the observed region from 1998 April to 2003 August, superposed on the integrate intensity map of the CO from the 1st survey (Fukui et al. 1999; Mizuno et al. 2001b). In total, about 26,900 positions were observed in Equatorial coordinate (B1950) in position switching. The observed grid spacing was 2 (corresponding to 30 pc at a distance of the LMC, 50 kpc) with a 2.6 beam ( 40 pc). Out of the 26,900 positions, 6,229 were observed with the narrow band spectrometer for days from April to November 1998, while the rest were observed with the wide band spectrometer for days after March 1999. In this paper, all the spectra observed by the narrow band spectrometer are smoothed to 0.65 km s-1 resolution for the reduction to have a uniform velocity resolution throughout the map. The rms noise fluctuations were 0.07 K at a velocity resolution of 0.65 km s-1 with 3 minutes integration for an on-position. The typical 3 noise level of the velocity-integrated intensity was 1.2 K km s-1. This corresponds to cm-2, by using a conversion factor of cm-2(K km s-1)-1 (see section 4.2).
3 Results
3.1 Overall distribution
Out of the observed positions, significant 12CO ( = 1–0) emission, with an integrated intensity greater than 1.2 K km s-1 (the noise level), was detected at about 1,300 positions, which corresponds to of the total observed positions. The total velocity-integrated intensity distribution of the molecular gas is shown in Figure 2.
The mass of the molecular gas in total is if we use the CO luminosity to hydrogen column density conversion factor, -factor, to be cm-2 (K km s-1)-1 (see section 4). The CO distribution of the LMC is found to be clumpy with several large molecular cloud complexes contrary to the HI gas distribution, which is composed of many filamentary and shell-like structure (e.g., Kim et al. 1999). These clumps of the molecular gas tend to be detected toward the intensity peak of the HI gas as shown in Blitz et al. (2006), Fukui (2007), and Paper III. The cloud complex south of 30 Doradus at (J2000) and (J2000) from to is remarkable stretching in a nearly straight line from the north to south, as already noted by the previous CO observations (Cohen et al. 1988; Fukui et al. 1999; Mizuno et al. 2001b). The current survey shows that this molecular cloud complex, “the molecular ridge”, is actually connected to one another by a low-density molecular gas, while the 1st survey traced only the densest regions and identified the molecular ridge to consist of two or three discrete entities. The arc-like distribution of molecular clouds along the southeastern optical edge of the galaxy (“CO Arc” in Fukui et al. [1999] and Fukui [2002]) is also clearly seen. The current sensitive survey confirms that this “CO Arc” indeed clearly represent an arc-like edge of the molecular gas distribution in this eastern boundary of the LMC.
Other CO clouds are distributed over the observed area with moderate concentration towards several prominent H II regions (e.g., N 44 at (J2000) and (J2000) , N11 at (J2000) and (J2000) ) and the “bar” (e.g., clouds around and ). The small molecular clouds are more clearly observable in the current survey, especially, toward a supergiant shell, LMC4, at (J2000) – and (J2000) – (see also Yamauguchi et al. 2001a). A detailed comparison of the molecular gas with the indicators of star formation, such as H or radio continuum will be discussed in elsewhere (Paper II).
Figure 3 is a histogram of the integrated intensity, , of the each observed position with K km s-1 ( noise level). About 980 observed positions have (H2) cm-2, while only 4 positions have (H2) cm-2.
Figure 4a shows the radial distribution of CO emission; the surface density, , is derived by integrating the CO luminosity within annuli spaced by 4 and then divided by an area of the annuli. The center used is (J2000), (J2000) determined from the kinematics of the HI observations by Kim et al. (1998). To see the angular distribution of the CO emission, the distribution of the surface density, , derived by integrating CO luminosity over a sector with a width and then divided by an observed area of the sector is also shown in Figure 4b. The CO luminosity to mass conversion is carried out by assuming a conversion factor, , of cm-2(K km s-1)-1 (see Section 4.2) for both. Figure 4 indicates that the radial profile of the molecular gas decreases moderately along the galacto-centric distance as is also seen in the nearby spiral galaxies (e.g., Wong et al. 2002), although the profile does not really fit to a power law as they do for the spiral galaxies by Wong et al. (2000). It is interesting to note the sharp enhancement of the surface density around 2 kpc. This enhancement is due to the molecular cloud complexes, the molecular ridge, N11, and N44. This enhancement is also seen in the angular distribution, especially at about due to the molecular ridge. Compared with the nearby galaxies by Wong et al. (2002), the local enhancement of the molecular gas is more conspicuous in the LMC.
Figure 5a–l are a series of channel maps to show the velocity distribution; they present channel maps with velocities at (a) 200–210 km s-1, (b) 210–220 km s-1, (c) 220–230 km s-1, (d) 230–240 km s-1, (e) 240–250 km s-1, (f) 250–260 km s-1, (g) 260–270 km s-1, (h) 270–280 km s-1, (i) 280–290 km s-1, (j) 290–300 km s-1, (k) 300–310 km s-1, and (l) 310–320 km s-1, respectively.
In the velocity range 200–240 km s-1, the CO Arc in the southeastern boundary of the LMC and the molecular ridge from the south of 30 Doradus are prominent. The two molecular-cloud complexes associated with active star-forming regions N 11 and N 44 are also prominent in the velocity range between 270–290 km s-1. A systematic velocity gradient from the southeast to the northwest has been known from the 1st survey (Mizuno et al. 2001b). Our sensitive survey shows a clear feature in the northeast at high velocities, corresponding to LMC 4, in addition to the overall velocity gradient already observed in the 1st survey. Detailed comparisons of the velocity and spatial distributions of the HI and CO emission will be presented in Paper III.
3.2 Identification of CO molecular clouds
To study the properties of the molecular gas in the LMC, individual cloud was identified by the cloud finding algorithm, fitstoprops (Rosolowsky & Leroy 2006). First, the intensity data cube is converted to a signal-to-noise data cube by dividing through by the noise at each position to search for significant emission by clipping the maps at a constant signal-to-noise ratio; a constant signal-to-noise ratio is used instead of a constant flux density threshold although the sensitivity variation across the map is not large (Figure 6). Then, pairs of adjacent velocity channels with normalized flux greater than 3 were searched for. For each pair, these velocity channels and all contiguous data pixels with normalized flux greater than 2 were assigned to a candidate molecular cloud. This process was continued until all the pairs of adjacent channels with normalized flux greater than 3 have been identified as candidate clouds.
We identified 272 clouds, of which 230 were detected at more than two observed positions. In this paper, we shall call these 230 clouds with more than two observed positions “the GMCs”. The position and intensity-weighted mean velocity of the 230 GMCs, and the rest (“the small clouds”, in the following) are listed in Tables 1 and 2, respectively.
The sensitivity of a dataset influences the cloud properties derived from that data as emphasized by Rosolowsky & Leroy (2006). In order to reduce the observational bias, and to be able to compare datasets with different signal-to-noise levels, the boundary of cloud is extrapolated to a boundary isosurface of K (see also Blitz & Thaddeus 1980; Scoville et al. 1987). The major and minor axes, size, , position angle, PA, and virial mass, are derived for 164 GMCs (“Group A GMCs”, hereafter) out of 230; the rest (“Group B”, hereafter) have a minor axis less than the NANTEN beam, so that the size is not derivable by using the de-convolved moment. The line width, , and the CO luminosity, , are less sensitive to the beam dilution than the cloud size, so that we can determine and of the both Group A and B GMCs. Then, , the molecular cloud mass, is derived from by using cm-2 (K km s-1)-1 as derived in Section 4.2 by assuming an virial equilibrium, and the mass fraction of helium to be 36 %. The procedure to derive these properties is described by Rosolowsky & Leroy (2006) in detail. The derived properties are presented in Table 3.
3.3 Properties of the Molecular Clouds
In this section, we shall consider the Group A GMCs, which are resolved by NANTEN. The Group A GMCs have radii ranging from 10 to 220 pc, line widths between 1.6 and 20.2 km s-1, CO luminosity between and K km s-1 pc2, and virial masses ranging from to .
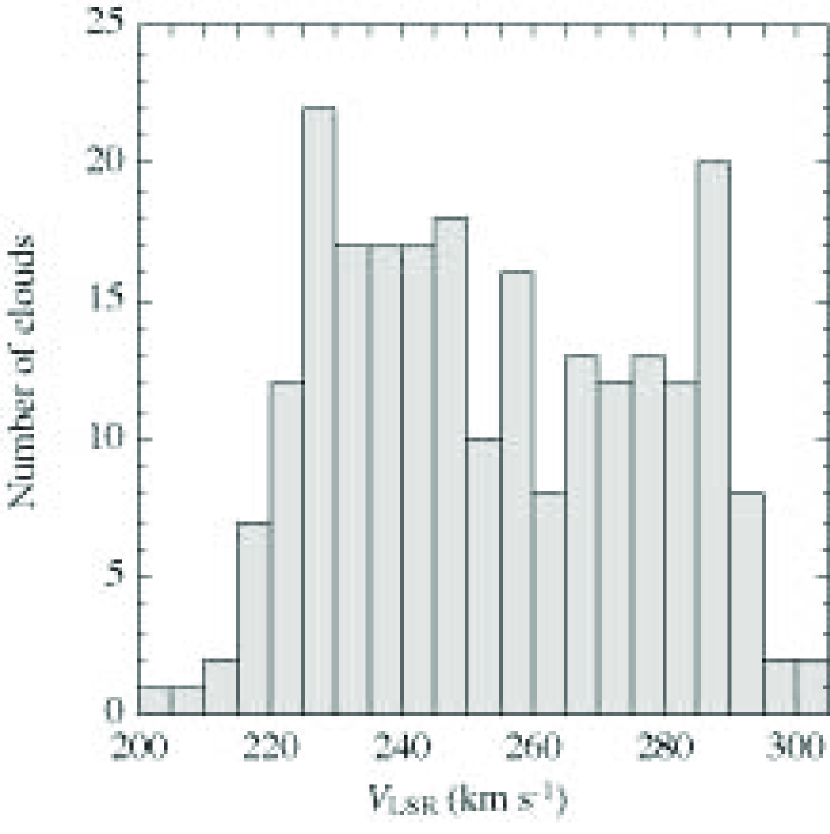
Figure 7 shows the frequency distribution of the of the clouds. The distribution is rather nonuniform having peaks at 220–250 km s-1 and 280–290 km s-1. The one at 220–250 km s-1 represents the clouds in the southern part of the LMC including the molecular ridge and the CO Arc as seen in Figures 5c–e. The other at 280–290 km s-1 is dominated by the emission from the LMC 4, N44, and N11 regions (Figures 5i–j).
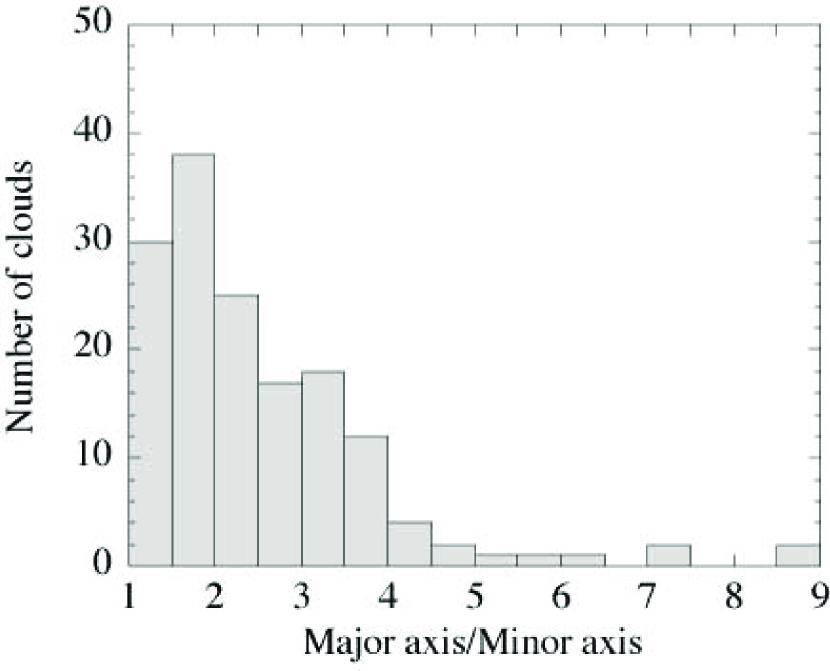
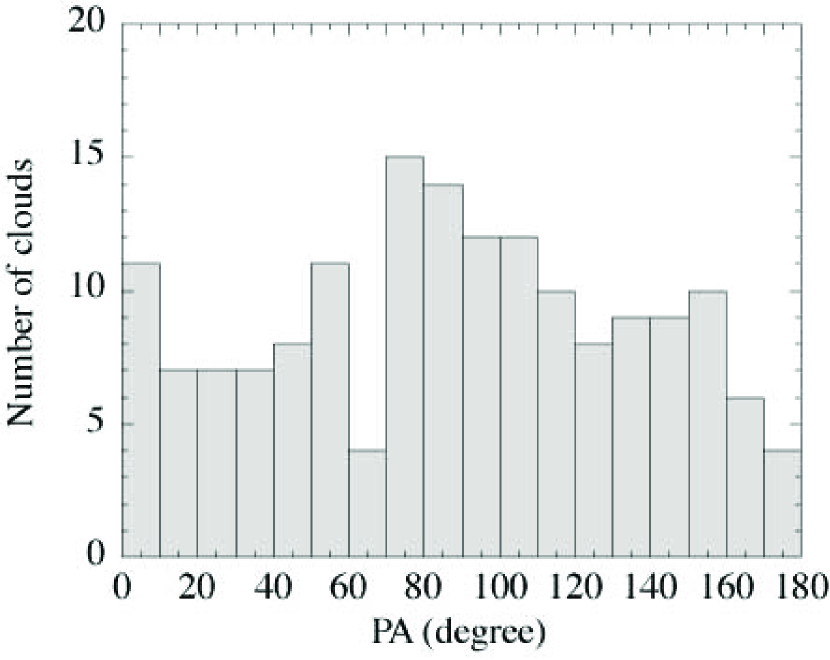
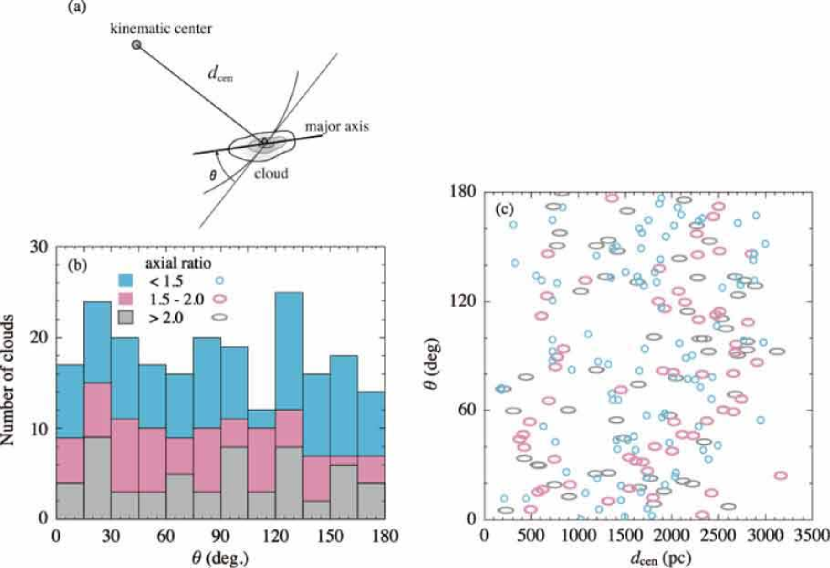
Figures 8 and 9 are the histograms of the ratio of the major and minor axes and the position angle (PA) of the GMCs, respectively. The frequency distribution of PA is rather uniform. The distribution of the ratio of the major and minor axes has a peak at with an average of 2.5, indicating that cloud are generally elongated.
In order to see if the cloud has an alignment with the large-scale structure of the galaxy, such as a spiral pattern, here we introduce a parameter, , the angle between the major axis and the tangent at the molecular cloud of a circle with a radius, (Figure 10a). Figure 10b shows the frequency distribution of . Since the uncertainties of the position angle as well as depend on the ratio of the major and minor axes, the histogram of is divided into three groups according to the axial ratio. The histogram of shows the number distribution is nearly uniform and do not have any particular favorable angles. To see if the distribution of has any characteristics with the galacto-centric distance, Figure 10c shows a plot of versus . Again, the plots are distributed quite uniformly showing no strong dependence of on .
3.3.1 Line-width - size relation
In this section, we present the correlation between the line width and the radius of the GMCs.
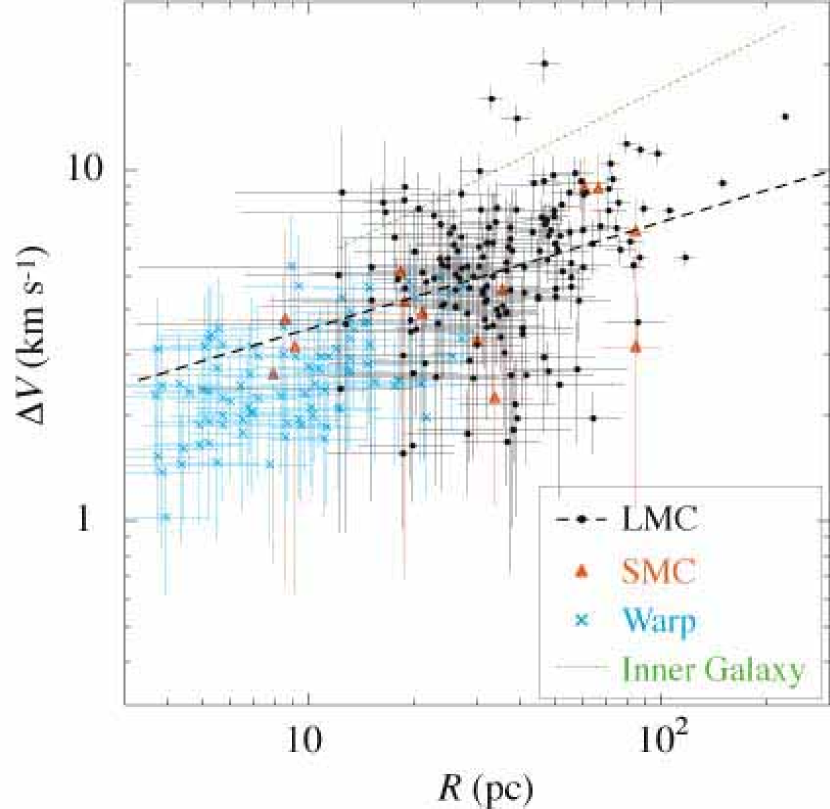
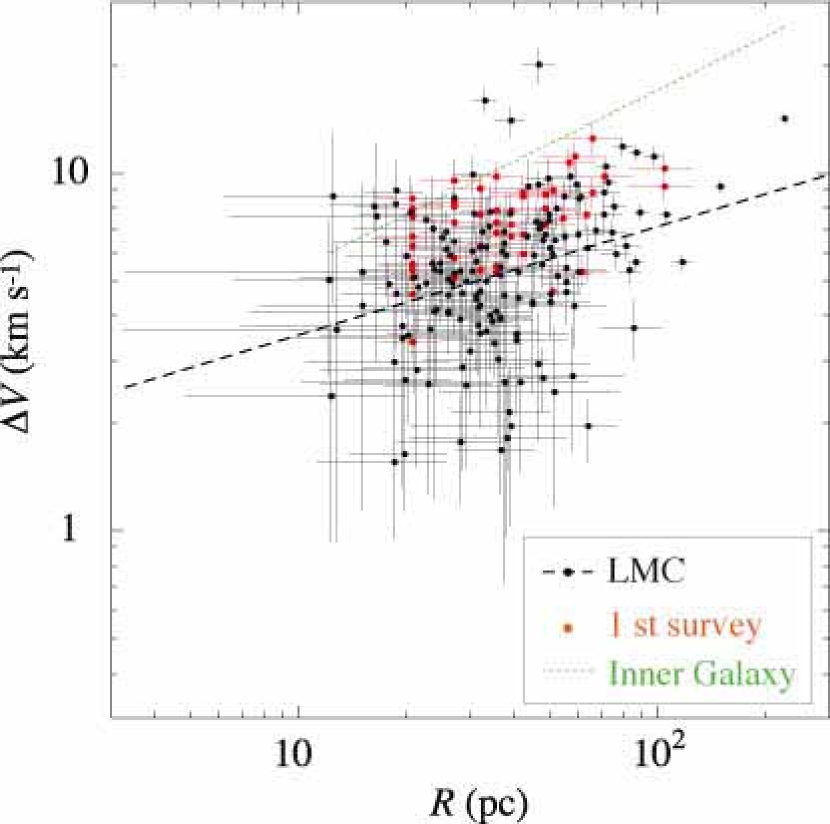
The size, , of the cloud is computed as a geometric mean of the “de-convolved” second spatial moments along the major and minor axes which were derived by using the principal component analysis: we “de-convolve” the beam by subtracting its size from the measured cloud size in quadrature. A full width at half maximum (FWHM) line width, , is derived by multiplying the moment of the velocity within a GMC by (see also Rosolovsky & Lorey 2006). Figure 11 shows a plot of log () versus log () of the Group A GMCs. It has been known that the line width and the size of molecular clouds have a good correlation of in the solar vicinity (Larson 1981) and in the inner Galaxy (e.g., Dame et al. 1986; Solomon et al. 1987), while the correlation in the GMCs in this work is rather weak, and the best fitting power law is .with Spearman rank coefficient of 0.3. It is likely that the lack of the dynamic range in size may make the correlation lower in the present study than for the Galactic clouds, although we see a weak positive-correlation in the LMC GMCs.
We have applied the cloud identifying algorithm by Rosolowsky & Leroy (2006) with the parameters used in the current study to identify the GMCs in the LMC to the molecular clouds in the Small Magellanic Cloud (SMC, Mizuno et al. 2001a) as well as in the outer Galaxy, the Warp region (Nakagawa et al. 2005) and derived the physical properties. When we add the clouds in the SMC and the Warp region to the plot of Figure 11a, the dynamic range in becomes larger and the positive correlation is seen. A line width-size relation in the inner Galaxy by Solomon et al. (1987) as an example is also shown as a dotted line in Figure 11. The correlation between the line width and size of the clouds in the LMC, SMC and the Warp region does seem to be consistent with a power law relation but with a clear offset from the relation determined for the inner Galaxy (Solomon et al. 1987). One has to note that at least a part of this offset can be attributed to differences in the methods used to measure cloud properties. The sense of the offset is that for a given radius, the clouds in the inner Galaxy have larger line widths. This may be partially due to the relatively high value of used by Solomon et al. (1987) to define the cloud radius, implying that the clouds might be smaller for a given value of .
3.3.2 Virial Mass - CO Luminosity Relation
The determination of the mass of molecular-hydrogen gas is fundamental for understanding the physics of the interstellar medium and star formation in galaxies. In this subsection, we compare the virial mass and the CO luminosity, and discuss the conversion factor from the CO line intensity to the H2 column density in the LMC.
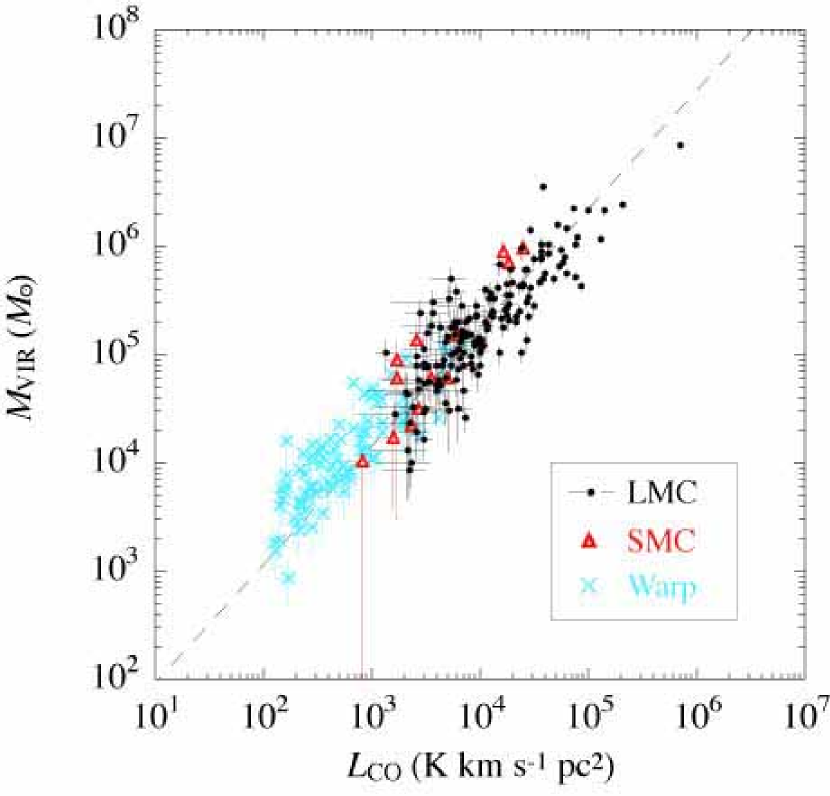
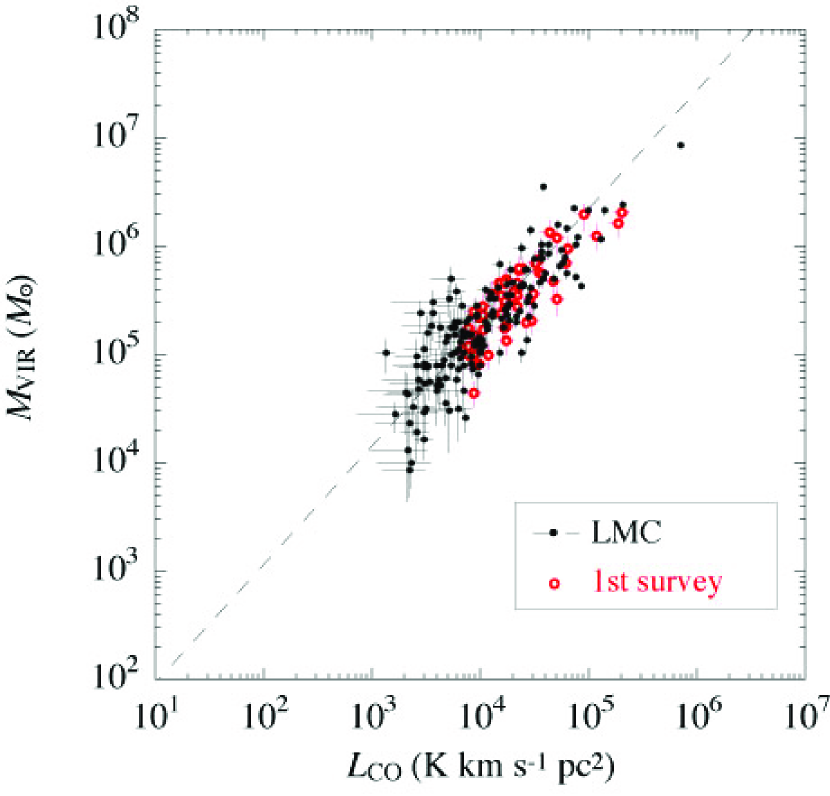
Figure 12 shows the virial mass, , as a function of luminosity, , of the clouds in the LMC (filled circle). The plot shows a tight power law for the mass luminosity relation with some dispersion. A least-squares fit to the data gives a power law, [/]= 26[/(K km s-1 pc2)]1.1±0.3, with Spearman rank correlation of 0.8. This relation suggests that clouds are virialized and CO luminosity can be a good tracer of mass in the LMC with a quite constant conversion factor from to mass throughout the mass range . We have added the re-identified clouds in the SMC (Mizuno et al. 2001a) and the Warp region (Nakagawa et al. 2005) to Figure 12 as in Section 3.3.1. The clouds in the SMC and the Warp region lie along the best fitting power-law of GMCs in the LMC.
3.3.3 Mass Spectrum
The frequency distribution of the cloud masses has an important impact not only in the star formation but also in cloud formation and destruction. The mass spectrum of the clouds is well fitted by a power law and often presented as or () . The preliminary results of the mass spectrum by the second NANTEN survey in the LMC have been already presented and discussed in Fukui et al. (2001). They found the mass spectrum derived from the CO luminosity has a slope with above the completeness limit of .
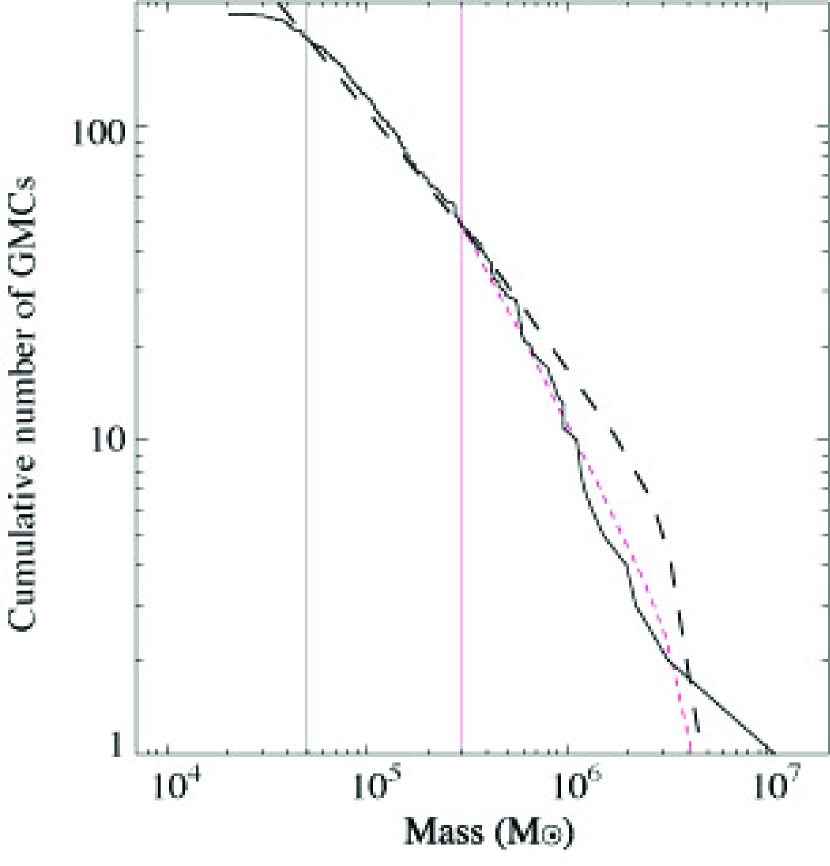
In this section, we present the mass spectra of the mass, , derived from a CO luminosity, , and a conversion factor, cm-2 K km s-1 (section 3.2 and section 4.2). Here, the CO luminosity, , is less sensitive to the beam dilution than the cloud size, so that we can consider that not only the Groups A GMCs but also the of the Group B GMCs, which we could not derive a size and , are determined well enough to obtain (Section 3.2 and Table 3). The mass spectrum of including both the Group A and B GMCs, is shown in Figure 13. The maximum likelihood method (Crawford et al. 1970) was applied to obtain the best-fitting power law above the completeness limit, . The best fitting power law above the completeness limit is () = .
The results indicate that mass of the molecular gas in the LMC is concentrated in the massive clouds, since . The slope of the mass spectrum, thus the fact that the massive clouds contribute to the galactic total mass, is consistent within the current results as well as with what is presented by Fukui et al. (2001), although the current result shows shallower slope than the other. This difference in the index values of the best-fitting power law may be explained by the difference in completeness limit. Table 4 shows the index value, , of the power law fit to the different mass range of the GMCs. The best fitting power law obtained for the clouds with is shown in Figure 13 as an example. Table 4 indicates that the slope of the mass spectrum becomes steeper if we fit only the massive clouds; e.g., () for , and the logarithmic slope of the mass spectrum becomes steeper at .
4 Discussion
4.1 Comparison with the first Survey
The 2nd survey was carried out to cover the regions where the molecular clouds are detected in the 1st survey. The signal-to-noise ratio of the present observations was higher by a factor of 2 than that in the 1st NANTEN survey (Fukui et al. 1999; Mizuno et al. 2001b; Yamaguchi et al. 2001c). This increase in sensitivity made possible to increase the number of the significant detections and identified clouds. Different cloud identification criteria are used in the current study and those used in Fukui et al. (1999) and Mizuno et al. (2001b). Nevertheless, the number of the clouds with more than two observing positions (“the large clouds in Mizuno et al. (2001b) ) is a factor of 3 larger in the present survey even if we use the same algorithm and criterion.
Here we compare the line width-size relation and virial mass-CO luminosity relation of the molecular clouds from the 1st and the current surveys. To compare the results, we re-calculated the size and the virial mass of the large clouds of the 1st survey by subtracting the NANTEN beam from the size in Table 1 of Mizuno et al. (2001b).
Figure 14 is a plot of the line width and the size of the clouds derived from both the 1st survey (open circle) and the current survey (filled circle). The clouds from both the current and the 1st survey show a large scatter with a little positive correlation of the line width and the size. An offset from the correlation of the inner Galaxy is also seen. The scatter is larger in the current survey. This may be explained by the difference in the sensitivity; the high sensitivity of the current survey made it possible to decompose a cloud into several individual clouds with different velocities along the same line of site, although these clouds may have been identified as an entity by the 1st survey.
Figure 15 is a plot of the virial mass, as a function of luminosity, , of the Group A GMCs from the current survey (filled circle) and the 55 clouds from the 1st survey (open circle). The correlations between the and in both surveys are consistent within the error. Again, the scatter in the current survey is larger, but because the higher sensitivity limit of the current survey enlarges the dynamic range in and the correlation coefficient remains as high as 0.85. The ratio of the and is related to the conversion factor, -factor, from the CO luminosity to the hydrogen column density, (H2). The consistency of the and relation in both survey suggests that the -factor derived from the both surveys are also consistent.
4.2 CO to () Conversion Factor
In the following, we derive -factor from the current survey.
The determination of the mass of H2 in galaxies is fundamental for an understanding of the interstellar physics and star formation. The principal method for obtaining H2 masses converts the intensity of the CO molecular line emission, , into the column density of H2 molecules. The conversion factor, -factor ((H2) ), has been derived for molecular clouds in the solar vicinity based on the assumption of virial equilibrium of individual clouds (e.g., Young & Scoville 1991). This method has been also used to derive the conversion factors in nearby galaxies, such as the LMC, SMC, M31, M33 and etc., where individual clouds are resolved (e.g., Mizuno et al. 2001a; Mizuno et al. 2001b; Wilson & Scoville 1990).
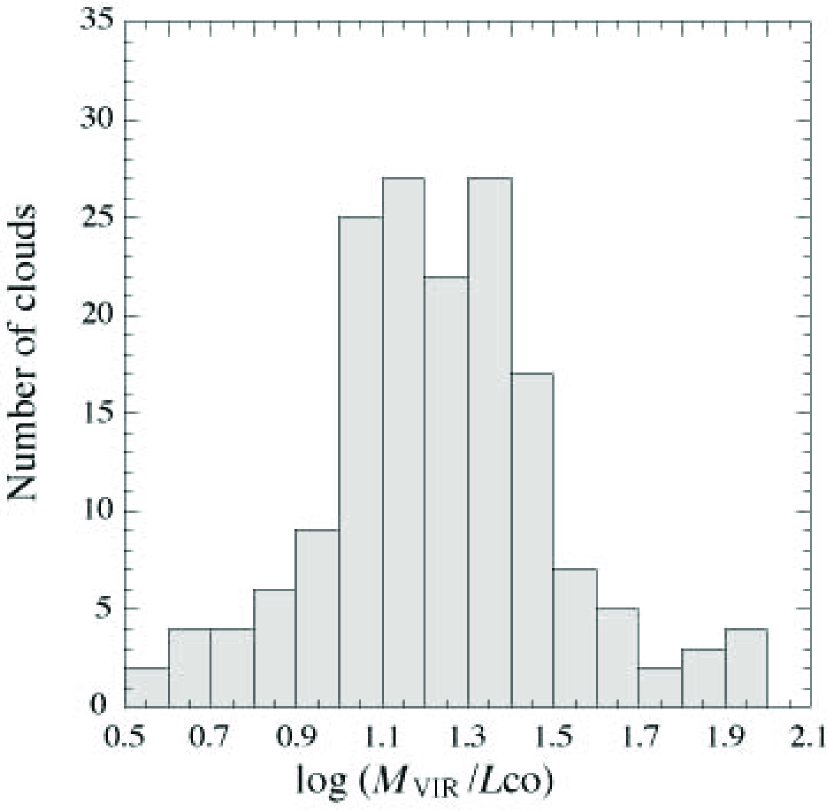
The plot of the against in section 3.3.2 (Figure 12) from the current survey suggests that for massive clouds, , it is reasonable to assume virial equilibrium. Here, we shall use the conventional method, by applying the virial theorem to the clouds to estimate the -factor in the LMC. The average value of log() is , corresponding to cm-2(K km s-1)-1, for the Group A GMCs with higher than the completeness limit, K km s-1 pc2, that is equivalent to . Figure 16 is a frequency distribution of log() of the Group A GMCs, i.e., including all the clouds for which we derived virial masses. The geometric mean of , and thus the -factor, do not differ from the values obtained by using the clouds with K km s-1 pc2 only.
This value is slightly less than what we obtained from the 1st survey, cm-2(K km s-1)-1, after taking into account the beam de-convolution, but is consistent within the error.
An -factor in the inner Galaxy has been derived by using a correlation between the ray intensity and the CO intensity along the Galactic plane (Bloemen et al. 1986). Bloemen et al. (1986) summarized the value of factors and the value for the inner Galaxy is derived to be (1–3)cm-2(K km s-1)-1 on average. The -factor obtained above is about twice higher than that of the clouds in the inner Galaxy.
Bertoldi & McKee (1992) argue that the gravitational energy, , of an ellipsoidal cloud is given by , (Eq. A9 of Bertoldi & McKee 1992) where , , and are the gravitational constant, mass and the size of the clouds. Here, is an eccentricity of the cloud, , where y is an axial ratio of the cloud. The current sample of the GMCs are not really spherical with the mode of the ratio of the major and minor axes to be and the average 2.5 as shown in section 3.3 (see also Figure 8). The shape-dependent factor, (Eq. A8 of Bertoldi & McKee 1992), ranges from 1 to 0.88 for the current sample of the GMCs in the LMC with for the axis ratio of 2.5. This argument means that the virial mass of the current sample of the GMCs differs from the derived virial mass with about 15 % at most due to the elliptical shape of the clouds. The deviations of the estimated from the true affect the derived factor linearly. Thus the current estimate of the factor can be overestimated by at most due to the discrepancy of the cloud shape from the spherical symmetry.
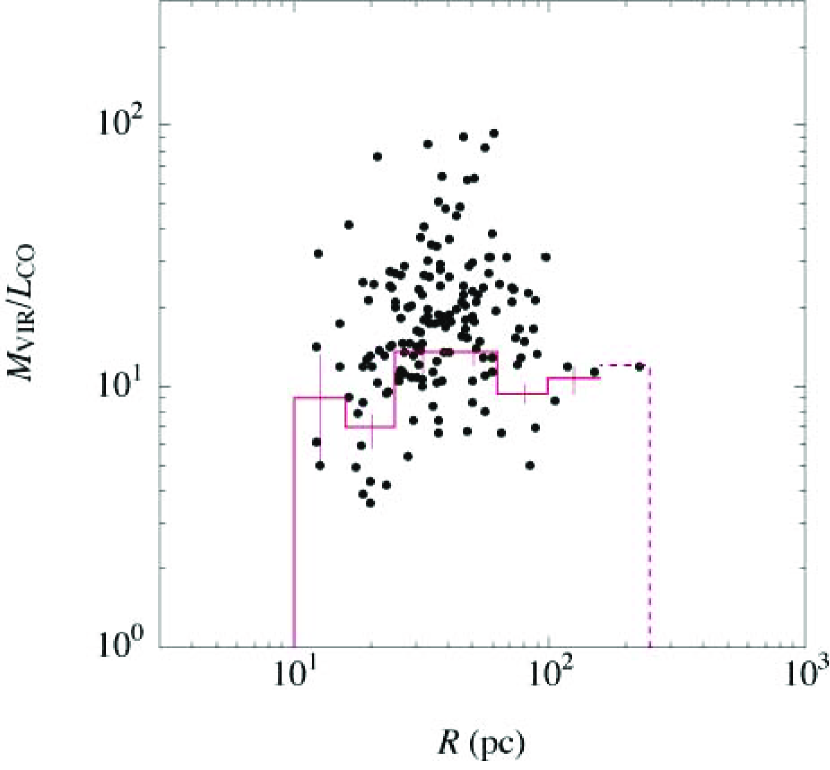
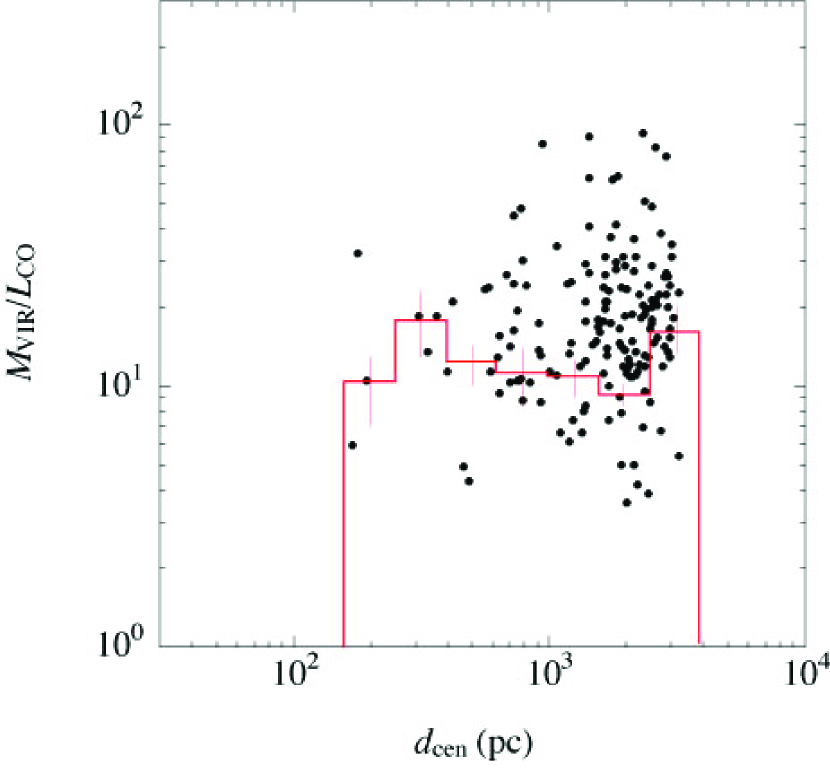
Rubio et al. (1993) suggested a possible dependence of the -factor on the cloud size from their observation toward the clouds in the SMC by SEST. Figure 17 is a plot of the against the cloud size. There is no significant correlation in the LMC clouds with scatter as large as an order of magnitude in , although the range of the cloud sizes is the same as that of the SMC (Rubio et al. 1993)
It has been claimed that the metallicity is quite uniform in the LMC (e.g., Dufour 1984), while it has been suggested that the metallicity of the outer part of a galaxy is lower than that of the inner region in the Galaxy as well as in some of the nearby galaxies (e.g., Nakagawa et al. 2005). Figure 18 shows a plot of against the distance from the center of the LMC derived from the HI distribution (Kim et al. 1998). The current result shows no clear correlation of to the distance from the center, suggesting that -factor does not depend on the distance from the center of the LMC. This is consistent with the idea that the metallicity is quite uniform in the LMC.
4.3 Mass Spectrum
The mass spectra of the Galactic clouds (12CO or13CO) are well fitted by a power law with index values of 0.5 – 1.0 (e.g., Solomon et al. 1987; Solomon & Rivolo 1989; Casoli, Combes, & Gerin 1984; Digel et al. 1996; Dobashi et al. 1996), of which the higher values are derived for the clouds with lower mass in the outer Galaxy (e.g., Heyer et al. 2001) or those derived by using the data from 13CO observations (e.g., Yonekura et al. 1997; Kawamura et al. 1998). Not only the mass distribution of the Galactic clouds but also that of the clouds in nearby galaxies have been studied (Blitz et al. 2006 and the references therein). Most of the galaxies have similar mass distributions, ; an exception is M33, which is steeper than the rest but the dataset has a higher completeness limit (Rosolowsky et al. 2003; Rosolowsky et al. 2005).
A number of numerical simulations have been conducted to obtain a mass spectrum of GMCs in galaxies (e.g., Váquez-Semadeni et al. 1997; Wada et al. 2000, and reference therein). Wada et al. (2000) carried out a simulation to the H i and CO distributions of the LMC-type galaxy specifically at the highest spatial resolution ( 7.8 pc) by incorporating fairly realistic star-formation processes and supernova rates. They show that the GMC mass spectrum in an LMC-like galaxy is expected to have a power law with an index value of if no star formation is taken into account, and that the index becomes steeper around if the dissipation of clouds due to star formation is incorporated. The present mass spectrum appears to be consistent with these values, while those of the non star-forming models may fit slightly better the present result. According to Wada & Norman (2001), the absence of a massive GMC of is due to the well-mixed, turbulent interstellar medium that tends to form smaller GMCs. The consistency of the mass spectrum among galaxies may suggest that the mechanism of cloud formation and the disruption show similar characteristics among the galaxies. Nevertheless, the truncation of very massive GMCs may suggest that the disruption of the molecular clouds is faster in the massive clouds. It may also suggest that cloud formation takes place inhomogeneously; the mass spectra in different regions of the galaxy may have different slopes and the truncation of the slope might appear when we sum up all the mass spectra within the galaxy. The reason of the truncation is not yet know but the current result present new information leading to a better knowledge of the cloud formation and disruption.
5 Summary
A large-scale 12CO( = 1–0) survey for the molecular clouds was made toward the Large Magellanic Cloud by NANTEN. An area of 30 square degrees was covered, and significant 12CO emission ( 0.07 K ) was detected at out of the 26,900 observed positions. We identified 272 molecular clouds, 230 of which were detected at more than three observing positions. The position, mean velocity and velocity dispersion of the 272 clouds, and the extents, position angle and CO luminosity of the 230 GMCs are derived. A reliable size and virial masses are determined for the well resolved 164 GMCs (Group A). The main results are summarized as follows.
-
1.
The Group A GMCs have radii ranging from 10 to 220 pc, line widths between 1.6 and 20.2 km s-1, CO luminosities between and K km s-1 pc2, masses derived from CO luminosity from to , and virial masses from to . The maximum temperature () of the CO line is as high as 2 K, which is detected toward the N 113 and N 159 regions.
-
2.
The line width, , and the radius, , of the Group A GMCs appear to satisfy the slope of the power-law in line width-size relation of the clouds in the Galaxy, but with an offset in the constant of proportionality.
-
3.
A least-squares fit to virial mass vs. CO luminosity relation shows a power law, [/]= 26[/(K km s-1 pc2)]1.1±0.3 with Spearman rank correlation of 0.8. This good correlation shows that the CO luminosity is a good tracer of the mass of molecular clouds in the LMC.
-
4.
The –(H2) conversion factor is found to be cm-2(K km s-1)-1 by assuming the virial equilibrium from the Group A GMCs.
-
5.
The mass spectrum of the GMCs with is well fitted by a power law, (. This slope is consistent with the previous results obtained from the Galaxy and nearby galaxies. The slope of the mass spectrum becomes steeper if we fit only the massive clouds; e.g., () for , suggesting the mass truncation.
References
- (1) Bertoldi, F. & McKee, C. 1992, ApJ, 395, 140
- (2) Bica, E., Claria, J. J., Dottori, H., Santos, J. F. C. Jr., & Piatti, A. E., 1996, ApJS, 102, 57
- (3) Blitz, L. & Thaddeus, P. 1980, ApJ, 241, 676
- (4) Blitz, L., Fukui, Y., Kawamura, A. Leroy, A., Mizuno, N., & Rosolowsky, E. 2007, in Protostars and Planet V, ed. B. Reipurth, D. Jewitt, & K. Keil (University of Arizona) 951
- Bloemen et al. (1996) Bloemen, J. B. G. M., Strong, A. W., Blitz, L., Cohen, R. S., Dame, T. M., Grabelsky, D. A., Hermsen, W., Lebrun, F., et al. 1986, A&A, 154, 25
- Blum et al. (2006) Blum, R. D. et al. 2006, AJ, 132, 2034
- ck (1996) Caldwell, D. A. & Kutner, M. L. 1996, ApJ, 472, 611
- ccg (84) Casoli, F. Combes, F. & Gerin, M. 1984, A&A, 133,99
- Cohen et al. (1988) Cohen, R. S., Dame, T. M., Garay, G., Montani, J., Rubio, M., & Thaddeus, P. 1988, ApJ, 331, 95
- Crawford, Jauncey, and Murdoch (1970) Crawford, D. F., Jauncey, D. L., & Murdoch, H. S. 1970, ApJ, 162, 405
- Dame et al. (1986) Dame, T. M., Elemegreen, R. S., Cohen, R. S., & Thaddeus, P. 1986, ApJ, 305, 892
- (12) Davies, R. D., Elliott, K. H., & Meaburn, J. 1976, MmRAS, 81, 89
- Dickel et al. (2005) Dickel, J. R., Mclntyre, V. J., Gruendl, R. A., & Milne, D. K. 2005, AJ, 129, 790
- Digel (1996) Digel et al. 1996, ApJ, 458, 561
- Dobashi et al. (1996) Dobashi, K., Bernard, J. P., & Fukui, Y. 1996, ApJ, 466, 282
- (16) Dufour, R. J. 1984, in Structure and Evolution of the Magellanic Clouds, ed. S. van den Bergh & K. S. de Boer (Dordrecht: Reidel Publishing Co.) 353
- Filipovic (1996) Filipovic, M. D., Jones, P. A., White, G. L., & Haynes, R. F., Meinert, D., Wielebincki, R., & Klein, U. 1996, A&AS, 120, 77
- Fukui (2007) Fukui, Y. 2007, in IAU Symp. 237, Triggered Star Formation in a Turbulent ISM, ed. B. Elmegreen & J. Palous (Cambridge)
- Fukui (2008) Fukui, Y. et al. 2008, in preparation (Paper III)
- Fukui (2005) Fukui, Y. 2005, in IAU Symp. 227, Massive Star Birth: A Crossroads of Astrophysics, ed. R. Cesaroni, M. Felli, E. Churchwell, & M. Walmsley (Cambridge), 328
- Fukui (2002) Fukui, Y. 2002, in Modes of Star Formation and the Origin of Field Populations, ASP Conference Proc. Vol. 285, ed. E.K.Grevel & W. Brandner (San Francisco: ASP), 24
- Fukui et al. (1999) Fukui, Y., Mizuno, N., Yamaguchi, R., Mizuno, A., Onishi, T., Ogawa, H., Yonekura, Y., Kawamura, A., Tachihara, K., Xiao, K., et al. 1999, PASJ, 51, 745
- Fukui et al. (2001) Fukui, Y., Mizuno, N., Yamaguchi, R., Mizuno, A., Onishi, T. 2001, PASJ, 53L, 41
- Fukui Sakakibara (1992) Fukui, Y. & Sakakibara, O. 1992, Mitsubishi electronic ADVANCE, 60, 11
- Haynes et al. (1991) Haynes et a. 1991, A&A, 252, 475
- Henize (1956) Henize, K. G. 1956, ApJS, 2, 315
- Heyer et al. (2001) Heyer, M. H., Carpenter, J. M., & Snell, R. L. 2001, ApJ, 551, 852
- h (1988) Hodge, P. 1988, PASP, 100, 1051
- hughes (06) Hughes et al. 2006, ApJ, in press
- i (2) Israel, F. P., de Graauw, Th., van de Stadt, H., & de Vries, C. P. 1986, ApJ, 303, 186
- i (2) Israel, F. P., Johhansson, L. E. B, Rubio, M., Garay, G., de Graauw, Th., Booth, R. S., Boulanger, F., Kutner, M. L., Lequeux, J., & Nyman, L.-A. 2003, A&A, 406, 817
- (32) Ita, Y., et al. 2004, MNRAS, 347, 720
- (33) Johansson, L. E. B., Olofsson, H., Hjalmarson, A., Gredel, R., & Black, J. H. 1994, A&A, 291, 89
- (34) Johansson, L. E. B., Greve, A., Booth, R. S., Boulanger, F., Garay, G., Graauw, Th. de, Israel, F. P., Kutner, M. L., Lequeux, J., Murphy, D. C., Nyman, L.-A., & Rubio, M. 1998, A&A, 331, 857
- Kawamura et al. (1998) Kawamura, A., Onishi, T., Yonekura, Y., Dobashi, K., Mizuno, A., Ogawa, H., & Fukui, Y. 1998, ApJS, 117, 387
- (36) Kennicutt, R. C., Jr., & Hodge, P. W. 1986, ApJ, 306, 130
- Kim (98) Kim, S., Staveley-Smith, L., Dopita, M. A., Freeman, K. C., Sault, R. J. Kesteven, M. J. & McConnell, D. 1998, ApJ, 503, 674
- (38) Kim, S., Dopita, M. A., Staveley-Smith, L., & Bessel, M. S. 1999, AJ, 118, 2797
- Kim (03) Kim, S., Staveley-Smith, L., Dopita, M. A., Sault, R. J., Freeman, K. C., Lee, Y., Chu, Y.-H. 2003, ApJ, 148, 473
- Koda et al. (2006) Koda, J., Sawada, T., Hasegawa, T., & Scoville, N. Z. 2006, ApJ, 638, 191
- (41) Koornneef, J. 1982, A&A, 107, 247
- Kuter et al. (1997) Kutner, M. L. et al. 1997 A&AS, 122, 255
- (43) Kutner, M. & Ulich, B. L. 1981, ApJ, 250, 341
- Larson (1981) Larson, R. B. 1981, MNRAS, 194, 809
- Lucke et al. (1970) Lucke, P. B., & Hodge, P. W. 1970, AJ, 75, 171
- Luks et al. (1992) Luks, Th., & Rohlfs, K. 1992, A&A, 263, 41
- McGee & Milton (1966) McGee, R. X. & Milton, J. A. 1966, AuPh, 19, 343
- (48) Meaburn, J. 1980, MNRAS, 192, 365
- Meixner et al. (2006) Mexiner et al. 2006, A&A, 132, 2268
- m (1) Mizuno, N., Rubio, M., Mizuno, A., Yamaguchi, R., Onishi, T., Fukui, Y. 2001a, PASJ, 53, L45
- m (2) Mizuno, N., Yamaguchi, R., Mizuno, A., Rubio, M., Abe, R., Saito, H., Onishi, T., Yonekura, Y., Yamaguchi, N., Ogawa, H., Fukui, Y. 2001b, PASJ, 53, 971
- (52) Nagahama, T., Mizuno, A., Ogawa, H., Fukui, Y. 1998, AJ, 116, 336
- Nakagawa et al. (2005) Nakagawa, M., Onishi, T., Mizuno, A. & Fukui, Y. 2005, PASJ, 57, 917
- Ogawa et al. (1987) Ogawa, H., Mizuno, A., Hoko, H., Ishikawa, H., & Fukui, Y. 1999, Int. J. Infrared and Millimeter Waves, 11, 717
- o (1993) Ohta, K., Tomita, A., Saito, M., Sasaki, M., & Nakai, N. 1993, PASJ, 45L, 21
- Rolleston et al. (2002) Rolleston, W. R. J., Trundle, C. & Dufton, P. L. 2002, A&A, 396, 53
- Rosolowsky et al. (2003) Rosolowsky, E., Engargiola, G., Plambeck, R., & Blitz, L., 2003 ApJ, 599, 258
- Rosolowsky (2005) Rosolowsky, E. 2005 PASP, 117, 1403
- Rosolowsky & Leroy (2006) Rosolowsky, E., & Leroy, A. 2006 PASP, 118, 590
- Rubio et al. (1993) Rubio, M., Lequeux, J., & Boulanger, F. 1993 A&A, 271, 9
- Rohlfs et al. (1984) Rohlfs, K., Kreitschmann, J., & Feitzinger, J. V. 1984, in IAU Symp. 108, 395
- (62) Scoville, N. Z., Yun, M. S., Sanders, D. B., Clemens, D. P. & Waller, W. H. 1987, ApJS, 63, 821
- Snowden & Petre, R. (1994) Snowden, S. L. & Petre, R. 1994, ApJ, 436, 123
- Solomon et al. (1987) Solomon, P. M., Rivolo, A. R., Barrett, J., & Yahil, A. 1987, ApJ, 319, 730
- Solomon & Rivolo (1989) Solomon, P. M. & Rivolo, A. R. 1989, ApJ, 339, 919
- Vázquez-Semadeni, Ballesteros-Paredes, and Rodríguez (1997) Vázquez-Semadeni, E., Ballesteros-Paredes, J., & Rodríguez, L. F. 1997, ApJ, 474, 292
- Wada, Spaans, and Kim (2000) Wada, K., Spaans, M., & Kim, S. 2000, ApJ, 540, 797
- Wada & Norman (2001) Wada, K. & Norman, C. A. 2001, ApJ, 547, 172
- Wong & Blitz (2002) Wong, T. & Blitz 2002, ApJ, 569, 157
- (70) Wilson, C. D., & Scoville, N. 1990, ApJ, 363, 435
- (71) Yamaguchi, R., Mizuno, N., Onishi, T., Mizuno, A.,& Fukui, Y. 2001a, ApJ, 553, 185L
- y (1) Yamaguchi, R., Mizuno, N., Onishi, T., Mizuno, A., & Fukui, Y. 2001b, PASJ, 53, 959
- y (2) Yamaguchi, R., Mizuno, N., Mizuno, A., Rubio, M., Abe, R.,Saito, H., Moriguchi, Y., Matsunaga, L., Onishi, T., Yonekura, & Y., Fukui, Y. 2001c, PASJ, 53, 985
- Yonekura et al. (1997) Yonekura, Y., Dobashi, K., Mizuno, A., Ogawa, H., & Fukui, Y. 1997, ApJS, 110, 21
- Young et al. (1991) Young, J. S., & Scoville, N. Z. 1991, ARA&A, 29, 581
- Zaritsky et al. (2004) Zaritsky, D., Harris, J., Thompson, I. B., & Grebel, E. K. 2004, AJ, 128, 1606
| PositionbbPosition of the clouds derived from an intensity-weighted mean over all the pixels of a cloud. | Cloud propertycc is an LSR velocity derived from an intensity-weighted mean of the velocity distribution within a cloud. | |||||
|---|---|---|---|---|---|---|
| Number | NameaaName of the clouds; ‘N’ stands for ‘NANTEN’. | (2000) | (2000) | (1950) | (1950) | |
| (h m s) | ( ) | (h m s) | ( ) | (km s-1) | ||
| 1 | LMC N J0447-6910 | 4 47 30.4 | -69 10 8.9 | 4 47 44.0 | -69 15 20.2 | 239.4 |
| 2 | LMC N J0447-6713 | 4 47 35.9 | -67 13 44.0 | 4 47 33.8 | -67 18 55.4 | 256.8 |
| 3 | LMC N J0448-6920 | 4 48 40.8 | -69 20 41.3 | 4 48 56.2 | -69 25 47.6 | 238.9 |
| 4 | LMC N J0449-6910 | 4 49 12.4 | -69 10 21.0 | 4 49 26.4 | -69 15 25.2 | 240.3 |
| 5 | LMC N J0449-6826 | 4 49 24.2 | -68 26 49.8 | 4 49 32.0 | -68 31 53.4 | 249.4 |
| 6 | LMC N J0449-6806 | 4 49 25.0 | -68 6 39.1 | 4 49 30.0 | -68 11 42.7 | 251.0 |
| 7 | LMC N J0449-6652 | 4 49 33.0 | -66 52 36.9 | 4 49 28.7 | -66 57 40.3 | 264.8 |
| 8 | LMC N J0450-6910 | 4 50 23.0 | -69 10 45.3 | 4 50 37.3 | -69 15 44.6 | 237.8 |
| 9 | LMC N J0450-6930 | 4 50 25.4 | -69 30 47.3 | 4 50 42.7 | -69 35 46.3 | 241.7 |
| 10 | LMC N J0450-6919 | 4 50 48.7 | -69 19 36.4 | 4 51 4.4 | -69 24 33.8 | 235.9 |
| 11 | LMC N J0451-6858 | 4 51 6.0 | -68 58 20.9 | 4 51 18.6 | -69 3 17.3 | 245.9 |
| 12 | LMC N J0451-6704 | 4 51 58.0 | -67 4 18.6 | 4 51 55.6 | -67 9 11.9 | 275.0 |
| 13 | LMC N J0451-6729 | 4 51 58.1 | -67 29 32.2 | 4 51 58.8 | -67 34 25.3 | 274.7 |
| 14 | LMC N J0451-6922 | 4 51 59.6 | -69 22 57.5 | 4 52 16.1 | -69 27 50.0 | 233.1 |
| 15 | LMC N J0452-6750 | 4 52 11.5 | -67 50 44.4 | 4 52 15.1 | -67 55 36.5 | 231.3 |
| 16 | LMC N J0452-6804 | 4 52 54.6 | -68 4 18.2 | 4 53 0.1 | -68 9 7.2 | 267.2 |
| 17 | LMC N J0453-6909 | 4 53 44.3 | -69 9 21.8 | 4 53 59.1 | -69 14 7.1 | 246.0 |
| 18 | LMC N J0453-6919 | 4 53 52.5 | -69 19 14.3 | 4 54 8.8 | -69 23 58.9 | 243.8 |
| 19 | LMC N J0454-6644 | 4 54 11.7 | -66 44 47.1 | 4 54 7.4 | -66 49 31.1 | 274.0 |
| 20 | LMC N J0454-6755 | 4 54 22.6 | -67 55 17.1 | 4 54 27.1 | -68 0 0.0 | 274.6 |
| 21 | LMC N J0454-6929 | 4 54 26.8 | -69 29 2.8 | 4 54 44.7 | -69 33 45.0 | 234.1 |
| 22 | LMC N J0455-6830 | 4 55 29.6 | -68 30 31.5 | 4 55 39.2 | -68 35 9.6 | 258.7 |
| 23 | LMC N J0455-6634 | 4 55 49.8 | -66 34 17.1 | 4 55 44.4 | -66 38 54.2 | 279.0 |
| 24 | LMC N J0455-6930 | 4 55 51.8 | -69 30 49.2 | 4 56 10.3 | -69 35 25.4 | 249.0 |
| 25 | LMC N J0457-6910 | 4 57 1.8 | -69 10 54.5 | 4 57 17.5 | -69 15 25.9 | 236.4 |
| 26 | LMC N J0457-6844 | 4 57 9.7 | -68 44 20.9 | 4 57 21.6 | -68 48 51.8 | 267.1 |
| 27 | LMC N J0457-6826 | 4 57 13.2 | -68 26 8.1 | 4 57 22.6 | -68 30 38.9 | 258.4 |
| 28 | LMC N J0457-6856 | 4 57 15.3 | -68 56 16.3 | 4 57 29.0 | -69 0 46.8 | 259.4 |
| 29 | LMC N J0457-6702 | 4 57 20.1 | -67 2 8.5 | 4 57 18.5 | -67 6 39.2 | 283.9 |
| 30 | LMC N J0457-6620 | 4 57 27.7 | -66 20 44.2 | 4 57 21.1 | -66 25 14.5 | 279.1 |
| 31 | LMC N J0457-6628 | 4 57 51.3 | -66 28 48.3 | 4 57 45.7 | -66 33 16.9 | 279.7 |
| 32 | LMC N J0458-6617 | 4 58 1.6 | -66 17 32.1 | 4 57 54.7 | -66 22 0.1 | 285.3 |
| 33 | LMC N J0458-6618 | 4 58 10.8 | -66 18 56.3 | 4 58 4.2 | -66 23 23.6 | 270.7 |
| 34 | LMC N J0458-7022 | 4 58 12.3 | -70 22 6.2 | 4 58 39.5 | -70 26 32.3 | 235.4 |
| 35 | LMC N J0459-6614 | 4 59 2.1 | -66 14 1.8 | 4 58 55.0 | -66 18 25.6 | 278.5 |
| 36 | LMC N J0500-6622 | 5 0 47.1 | -66 22 21.0 | 5 0 41.2 | -66 26 37.3 | 276.4 |
| 37 | LMC N J0501-6804 | 5 1 44.0 | -68 4 24.8 | 5 1 51.2 | -68 8 36.6 | 248.4 |
| 38 | LMC N J0502-6903 | 5 2 21.8 | -69 3 26.5 | 5 2 37.5 | -69 7 35.4 | 269.3 |
| 39 | LMC N J0503-6553 | 5 3 11.5 | -65 53 56.8 | 5 3 2.8 | -65 58 3.0 | 279.3 |
| 40 | LMC N J0503-6540 | 5 3 24.7 | -65 40 37.8 | 5 3 14.5 | -65 44 43.1 | 271.8 |
| 41 | LMC N J0503-6828 | 5 3 27.8 | -68 28 13.9 | 5 3 38.6 | -68 32 18.2 | 263.6 |
| 42 | LMC N J0503-6612 | 5 3 30.0 | -66 12 16.5 | 5 3 23.4 | -66 16 21.4 | 291.7 |
| 43 | LMC N J0503-6643 | 5 3 36.8 | -66 43 15.5 | 5 3 33.9 | -66 47 19.7 | 280.5 |
| 44 | LMC N J0503-6711 | 5 3 41.0 | -67 11 13.5 | 5 3 41.6 | -67 15 17.3 | 273.9 |
| 45 | LMC N J0503-6719 | 5 3 49.9 | -67 19 48.2 | 5 3 51.6 | -67 23 51.4 | 273.7 |
| 46 | LMC N J0504-6802 | 5 4 22.4 | -68 2 22.8 | 5 4 29.8 | -68 6 23.4 | 246.3 |
| 47 | LMC N J0504-6639 | 5 4 40.7 | -66 39 55.5 | 5 4 37.6 | -66 43 55.2 | 278.7 |
| 48 | LMC N J0504-7007 | 5 4 42.1 | -70 7 34.8 | 5 5 8.2 | -70 11 33.4 | 228.2 |
| 49 | LMC N J0504-7056 | 5 4 54.7 | -70 56 24.6 | 5 5 29.2 | -71 0 22.0 | 231.6 |
| 50 | LMC N J0505-6650 | 5 5 3.7 | -66 50 58.9 | 5 5 2.0 | -66 54 56.9 | 281.2 |
| 51 | LMC N J0506-7010 | 5 6 15.7 | -70 10 18.8 | 5 6 42.6 | -70 14 10.7 | 226.4 |
| 52 | LMC N J0506-6753 | 5 6 51.7 | -67 53 42.3 | 5 6 58.3 | -67 57 32.4 | 257.9 |
| 53 | LMC N J0507-7041 | 5 7 12.0 | -70 41 46.1 | 5 7 44.3 | -70 45 33.8 | 229.4 |
| 54 | LMC N J0507-6828 | 5 7 25.3 | -68 28 12.4 | 5 7 36.8 | -68 31 59.9 | 204.2 |
| 55 | LMC N J0507-6858 | 5 7 43.2 | -68 58 35.4 | 5 7 59.1 | -69 2 21.5 | 254.1 |
| 56 | LMC N J0508-6902 | 5 8 19.5 | -69 2 27.7 | 5 8 36.0 | -69 6 11.2 | 245.6 |
| 57 | LMC N J0508-6905 | 5 8 53.9 | -69 5 27.2 | 5 9 11.0 | -69 9 8.3 | 247.7 |
| 58 | LMC N J0508-6923 | 5 8 59.1 | -69 23 26.6 | 5 9 19.0 | -69 27 7.2 | 226.7 |
| 59 | LMC N J0509-6844 | 5 9 0.1 | -68 44 18.9 | 5 9 14.1 | -68 47 59.6 | 244.3 |
| 60 | LMC N J0509-6827 | 5 9 4.8 | -68 27 25.4 | 5 9 16.4 | -68 31 5.9 | 272.2 |
| 61 | LMC N J0509-7049 | 5 9 29.6 | -70 49 22.7 | 5 10 3.7 | -70 53 0.6 | 223.5 |
| 62 | LMC N J0509-6912 | 5 9 50.6 | -69 12 56.3 | 5 10 9.0 | -69 16 33.2 | 239.4 |
| 63 | LMC N J0510-6853 | 5 10 36.3 | -68 53 10.7 | 5 10 51.9 | -68 56 44.5 | 243.7 |
| 64 | LMC N J0510-6706 | 5 10 47.6 | -67 6 59.0 | 5 10 48.7 | -67 10 32.5 | 286.6 |
| 65 | LMC N J0511-6927 | 5 11 11.7 | -69 27 2.4 | 5 11 32.4 | -69 30 33.5 | 235.6 |
| 66 | LMC N J0512-6746 | 5 12 1.8 | -67 46 33.7 | 5 12 8.2 | -67 50 1.7 | 274.8 |
| 67 | LMC N J0512-6710 | 5 12 9.6 | -67 10 8.1 | 5 12 11.4 | -67 13 35.8 | 287.9 |
| 68 | LMC N J0512-6903 | 5 12 16.3 | -69 3 38.2 | 5 12 33.6 | -69 7 4.8 | 234.1 |
| 69 | LMC N J0512-7028 | 5 12 19.6 | -70 28 31.8 | 5 12 50.5 | -70 31 57.7 | 232.9 |
| 70 | LMC N J0512-6811 | 5 12 45.4 | -68 11 21.9 | 5 12 55.3 | -68 14 46.7 | 282.7 |
| 71 | LMC N J0513-6936 | 5 13 7.2 | -69 36 15.4 | 5 13 29.7 | -69 39 38.2 | 234.3 |
| 72 | LMC N J0513-6922 | 5 13 22.1 | -69 22 30.9 | 5 13 42.5 | -69 25 52.7 | 236.0 |
| 73 | LMC N J0513-6723 | 5 13 58.5 | -67 23 57.1 | 5 14 2.2 | -67 27 16.9 | 283.4 |
| 74 | LMC N J0514-7010 | 5 14 17.0 | -70 10 27.9 | 5 14 45.2 | -70 13 45.5 | 236.4 |
| 75 | LMC N J0514-6847 | 5 14 29.9 | -68 47 9.0 | 5 14 45.2 | -68 50 26.2 | 265.5 |
| 76 | LMC N J0514-6727 | 5 14 31.0 | -67 27 6.7 | 5 14 35.3 | -67 30 24.1 | 294.6 |
| 77 | LMC N J0515-7034 | 5 15 9.4 | -70 34 26.4 | 5 15 41.8 | -70 37 40.1 | 217.6 |
| 78 | LMC N J0515-7002 | 5 15 11.0 | -70 2 8.4 | 5 15 38.0 | -70 5 22.2 | 240.5 |
| 79 | LMC N J0515-6857 | 5 15 29.5 | -68 57 45.5 | 5 15 46.5 | -69 0 58.3 | 265.1 |
| 80 | LMC N J0516-6807 | 5 16 11.6 | -68 7 13.8 | 5 16 21.4 | -68 10 23.9 | 280.9 |
| 81 | LMC N J0516-6616 | 5 16 13.4 | -66 16 7.0 | 5 16 9.0 | -66 19 17.4 | 284.6 |
| 82 | LMC N J0516-6847 | 5 16 38.1 | -68 47 44.8 | 5 16 53.7 | -68 50 52.8 | 265.3 |
| 83 | LMC N J0516-6922 | 5 16 40.3 | -69 22 29.6 | 5 17 1.2 | -69 25 37.2 | 240.7 |
| 84 | LMC N J0516-6559 | 5 16 51.4 | -65 59 33.1 | 5 16 45.1 | -66 2 40.9 | 288.4 |
| 85 | LMC N J0517-7046 | 5 17 18.0 | -70 46 27.4 | 5 17 52.8 | -70 49 31.8 | 233.3 |
| 86 | LMC N J0517-7114 | 5 17 21.9 | -71 14 24.0 | 5 18 1.8 | -71 17 28.0 | 222.9 |
| 87 | LMC N J0517-6847 | 5 17 37.7 | -68 47 48.4 | 5 17 53.5 | -68 50 52.1 | 260.6 |
| 88 | LMC N J0517-6915 | 5 17 38.1 | -69 15 17.0 | 5 17 58.0 | -69 18 20.5 | 256.8 |
| 89 | LMC N J0517-6642 | 5 17 40.4 | -66 42 10.3 | 5 17 39.4 | -66 45 14.4 | 289.7 |
| 90 | LMC N J0517-6932 | 5 17 50.8 | -69 32 14.6 | 5 18 13.4 | -69 35 17.2 | 243.3 |
| 91 | LMC N J0517-6922 | 5 17 52.5 | -69 22 38.7 | 5 18 13.6 | -69 25 41.2 | 234.0 |
| 92 | LMC N J0518-7001 | 5 18 13.6 | -70 1 44.8 | 5 18 41.0 | -70 4 45.5 | 248.2 |
| 93 | LMC N J0518-6620 | 5 18 14.2 | -66 20 49.6 | 5 18 10.7 | -66 23 51.4 | 288.0 |
| 94 | LMC N J0518-6951 | 5 18 58.0 | -69 51 11.4 | 5 19 23.7 | -69 54 9.0 | 229.2 |
| 95 | LMC N J0519-6625 | 5 19 8.3 | -66 25 26.4 | 5 19 5.4 | -66 28 24.2 | 288.7 |
| 96 | LMC N J0519-6938 | 5 19 14.7 | -69 38 44.5 | 5 19 38.4 | -69 41 40.9 | 240.0 |
| 97 | LMC N J0519-7113 | 5 19 22.5 | -71 13 52.0 | 5 20 2.6 | -71 16 47.3 | 227.6 |
| 98 | LMC N J0519-6908 | 5 19 26.5 | -69 8 53.4 | 5 19 45.7 | -69 11 49.2 | 267.2 |
| 99 | LMC N J0520-7043 | 5 20 2.1 | -70 43 52.1 | 5 20 36.9 | -70 46 44.8 | 228.4 |
| 100 | LMC N J0520-6651 | 5 20 7.7 | -66 51 54.4 | 5 20 8.2 | -66 54 47.9 | 291.6 |
| 101 | LMC N J0520-6837 | 5 20 23.7 | -68 37 10.4 | 5 20 38.3 | -68 40 2.3 | 256.2 |
| 102 | LMC N J0520-6832 | 5 20 25.7 | -68 32 4.2 | 5 20 39.5 | -68 34 55.9 | 258.7 |
| 103 | LMC N J0521-7143 | 5 21 4.3 | -71 43 44.0 | 5 21 50.4 | -71 46 31.8 | 226.7 |
| 104 | LMC N J0521-7013 | 5 21 9.0 | -70 13 35.1 | 5 21 38.7 | -70 16 23.2 | 225.8 |
| 105 | LMC N J0521-7000 | 5 21 10.3 | -70 0 23.1 | 5 21 37.8 | -70 3 11.2 | 240.4 |
| 106 | LMC N J0521-6841 | 5 21 12.5 | -68 41 22.7 | 5 21 27.8 | -68 44 11.0 | 267.5 |
| 107 | LMC N J0521-6801 | 5 21 32.1 | -68 1 45.1 | 5 21 41.8 | -68 4 32.2 | 272.5 |
| 108 | LMC N J0521-6847 | 5 21 33.4 | -68 47 32.9 | 5 21 49.7 | -68 50 19.7 | 279.7 |
| 109 | LMC N J0521-6948 | 5 21 56.3 | -69 48 8.4 | 5 22 21.9 | -69 50 53.2 | 234.5 |
| 110 | LMC N J0522-6941 | 5 22 8.6 | -69 41 18.8 | 5 22 33.2 | -69 44 2.8 | 240.6 |
| 111 | LMC N J0522-7135 | 5 22 8.8 | -71 35 46.9 | 5 22 53.4 | -71 38 30.1 | 232.7 |
| 112 | LMC N J0522-6828 | 5 22 11.6 | -68 28 54.5 | 5 22 25.2 | -68 31 38.6 | 244.3 |
| 113 | LMC N J0522-6833 | 5 22 28.5 | -68 33 44.1 | 5 22 42.9 | -68 36 27.0 | 250.4 |
| 114 | LMC N J0522-6756 | 5 22 33.5 | -67 56 59.0 | 5 22 42.7 | -67 59 41.6 | 280.3 |
| 115 | LMC N J0522-6541 | 5 22 39.9 | -65 41 24.2 | 5 22 32.2 | -65 44 7.1 | 294.1 |
| 116 | LMC N J0522-6951 | 5 22 47.0 | -69 51 5.6 | 5 23 13.2 | -69 53 46.7 | 233.1 |
| 117 | LMC N J0522-6706 | 5 22 50.9 | -67 6 59.7 | 5 22 53.6 | -67 9 41.4 | 294.0 |
| 118 | LMC N J0523-6820 | 5 23 0.9 | -68 20 43.4 | 5 23 13.4 | -68 23 24.0 | 255.1 |
| 119 | LMC N J0523-6642 | 5 23 5.6 | -66 42 23.2 | 5 23 5.2 | -66 45 4.0 | 293.3 |
| 120 | LMC N J0523-6629 | 5 23 5.7 | -66 29 19.1 | 5 23 3.7 | -66 31 59.9 | 301.3 |
| 121 | LMC N J0523-6706 | 5 23 7.0 | -67 6 6.5 | 5 23 9.5 | -67 8 47.0 | 285.7 |
| 122 | LMC N J0523-6706 | 5 23 9.8 | -67 6 29.8 | 5 23 12.4 | -67 9 10.1 | 268.4 |
| 123 | LMC N J0523-7139 | 5 23 22.5 | -71 39 9.2 | 5 24 7.9 | -71 41 47.0 | 222.4 |
| 124 | LMC N J0523-6902 | 5 23 42.8 | -69 2 18.9 | 5 24 1.5 | -69 4 56.3 | 261.1 |
| 125 | LMC N J0524-6828 | 5 24 16.2 | -68 28 34.0 | 5 24 30.0 | -68 31 9.1 | 249.5 |
| 126 | LMC N J0524-6727 | 5 24 19.8 | -67 27 24.8 | 5 24 25.2 | -67 30 0.0 | 289.0 |
| 127 | LMC N J0524-7027 | 5 24 25.8 | -70 27 47.1 | 5 24 58.4 | -70 30 20.9 | 233.6 |
| 128 | LMC N J0524-6826 | 5 24 30.5 | -68 26 6.0 | 5 24 43.9 | -68 28 40.1 | 258.9 |
| 129 | LMC N J0524-6939 | 5 24 34.0 | -69 39 42.4 | 5 24 58.5 | -69 42 15.8 | 258.5 |
| 130 | LMC N J0524-6914 | 5 24 37.7 | -69 14 33.0 | 5 24 58.3 | -69 17 6.4 | 259.8 |
| 131 | LMC N J0524-7134 | 5 24 41.1 | -71 34 11.0 | 5 25 25.8 | -71 36 43.2 | 225.4 |
| 132 | LMC N J0525-6948 | 5 25 35.4 | -69 48 17.0 | 5 26 1.5 | -69 50 46.0 | 248.8 |
| 133 | LMC N J0525-6918 | 5 25 36.0 | -69 18 16.5 | 5 25 57.4 | -69 20 45.6 | 259.6 |
| 134 | LMC N J0525-6622 | 5 25 46.4 | -66 22 16.1 | 5 25 43.8 | -66 24 45.4 | 297.8 |
| 135 | LMC N J0525-6609 | 5 25 55.5 | -66 9 29.9 | 5 25 51.4 | -66 11 58.6 | 288.8 |
| 136 | LMC N J0526-6835 | 5 26 7.8 | -68 35 29.6 | 5 26 22.8 | -68 37 56.6 | 254.7 |
| 137 | LMC N J0526-6839 | 5 26 17.7 | -68 39 33.7 | 5 26 33.3 | -68 42 0.0 | 266.5 |
| 138 | LMC N J0526-6742 | 5 26 20.4 | -67 42 21.0 | 5 26 28.0 | -67 44 47.4 | 289.6 |
| 139 | LMC N J0526-6848 | 5 26 27.0 | -68 48 19.3 | 5 26 43.9 | -68 50 44.9 | 256.3 |
| 140 | LMC N J0526-6748 | 5 26 32.6 | -67 48 7.9 | 5 26 41.0 | -67 50 33.4 | 289.9 |
| 141 | LMC N J0526-6552 | 5 26 40.6 | -65 52 58.8 | 5 26 34.6 | -65 55 24.2 | 293.7 |
| 142 | LMC N J0526-6853 | 5 26 55.3 | -68 53 52.9 | 5 27 13.1 | -68 56 16.4 | 238.7 |
| 143 | LMC N J0526-7119 | 5 26 58.4 | -71 19 30.5 | 5 27 40.5 | -71 21 52.9 | 226.0 |
| 144 | LMC N J0527-7028 | 5 27 9.9 | -70 28 25.6 | 5 27 42.9 | -70 30 47.5 | 235.9 |
| 145 | LMC N J0527-7035 | 5 27 25.2 | -70 35 8.5 | 5 27 59.4 | -70 37 29.3 | 236.9 |
| 146 | LMC N J0527-7053 | 5 27 58.7 | -70 53 15.0 | 5 28 36.1 | -70 55 33.2 | 222.2 |
| 147 | LMC N J0528-7140 | 5 28 12.6 | -71 40 16.6 | 5 28 58.8 | -71 42 33.5 | 224.2 |
| 148 | LMC N J0528-6953 | 5 28 17.7 | -69 53 7.4 | 5 28 44.8 | -69 55 24.6 | 249.7 |
| 149 | LMC N J0528-7058 | 5 28 34.0 | -70 58 29.7 | 5 29 12.5 | -71 0 45.4 | 225.2 |
| 150 | LMC N J0529-6830 | 5 29 52.9 | -68 30 45.2 | 5 30 7.5 | -68 32 56.0 | 263.4 |
| 151 | LMC N J0530-7128 | 5 30 24.0 | -71 28 36.4 | 5 31 8.3 | -71 30 43.9 | 220.3 |
| 152 | LMC N J0530-7054 | 5 30 26.9 | -70 54 16.1 | 5 31 4.8 | -70 56 23.6 | 226.0 |
| 153 | LMC N J0530-7106 | 5 30 47.8 | -71 6 58.0 | 5 31 28.0 | -71 9 4.0 | 227.6 |
| 154 | LMC N J0531-6830 | 5 31 28.2 | -68 30 52.1 | 5 31 43.0 | -68 32 56.0 | 258.3 |
| 155 | LMC N J0532-6742 | 5 32 15.7 | -67 42 34.8 | 5 32 23.9 | -67 44 35.5 | 286.2 |
| 156 | LMC N J0532-7114 | 5 32 16.7 | -71 14 15.8 | 5 32 58.4 | -71 16 15.2 | 225.0 |
| 157 | LMC N J0532-6838 | 5 32 20.9 | -68 38 22.0 | 5 32 36.9 | -68 40 22.1 | 253.3 |
| 158 | LMC N J0532-6626 | 5 32 24.7 | -66 26 17.7 | 5 32 23.1 | -66 28 18.1 | 289.1 |
| 159 | LMC N J0532-6946 | 5 32 32.2 | -69 46 8.0 | 5 32 58.7 | -69 48 6.8 | 265.5 |
| 160 | LMC N J0532-6854 | 5 32 46.2 | -68 54 26.6 | 5 33 4.6 | -68 56 24.7 | 294.4 |
| 161 | LMC N J0532-6730 | 5 32 50.2 | -67 30 13.5 | 5 32 56.8 | -67 32 11.8 | 279.0 |
| 162 | LMC N J0532-6857 | 5 32 55.0 | -68 57 57.1 | 5 33 14.0 | -68 59 54.6 | 252.5 |
| 163 | LMC N J0533-6819 | 5 33 33.5 | -68 19 58.0 | 5 33 47.0 | -68 21 52.9 | 273.9 |
| 164 | LMC N J0534-6813 | 5 34 45.8 | -68 13 6.3 | 5 34 58.3 | -68 14 56.0 | 276.5 |
| 165 | LMC N J0535-6840 | 5 35 0.4 | -68 40 10.8 | 5 35 16.9 | -68 41 59.3 | 243.8 |
| 166 | LMC N J0535-6742 | 5 35 14.5 | -67 42 12.1 | 5 35 22.9 | -67 43 59.9 | 285.6 |
| 167 | LMC N J0535-7045 | 5 35 29.7 | -70 45 35.5 | 5 36 6.5 | -70 47 21.1 | 268.7 |
| 168 | LMC N J0535-6735 | 5 35 31.6 | -67 35 4.5 | 5 35 39.0 | -67 36 51.1 | 281.7 |
| 169 | LMC N J0535-6912 | 5 35 40.7 | -69 12 24.9 | 5 36 2.1 | -69 14 10.3 | 247.4 |
| 170 | LMC N J0535-6912 | 5 35 46.6 | -69 12 58.8 | 5 36 8.1 | -69 14 43.8 | 239.9 |
| 171 | LMC N J0535-6902 | 5 35 46.7 | -69 2 35.3 | 5 36 6.5 | -69 4 20.3 | 262.5 |
| 172 | LMC N J0535-6844 | 5 35 47.0 | -68 44 9.3 | 5 36 4.1 | -68 45 54.4 | 249.8 |
| 173 | LMC N J0536-7043 | 5 36 4.5 | -70 43 7.5 | 5 36 40.8 | -70 44 50.6 | 238.2 |
| 174 | LMC N J0536-6931 | 5 36 12.8 | -69 31 57.4 | 5 36 37.2 | -69 33 40.3 | 245.0 |
| 175 | LMC N J0536-6824 | 5 36 26.7 | -68 24 1.4 | 5 36 40.9 | -68 25 43.7 | 211.6 |
| 176 | LMC N J0536-7124 | 5 36 37.0 | -71 24 38.1 | 5 37 21.1 | -71 26 18.6 | 227.9 |
| 177 | LMC N J0537-6651 | 5 37 1.3 | -66 51 38.7 | 5 37 3.2 | -66 53 19.0 | 301.6 |
| 178 | LMC N J0537-6946 | 5 37 11.1 | -69 46 44.8 | 5 37 38.0 | -69 48 23.4 | 252.7 |
| 179 | LMC N J0537-6619 | 5 37 18.3 | -66 19 12.6 | 5 37 16.3 | -66 20 51.7 | 288.2 |
| 180 | LMC N J0537-6626 | 5 37 23.1 | -66 26 30.0 | 5 37 22.0 | -66 28 8.8 | 289.8 |
| 181 | LMC N J0537-6944 | 5 37 33.2 | -69 44 31.0 | 5 37 59.8 | -69 46 8.0 | 235.8 |
| 182 | LMC N J0537-6946 | 5 37 42.1 | -69 46 30.1 | 5 38 9.0 | -69 48 6.5 | 225.3 |
| 183 | LMC N J0538-6908 | 5 38 12.9 | -69 8 53.1 | 5 38 33.9 | -69 10 27.5 | 261.4 |
| 184 | LMC N J0538-6934 | 5 38 18.6 | -69 34 1.4 | 5 38 43.6 | -69 35 35.2 | 261.2 |
| 185 | LMC N J0538-7117 | 5 38 25.7 | -71 17 43.7 | 5 39 8.6 | -71 19 16.3 | 218.0 |
| 186 | LMC N J0538-6904 | 5 38 26.3 | -69 4 48.2 | 5 38 46.7 | -69 6 21.6 | 249.1 |
| 187 | LMC N J0538-7119 | 5 38 27.9 | -71 19 54.9 | 5 39 11.3 | -71 21 27.4 | 225.8 |
| 188 | LMC N J0538-7017 | 5 38 31.5 | -70 17 3.4 | 5 39 3.5 | -70 18 36.0 | 218.9 |
| 189 | LMC N J0538-6915 | 5 38 40.4 | -69 15 43.4 | 5 39 2.5 | -69 17 15.7 | 250.4 |
| 190 | LMC N J0538-6854 | 5 38 49.2 | -68 54 38.5 | 5 39 8.1 | -68 56 10.3 | 258.1 |
| 191 | LMC N J0539-6932 | 5 39 0.5 | -69 32 13.1 | 5 39 25.2 | -69 33 43.9 | 252.6 |
| 192 | LMC N J0539-6954 | 5 39 5.8 | -69 54 45.1 | 5 39 34.1 | -69 56 15.4 | 240.2 |
| 193 | LMC N J0539-7017 | 5 39 47.3 | -70 17 20.4 | 5 40 19.4 | -70 18 47.5 | 244.2 |
| 194 | LMC N J0539-6918 | 5 39 47.3 | -69 18 20.2 | 5 40 9.9 | -69 19 47.6 | 266.6 |
| 195 | LMC N J0539-7109 | 5 39 49.3 | -71 9 49.8 | 5 40 30.8 | -71 11 16.4 | 229.7 |
| 196 | LMC N J0539-7132 | 5 39 56.6 | -71 32 53.6 | 5 40 42.5 | -71 34 19.6 | 211.4 |
| 197 | LMC N J0540-7008 | 5 40 7.2 | -70 8 19.6 | 5 40 37.9 | -70 9 45.4 | 232.6 |
| 198 | LMC N J0540-7113 | 5 40 26.5 | -71 13 0.8 | 5 41 8.7 | -71 14 24.7 | 215.9 |
| 199 | LMC N J0540-7124 | 5 40 28.8 | -71 24 54.6 | 5 41 13.2 | -71 26 18.2 | 217.9 |
| 200 | LMC N J0540-6905 | 5 40 30.6 | -69 5 37.9 | 5 40 51.3 | -69 7 2.3 | 274.24 |
| 201 | LMC N J0540-6900 | 5 40 41.6 | -69 0 56.4 | 5 41 1.6 | -69 2 20.0 | 278.6 |
| 202 | LMC N J0540-7003 | 5 40 58.2 | -70 3 37.8 | 5 41 28.1 | -70 4 59.9 | 228.1 |
| 203 | LMC N J0541-7053 | 5 41 8.0 | -70 53 30.1 | 5 41 46.6 | -70 54 51.1 | 234.5 |
| 204 | LMC N J0541-6900 | 5 41 41.0 | -68 59 7.7 | 5 42 0.7 | -69 0 27.0 | 251.3 |
| 205 | LMC N J0542-7119 | 5 42 4.6 | -71 19 36.4 | 5 42 48.0 | -71 20 53.2 | 217.3 |
| 206 | LMC N J0542-6943 | 5 42 50.9 | -69 43 54.3 | 5 43 17.7 | -69 45 8.3 | 227.6 |
| 207 | LMC N J0542-6944 | 5 42 57.1 | -69 44 46.6 | 5 43 24.0 | -69 46 0.1 | 240.8 |
| 208 | LMC N J0543-6757 | 5 43 23.8 | -67 57 22.2 | 5 43 34.7 | -67 58 34.3 | 278.6 |
| 209 | LMC N J0543-6926 | 5 43 35.2 | -69 26 31.3 | 5 43 59.3 | -69 27 42.1 | 249.1 |
| 210 | LMC N J0543-7012 | 5 43 36.0 | -70 12 10.1 | 5 44 7.5 | -70 13 20.6 | 247.9 |
| 211 | LMC N J0543-6754 | 5 43 39.3 | -67 54 28.3 | 5 43 49.8 | -67 55 39.4 | 283.0 |
| 212 | LMC N J0543-7106 | 5 43 55.9 | -71 6 43.2 | 5 44 37.0 | -71 7 52.0 | 220.1 |
| 213 | LMC N J0543-6726 | 5 43 56.2 | -67 26 49.8 | 5 44 3.0 | -67 27 59.8 | 285.8 |
| 214 | LMC N J0543-6915 | 5 43 57.5 | -69 15 48.8 | 5 44 19.8 | -69 16 58.1 | 243.6 |
| 215 | LMC N J0544-7127 | 5 44 23.8 | -71 27 53.0 | 5 45 9.0 | -71 28 59.5 | 220.0 |
| 216 | LMC N J0544-6923 | 5 44 29.7 | -69 23 40.3 | 5 44 53.3 | -69 24 47.2 | 230.0 |
| 217 | LMC N J0544-6943 | 5 44 37.8 | -69 43 7.0 | 5 45 4.6 | -69 44 13.2 | 235.6 |
| 218 | LMC N J0544-6718 | 5 44 47.2 | -67 18 42.8 | 5 44 53.0 | -67 19 49.1 | 284.4 |
| 219 | LMC N J0545-6856 | 5 45 6.7 | -68 56 55.8 | 5 45 26.2 | -68 58 0.1 | 225.1 |
| 220 | LMC N J0545-6949 | 5 45 27.3 | -69 49 34.0 | 5 45 55.1 | -69 50 36.6 | 228.2 |
| 221 | LMC N J0545-6708 | 5 45 31.6 | -67 8 31.1 | 5 45 36.1 | -67 9 34.2 | 285.8 |
| 222 | LMC N J0546-7105 | 5 46 21.0 | -71 5 51.9 | 5 47 2.1 | -71 6 50.0 | 221.5 |
| 223 | LMC N J0546-6937 | 5 46 26.7 | -69 37 1.6 | 5 46 52.6 | -69 37 59.9 | 234.9 |
| 224 | LMC N J0547-6808 | 5 47 18.7 | -68 8 7.1 | 5 47 31.2 | -68 9 2.2 | 289.7 |
| 225 | LMC N J0547-7041 | 5 47 28.1 | -70 41 55.2 | 5 48 4.9 | -70 42 48.6 | 217.6 |
| 226 | LMC N J0547-6953 | 5 47 55.1 | -69 53 8.9 | 5 48 23.6 | -69 54 0.7 | 223.0 |
| 227 | LMC N J0548-7007 | 5 48 18.9 | -70 7 2.0 | 5 48 49.7 | -70 7 52.0 | 223.5 |
| 228 | LMC N J0548-7034 | 5 48 44.5 | -70 34 40.8 | 5 49 20.1 | -70 35 28.7 | 207.5 |
| 229 | LMC N J0550-6827 | 5 50 27.3 | -68 27 0.9 | 5 50 42.7 | -68 27 42.1 | 297.3 |
| 230 | LMC N J0555-6811 | 5 55 45.1 | -68 11 56.7 | 5 55 58.4 | -68 12 14.8 | 283.7 |
| PositionbbPosition of the clouds derived from an intensity-weighted mean over all the pixels of a cloud. | Cloud propertycc is an LSR velocity derived from an intensity-weighted mean of the velocity distribution within a cloud. | |||||
|---|---|---|---|---|---|---|
| NumberaaName of the clouds; ‘N’ stands for ‘NANTEN’. | Name | (2000) | (2000) | (1950) | (1950) | |
| (h m s) | ( ) | (h m s) | ( ) | (km s-1) | ||
| 231 | LMC N J0447-6728 | 4 47 18.3 | -67 28 47.5 | 4 47 18.0 | -67 34 0.1 | 250.0 |
| 232 | LMC N J0448-6721 | 4 48 1.7 | -67 21 53.9 | 4 48 0.7 | -67 27 3.6 | 254.1 |
| 233 | LMC N J0449-6810 | 4 49 40.6 | -68 10 12.9 | 4 49 46.2 | -68 15 15.5 | 255.2 |
| 234 | LMC N J0451-6927 | 4 51 21.8 | -69 27 4.8 | 4 51 38.8 | -69 31 59.9 | 237.7 |
| 235 | LMC N J0453-6846 | 4 53 55.9 | -68 46 38.1 | 4 54 7.5 | -68 51 22.7 | 242.7 |
| 236 | LMC N J0458-6617 | 4 58 50.0 | -66 17 7.1 | 4 58 43.2 | -66 21 31.7 | 273.8 |
| 237 | LMC N J0459-6607 | 4 59 50.1 | -66 7 39.6 | 4 59 42.4 | -66 12 0.0 | 279.4 |
| 238 | LMC N J0500-6807 | 5 0 36.9 | -68 7 43.4 | 5 0 44.3 | -68 12 0.0 | 256.4 |
| 239 | LMC N J0504-6904 | 5 4 36.0 | -69 4 0.5 | 5 4 52.1 | -69 7 59.9 | 266.4 |
| 240 | LMC N J0505-6950 | 5 5 5.3 | -69 50 3.0 | 5 5 28.7 | -69 54 0.0 | 290.2 |
| 241 | LMC N J0507-6647 | 5 7 8.4 | -66 47 25.2 | 5 7 6.6 | -66 51 14.4 | 295.8 |
| 242 | LMC N J0511-6815 | 5 11 10.1 | -68 15 23.1 | 5 11 20.4 | -68 18 54.7 | 299.5 |
| 243 | LMC N J0511-7050 | 5 11 50.0 | -70 50 32.1 | 5 12 24.6 | -70 54 0.0 | 224.6 |
| 244 | LMC N J0511-6928 | 5 11 50.2 | -69 28 31.6 | 5 12 11.3 | -69 31 59.9 | 241.2 |
| 245 | LMC N J0511-6857 | 5 11 54.3 | -68 57 46.0 | 5 12 10.8 | -69 1 14.2 | 242.1 |
| 246 | LMC N J0521-6600 | 5 21 44.1 | -66 0 34.5 | 5 21 38.6 | -66 3 21.2 | 296.7 |
| 247 | LMC N J0521-6733 | 5 21 51.7 | -67 33 14.2 | 5 21 57.6 | -67 35 60.0 | 280.2 |
| 248 | LMC N J0523-7029 | 5 23 13.1 | -70 29 20.9 | 5 23 45.7 | -70 31 59.9 | 240.6 |
| 249 | LMC N J0525-7135 | 5 25 49.8 | -71 35 32.6 | 5 26 34.9 | -71 37 59.9 | 223.4 |
| 250 | LMC N J0525-6555 | 5 25 53.8 | -65 55 31.3 | 5 25 48.0 | -65 58 0.1 | 235.2 |
| 251 | LMC N J0526-6733 | 5 26 39.9 | -67 33 35.0 | 5 26 46.3 | -67 35 60.0 | 290.8 |
| 252 | LMC N J0528-6725 | 5 28 1.4 | -67 25 40.9 | 5 28 7.0 | -67 28 0.1 | 288.8 |
| 253 | LMC N J0530-6757 | 5 30 30.3 | -67 57 12.8 | 5 30 40.4 | -67 59 21.1 | 277.4 |
| 254 | LMC N J0532-7056 | 5 32 20.3 | -70 56 0.8 | 5 32 58.7 | -70 58 0.1 | 270.3 |
| 255 | LMC N J0532-6735 | 5 32 23.7 | -67 35 59.7 | 5 32 31.0 | -67 37 59.9 | 289.7 |
| 256 | LMC N J0534-6823 | 5 34 16.1 | -68 23 31.4 | 5 34 30.1 | -68 25 23.2 | 253.3 |
| 257 | LMC N J0535-6730 | 5 35 0.3 | -67 30 11.0 | 5 35 7.1 | -67 31 59.9 | 290.4 |
| 258 | LMC N J0535-6618 | 5 35 10.7 | -66 18 11.4 | 5 35 8.4 | -66 19 59.9 | 295.5 |
| 259 | LMC N J0535-6714 | 5 35 38.7 | -67 14 14.0 | 5 35 43.4 | -67 16 0.1 | 268.3 |
| 260 | LMC N J0536-6941 | 5 36 6.3 | -69 41 6.3 | 5 36 32.2 | -69 42 49.7 | 258.7 |
| 261 | LMC N J0536-6850 | 5 36 33.3 | -68 50 18.4 | 5 36 51.4 | -68 52 0.1 | 252.7 |
| 262 | LMC N J0538-7006 | 5 38 6.7 | -70 6 25.4 | 5 38 36.9 | -70 7 59.9 | 248.9 |
| 263 | LMC N J0538-7040 | 5 38 12.5 | -70 40 26.1 | 5 38 48.6 | -70 42 0.0 | 218.4 |
| 264 | LMC N J0540-7100 | 5 40 40.4 | -71 0 57.8 | 5 41 20.3 | -71 2 20.8 | 220.6 |
| 265 | LMC N J0541-6815 | 5 41 23.6 | -68 15 16.8 | 5 41 36.9 | -68 16 37.6 | 282.3 |
| 266 | LMC N J0543-6947 | 5 43 6.5 | -69 47 21.0 | 5 43 33.9 | -69 48 33.8 | 244.7 |
| 267 | LMC N J0543-6749 | 5 43 10.7 | -67 49 59.1 | 5 43 20.6 | -67 51 12.2 | 287.9 |
| 268 | LMC N J0543-6920 | 5 43 17.2 | -69 20 47.9 | 5 43 40.3 | -69 22 0.1 | 247.5 |
| 269 | LMC N J0543-6618 | 5 43 42.5 | -66 18 48.6 | 5 43 40.8 | -66 19 59.9 | 288.0 |
| 270 | LMC N J0547-6959 | 5 47 44.2 | -69 59 7.5 | 5 48 13.7 | -70 0 0.0 | 224.1 |
| 271 | LMC N J0553-6822 | 5 53 3.1 | -68 22 29.7 | 5 53 17.9 | -68 22 59.5 | 283.4 |
| 272 | LMC N J0554-6833 | 5 54 33.5 | -68 33 36.9 | 5 54 49.9 | -68 34 0.1 | 284.8 |
| Cloud propertiesaaObserved properties of the GMCs identified from this survey; FWHM of the line width, , derived from the moment of the spectra within a cloud, size, , derived by , where and are the major and minor axes of the cloud deconvolved by the NANTEN beam, respecticely. Position angle, major and minor axes without beam deconvolution, CO luminosity, , virial mass, , and mass, , derived from with cm (K km s-1) are also listed. Please also see section 3.2 for the derivation of the cloud properties. | ||||||||
|---|---|---|---|---|---|---|---|---|
| Number | Name | bbMinor axis of clouds less than the NANTEN beam is not resolved by NANTEN and is not able to be derived. The radius and the virial mass of these clouds are indicated by ‘ ’. | PA | Majnodeconv MinnodeonvccMinor axis without deconvolution indicated by ‘ ’ is that of a cloud only detected at one observed point along the minor axis so that the moment is not derivable. | bbMinor axis of clouds less than the NANTEN beam is not resolved by NANTEN and is not able to be derived. The radius and the virial mass of these clouds are indicated by ‘ ’. | |||
| (km s-1) | (pc) | () | (pc pc) | ( K km s-1) | () | () | ||
| 1 | LMC N J0447-6910 | 4.2 | 46 | 32 15 | 1 | 2 | ||
| 2 | LMC N J0447-6713 | 11.2 | 97 | 54 | 69 42 | 7 | 20 | 10 |
| 3 | LMC N J0448-6920 | 4.1 | 169 | 39 14 | 0.5 | 0.7 | ||
| 4 | LMC N J0449-6910 | 5.3 | 60 | 23 | 51 26 | 3 | 3 | 4 |
| 5 | LMC N J0449-6826 | 5.7 | 87 | 87 | 79 31 | 8 | 5 | 10 |
| 6 | LMC N J0449-6806 | 10.7 | 73 | 32 13 | 0.9 | 1 | ||
| 7 | LMC N J0449-6652 | 4.6 | 26 | 59 | 23 20 | 0.5 | 1 | 0.9 |
| 8 | LMC N J0450-6910 | 1.9 | 179 | 30 12 | 0.4 | 0.6 | ||
| 9 | LMC N J0450-6930 | 3.9 | 131 | 24 14 | 0.5 | 0.9 | ||
| 10 | LMC N J0450-6919 | 4.6 | 29 | 175 | 28 19 | 1 | 1 | 2 |
| 11 | LMC N J0451-6858 | 3.4 | 40 | 143 | 41 20 | 0.5 | 0.9 | 0.8 |
| 12 | LMC N J0451-6704 | 5.6 | 120 | 85 | 126 34 | 6 | 7 | 10 |
| 13 | LMC N J0451-6729 | 3.4 | 80 | 28 16 | 0.5 | 0.8 | ||
| 14 | LMC N J0451-6922 | 6.5 | 27 | 88 | 25 19 | 2 | 2 | 3 |
| 15 | LMC N J0452-6750 | 2.9 | 29 | 138 | 25 20 | 0.2 | 0.4 | 0.3 |
| 16 | LMC N J0452-6804 | 6.1 | 26 | 66 | 26 18 | 2 | 2 | 3 |
| 17 | LMC N J0453-6909 | 8.1 | 75 | 177 | 48 38 | 6 | 9 | 9 |
| 18 | LMC N J0453-6919 | 5.9 | 38 | 128 | 33 21 | 0.4 | 2 | 0.6 |
| 19 | LMC N J0454-6644 | 4.5 | 41 | 86 | 41 20 | 0.6 | 2 | 1 |
| 20 | LMC N J0454-6755 | 3.6 | 40 | 0 | 43 | 0.3 | 1 | 0.4 |
| 21 | LMC N J0454-6929 | 7.6 | 16 | 143 | 20 17 | 0.4 | 2 | 0.7 |
| 22 | LMC N J0455-6830 | 7.5 | 86 | 50 12 | 2 | 3 | ||
| 23 | LMC N J0455-6634 | 9.8 | 57 | 48 | 51 25 | 4 | 10 | 6 |
| 24 | LMC N J0455-6930 | 4.4 | 31 | 37 | 23 23 | 0.3 | 1 | 0.5 |
| 25 | LMC N J0457-6910 | 4.1 | 26 | 43 | 26 18 | 0.7 | 0.8 | 1 |
| 26 | LMC N J0457-6844 | 4.1 | 26 | 125 | 19 23 | 0.3 | 0.8 | 0.5 |
| 27 | LMC N J0457-6826 | 3.8 | 31 | 111 | 20 27 | 0.8 | 0.8 | 1 |
| 28 | LMC N J0457-6856 | 6.1 | 43 | 23 15 | 0.8 | 1 | ||
| 29 | LMC N J0457-6702 | 2.9 | 46 | 107 | 46 21 | 0.3 | 0.8 | 0.5 |
| 30 | LMC N J0457-6620 | 3.7 | 86 | 92 | 44 52 | 1 | 2 | 2 |
| 31 | LMC N J0457-6628 | 5.6 | 24 | 45 | 22 19 | 1 | 1 | 2 |
| 32 | LMC N J0458-6617 | 4.1 | 24 | 0 | 29 | 0.3 | 0.8 | 0.5 |
| 33 | LMC N J0458-6618 | 5.3 | 27 | 87 | 23 20 | 1 | 1 | 2 |
| 34 | LMC N J0458-7022 | 4.2 | 2 | 16 15 | 1 | 2 | ||
| 35 | LMC N J0459-6614 | 5.9 | 76 | 71 | 77 27 | 4 | 5 | 6 |
| 36 | LMC N J0500-6622 | 2.7 | 47 | 74 | 36 25 | 1 | 0.7 | 2 |
| 37 | LMC N J0501-6804 | 2.7 | 136 | 29 14 | 0.2 | 0.3 | ||
| 38 | LMC N J0502-6903 | 6.2 | 84 | 34 16 | 0.9 | 2 | ||
| 39 | LMC N J0503-6553 | 7.9 | 34 | 86 | 26 23 | 1 | 4 | 2 |
| 40 | LMC N J0503-6540 | 1.8 | 28 | 137 | 29 18 | 0.3 | 0.2 | 0.5 |
| 41 | LMC N J0503-6828 | 2.6 | 29 | 162 | 23 21 | 0.5 | 0.4 | 0.8 |
| 42 | LMC N J0503-6612 | 5.3 | 65 | 16 11 | 0.2 | 0.3 | ||
| 43 | LMC N J0503-6643 | 4.6 | 19 | 106 | 20 18 | 0.6 | 0.7 | 1 |
| 44 | LMC N J0503-6711 | 5.0 | 33 | 168 | 22 26 | 0.8 | 2 | 1 |
| 45 | LMC N J0503-6719 | 8.1 | 16 | 85 | 26 16 | 2 | 2 | 4 |
| 46 | LMC N J0504-6802 | 4.6 | 50 | 110 | 37 26 | 1 | 2 | 2 |
| 47 | LMC N J0504-6639 | 5.2 | 120 | 29 16 | 0.5 | 0.8 | ||
| 48 | LMC N J0504-7007 | 6.3 | 37 | 111 | 30 22 | 0.9 | 3 | 2 |
| 49 | LMC N J0504-7056 | 7.9 | 76 | 54 14 | 1 | 2 | ||
| 50 | LMC N J0505-6650 | 5.3 | 41 | 53 | 43 20 | 2 | 2 | 3 |
| 51 | LMC N J0506-7010 | 3.8 | 75 | 31 15 | 0.5 | 0.8 | ||
| 52 | LMC N J0506-6753 | 3.5 | 20 | 37 | 26 17 | 0.4 | 0.5 | 0.6 |
| 53 | LMC N J0507-7041 | 4.1 | 144 | 22 14 | 0.4 | 0.7 | ||
| 54 | LMC N J0507-6828 | 6.2 | 33 | 0 | 37 | 0.3 | 2 | 0.5 |
| 55 | LMC N J0507-6858 | 14.0 | 39 | 86 | 33 21 | 3 | 10 | 5 |
| 56 | LMC N J0508-6902 | 10.3 | 165 | 18 13 | 0.6 | 0.9 | ||
| 57 | LMC N J0508-6905 | 4.1 | 70 | 27 16 | 0.3 | 0.6 | ||
| 58 | LMC N J0508-6923 | 8.6 | 61 | 18 | 59 24 | 4 | 8 | 7 |
| 59 | LMC N J0509-6844 | 7.7 | 20 | 72 | 26 17 | 0.9 | 2 | 1 |
| 60 | LMC N J0509-6827 | 2.8 | 21 | 58 | 29 17 | 0.3 | 0.3 | 0.5 |
| 61 | LMC N J0509-7049 | 1.7 | 36 | 47 | 28 22 | 0.3 | 0.2 | 0.4 |
| 62 | LMC N J0509-6912 | 5.9 | 45 | 66 | 30 28 | 2 | 3 | 3 |
| 63 | LMC N J0510-6853 | 10.5 | 72 | 2 | 56 31 | 6 | 10 | 10 |
| 64 | LMC N J0510-6706 | 6.5 | 48 | 131 | 45 22 | 0.6 | 4 | 1 |
| 65 | LMC N J0511-6927 | 2.6 | 23 | 53 | 27 17 | 0.3 | 0.3 | 0.5 |
| 66 | LMC N J0512-6746 | 6.2 | 64 | 138 | 58 25 | 2 | 5 | 3 |
| 67 | LMC N J0512-6710 | 7.4 | 23 | 137 | 30 17 | 2 | 2 | 3 |
| 68 | LMC N J0512-6903 | 7.7 | 71 | 37 | 67 26 | 4 | 8 | 6 |
| 69 | LMC N J0512-7028 | 4.7 | 55 | 83 | 46 25 | 3 | 2 | 5 |
| 70 | LMC N J0512-6811 | 6.9 | 37 | 110 | 29 23 | 1 | 3 | 2 |
| 71 | LMC N J0513-6936 | 8.5 | 60 | 168 | 50 26 | 6 | 8 | 10 |
| 72 | LMC N J0513-6922 | 6.4 | 17 | 54 | 21 17 | 3 | 1 | 4 |
| 73 | LMC N J0513-6723 | 4.3 | 113 | 16 11 | 0.3 | 0.5 | ||
| 74 | LMC N J0514-7010 | 4.9 | 55 | 76 | 36 30 | 2 | 3 | 4 |
| 75 | LMC N J0514-6847 | 5.9 | 38 | 100 | 29 23 | 1 | 2 | 2 |
| 76 | LMC N J0514-6727 | 4.3 | 45 | 145 | 35 24 | 0.7 | 2 | 1 |
| 77 | LMC N J0515-7034 | 3.3 | 35 | 152 | 29 21 | 0.9 | 0.7 | 1 |
| 78 | LMC N J0515-7002 | 6.2 | 91 | 41 13 | 0.8 | 1 | ||
| 79 | LMC N J0515-6857 | 3.0 | 18 | 52 | 24 17 | 0.5 | 0.3 | 0.8 |
| 80 | LMC N J0516-6807 | 7.7 | 100 | 76 | 123 29 | 10 | 10 | 20 |
| 81 | LMC N J0516-6616 | 3.6 | 33 | 160 | 25 22 | 0.4 | 0.8 | 0.7 |
| 82 | LMC N J0516-6847 | 6.5 | 116 | 41 15 | 0.8 | 1 | ||
| 83 | LMC N J0516-6922 | 3.3 | 59 | 16 13 | 0.5 | 0.8 | ||
| 84 | LMC N J0516-6559 | 4.3 | 151 | 25 15 | 0.3 | 0.6 | ||
| 85 | LMC N J0517-7046 | 2.0 | 39 | 133 | 31 23 | 0.2 | 0.3 | 0.3 |
| 86 | LMC N J0517-7114 | 8.6 | 27 | 26 | 29 18 | 1 | 4 | 2 |
| 87 | LMC N J0517-6847 | 8.7 | 12 | 103 | 25 16 | 0.5 | 2 | 0.9 |
| 88 | LMC N J0517-6915 | 4.1 | 162 | 38 14 | 0.5 | 0.8 | ||
| 89 | LMC N J0517-6642 | 2.7 | 20 | 116 | 25 17 | 0.7 | 0.3 | 1 |
| 90 | LMC N J0517-6932 | 3.1 | 166 | 29 14 | 0.4 | 0.7 | ||
| 91 | LMC N J0517-6922 | 2.2 | 38 | 146 | 41 19 | 0.2 | 0.3 | 0.4 |
| 92 | LMC N J0518-7001 | 4.8 | 21 | 114 | 21 19 | 0.7 | 0.9 | 1 |
| 93 | LMC N J0518-6620 | 2.9 | 11 | 19 9 | 0.3 | 0.4 | ||
| 94 | LMC N J0518-6951 | 4.2 | 170 | 16 12 | 0.4 | 0.6 | ||
| 95 | LMC N J0519-6625 | 4.9 | 145 | 23 16 | 0.4 | 0.6 | ||
| 96 | LMC N J0519-6938 | 8.7 | 55 | 31 | 39 28 | 3 | 8 | 5 |
| 97 | LMC N J0519-7113 | 4.6 | 31 | 145 | 28 20 | 0.9 | 1 | 1 |
| 98 | LMC N J0519-6908 | 6.8 | 26 | 107 | 27 18 | 2 | 2 | 3 |
| 99 | LMC N J0520-7043 | 5.1 | 53 | 85 | 35 29 | 2 | 3 | 3 |
| 100 | LMC N J0520-6651 | 4.2 | 31 | 178 | 31 19 | 0.7 | 1 | 1 |
| 101 | LMC N J0520-6837 | 3.8 | 35 | 162 | 36 19 | 0.8 | 1 | 1 |
| 102 | LMC N J0520-6832 | 2.2 | 123 | 30 16 | 0.4 | 0.7 | ||
| 103 | LMC N J0521-7143 | 4.0 | 139 | 21 11 | 0.3 | 0.4 | ||
| 104 | LMC N J0521-7013 | 3.9 | 36 | 91 | 28 22 | 2 | 1 | 3 |
| 105 | LMC N J0521-7000 | 7.7 | 49 | 133 | 46 22 | 6 | 6 | 10 |
| 106 | LMC N J0521-6841 | 9.1 | 0 | 26 14 | 0.7 | 1 | ||
| 107 | LMC N J0521-6801 | 4.0 | 34 | 13 | 28 21 | 0.6 | 1 | 0.9 |
| 108 | LMC N J0521-6847 | 6.2 | 50 | 11 | 43 23 | 2 | 4 | 3 |
| 109 | LMC N J0521-6948 | 2.0 | 107 | 17 13 | 0.3 | 0.4 | ||
| 110 | LMC N J0522-6941 | 10.0 | 30 | 25 | 31 19 | 4 | 6 | 6 |
| 111 | LMC N J0522-7135 | 4.1 | 59 | 26 14 | 0.2 | 0.3 | ||
| 112 | LMC N J0522-6828 | 4.9 | 27 | 79 | 25 19 | 1 | 1 | 2 |
| 113 | LMC N J0522-6833 | 2.2 | 163 | 34 15 | 0.4 | 0.6 | ||
| 114 | LMC N J0522-6756 | 9.3 | 150 | 59 | 118 55 | 20 | 20 | 30 |
| 115 | LMC N J0522-6541 | 5.6 | 47 | 153 | 36 25 | 2 | 3 | 3 |
| 116 | LMC N J0522-6951 | 2.5 | 61 | 42 12 | 0.4 | 0.7 | ||
| 117 | LMC N J0522-6706 | 4.9 | 162 | 17 12 | 0.5 | 0.8 | ||
| 118 | LMC N J0523-6820 | 9.2 | 43 | 145 | 64 18 | 1 | 7 | 2 |
| 119 | LMC N J0523-6642 | 6.0 | 30 | 20 | 28 19 | 2 | 2 | 3 |
| 120 | LMC N J0523-6629 | 3.6 | 32 | 0 | 36 | 0.3 | 0.8 | 0.5 |
| 121 | LMC N J0523-6706 | 4.1 | 35 | 90 | 31 21 | 0.6 | 1 | 1 |
| 122 | LMC N J0523-6706 | 4.9 | 132 | 25 15 | 0.5 | 0.8 | ||
| 123 | LMC N J0523-7139 | 5.0 | 29 | 160 | 34 18 | 1 | 1 | 2 |
| 124 | LMC N J0523-6902 | 1.6 | 20 | 55 | 32 17 | 0.2 | 0.1 | 0.4 |
| 125 | LMC N J0524-6828 | 3.9 | 36 | 78 | 26 24 | 1 | 1 | 2 |
| 126 | LMC N J0524-6727 | 4.6 | 157 | 28 14 | 0.7 | 1 | ||
| 127 | LMC N J0524-7027 | 3.0 | 36 | 21 | 29 22 | 0.5 | 0.6 | 0.8 |
| 128 | LMC N J0524-6826 | 7.4 | 50 | 40 | 44 23 | 5 | 5 | 8 |
| 129 | LMC N J0524-6939 | 16.1 | 33 | 17 | 37 18 | 5 | 20 | 9 |
| 130 | LMC N J0524-6914 | 6.6 | 48 | 32 10 | 0.8 | 1 | ||
| 131 | LMC N J0524-7134 | 4.9 | 43 | 22 12 | 0.6 | 1 | ||
| 132 | LMC N J0525-6948 | 5.9 | 20 | 67 | 31 17 | 1 | 1 | 2 |
| 133 | LMC N J0525-6918 | 4.7 | 32 | 144 | 34 19 | 0.5 | 1 | 0.8 |
| 134 | LMC N J0525-6622 | 1.6 | 18 | 121 | 27 17 | 0.2 | 0.1 | 0.4 |
| 135 | LMC N J0525-6609 | 11.5 | 87 | 113 | 91 28 | 10 | 20 | 20 |
| 136 | LMC N J0526-6835 | 4.3 | 32 | 100 | 28 20 | 1 | 1 | 2 |
| 137 | LMC N J0526-6839 | 1.8 | 38 | 0 | 41 | 0.2 | 0.2 | 0.4 |
| 138 | LMC N J0526-6742 | 2.0 | 64 | 118 | 51 28 | 0.7 | 0.5 | 1 |
| 139 | LMC N J0526-6848 | 3.2 | 30 | 83 | 24 21 | 0.3 | 0.6 | 0.6 |
| 140 | LMC N J0526-6748 | 5.2 | 78 | 33 14 | 0.5 | 0.8 | ||
| 141 | LMC N J0526-6552 | 5.9 | 72 | 21 13 | 0.3 | 0.5 | ||
| 142 | LMC N J0526-6853 | 5.1 | 25 | 16 10 | 0.5 | 0.9 | ||
| 143 | LMC N J0526-7119 | 5.3 | 83 | 92 | 70 32 | 9 | 4 | 10 |
| 144 | LMC N J0527-7028 | 4.3 | 132 | 21 11 | 0.5 | 0.9 | ||
| 145 | LMC N J0527-7035 | 5.7 | 31 | 79 | 30 19 | 1 | 2 | 2 |
| 146 | LMC N J0527-7053 | 4.4 | 50 | 77 | 39 25 | 0.6 | 2 | 1 |
| 147 | LMC N J0528-7140 | 7.0 | 46 | 150 | 30 28 | 3 | 4 | 4 |
| 148 | LMC N J0528-6953 | 3.4 | 144 | 19 13 | 0.7 | 1 | ||
| 149 | LMC N J0528-7058 | 3.7 | 13 | 61 | 17 18 | 0.6 | 0.3 | 1 |
| 150 | LMC N J0529-6830 | 5.5 | 36 | 107 | 34 20 | 0.6 | 2 | 0.9 |
| 151 | LMC N J0530-7128 | 3.7 | 23 | 105 | 23 18 | 0.6 | 0.6 | 1 |
| 152 | LMC N J0530-7054 | 5.1 | 12 | 116 | 21 16 | 0.4 | 0.6 | 0.7 |
| 153 | LMC N J0530-7106 | 6.9 | 74 | 7 | 55 33 | 5 | 7 | 9 |
| 154 | LMC N J0531-6830 | 7.8 | 89 | 129 | 84 31 | 8 | 10 | 10 |
| 155 | LMC N J0532-6742 | 6.6 | 52 | 154 | 52 22 | 3 | 4 | 5 |
| 156 | LMC N J0532-7114 | 4.9 | 23 | 151 | 25 18 | 2 | 1 | 4 |
| 157 | LMC N J0532-6838 | 5.9 | 26 | 71 | 24 19 | 1 | 2 | 2 |
| 158 | LMC N J0532-6626 | 4.7 | 44 | 33 16 | 0.9 | 1 | ||
| 159 | LMC N J0532-6946 | 5.9 | 3 | 39 10 | 1 | 2 | ||
| 160 | LMC N J0532-6854 | 2.4 | 12 | 140 | 25 16 | 0.2 | 0.1 | 0.3 |
| 161 | LMC N J0532-6730 | 7.1 | 173 | 19 11 | 0.5 | 0.8 | ||
| 162 | LMC N J0532-6857 | 8.2 | 19 | 20 | 21 18 | 0.9 | 2 | 2 |
| 163 | LMC N J0533-6819 | 5.9 | 51 | 124 | 38 26 | 0.5 | 3 | 0.9 |
| 164 | LMC N J0534-6813 | 6.2 | 32 | 7 | 31 19 | 1 | 2 | 2 |
| 165 | LMC N J0535-6840 | 3.2 | 42 | 26 13 | 0.3 | 0.5 | ||
| 166 | LMC N J0535-6742 | 4.4 | 0 | 42 | 0.5 | 0.8 | ||
| 167 | LMC N J0535-7045 | 5.3 | 30 | 103 | 32 19 | 0.7 | 2 | 1 |
| 168 | LMC N J0535-6735 | 6.9 | 67 | 158 | 46 33 | 2 | 6 | 3 |
| 169 | LMC N J0535-6912 | 6.8 | 32 | 45 | 25 22 | 0.7 | 3 | 1 |
| 170 | LMC N J0535-6912 | 6.6 | 25 | 73 | 26 18 | 0.7 | 2 | 1 |
| 171 | LMC N J0535-6902 | 20.2 | 46 | 148 | 45 21 | 4 | 40 | 6 |
| 172 | LMC N J0535-6844 | 5.4 | 24 | 9 | 21 19 | 0.9 | 1 | 1 |
| 173 | LMC N J0536-7043 | 5.0 | 26 | 29 | 24 19 | 1 | 1 | 2 |
| 174 | LMC N J0536-6931 | 3.9 | 153 | 23 15 | 0.3 | 0.4 | ||
| 175 | LMC N J0536-6824 | 2.6 | 37 | 90 | 40 | 0.3 | 0.5 | 0.4 |
| 176 | LMC N J0536-7124 | 4.4 | 44 | 171 | 40 22 | 0.3 | 2 | 0.5 |
| 177 | LMC N J0537-6651 | 3.5 | 20 | 57 | 26 17 | 0.2 | 0.4 | 0.3 |
| 178 | LMC N J0537-6946 | 6.8 | 98 | 30 14 | 1 | 2 | ||
| 179 | LMC N J0537-6619 | 7.2 | 34 | 76 | 27 21 | 1 | 3 | 2 |
| 180 | LMC N J0537-6626 | 5.1 | 21 | 90 | 26 | 0.1 | 1 | 0.2 |
| 181 | LMC N J0537-6944 | 6.7 | 43 | 153 | 31 25 | 2 | 4 | 3 |
| 182 | LMC N J0537-6946 | 2.5 | 51 | 90 | 54 | 0.3 | 0.6 | 0.4 |
| 183 | LMC N J0538-6908 | 2.6 | 41 | 36 | 39 21 | 0.3 | 0.5 | 0.5 |
| 184 | LMC N J0538-6934 | 5.6 | 25 | 166 | 25 18 | 0.7 | 1 | 1 |
| 185 | LMC N J0538-7117 | 6.8 | 48 | 20 | 38 25 | 1 | 4 | 2 |
| 186 | LMC N J0538-6904 | 8.9 | 71 | 132 | 59 29 | 4 | 10 | 7 |
| 187 | LMC N J0538-7119 | 5.3 | 25 | 0 | 25 18 | 0.6 | 1 | 1 |
| 188 | LMC N J0538-7017 | 4.9 | 18 | 11 | 24 17 | 1 | 0.8 | 2 |
| 189 | LMC N J0538-6915 | 4.3 | 58 | 167 | 39 31 | 0.6 | 2 | 1 |
| 190 | LMC N J0538-6854 | 4.7 | 12 | 17 13 | 0.3 | 0.4 | ||
| 191 | LMC N J0539-6932 | 9.7 | 49 | 109 | 37 26 | 4 | 9 | 6 |
| 192 | LMC N J0539-6954 | 4.0 | 161 | 23 15 | 0.4 | 0.7 | ||
| 193 | LMC N J0539-7017 | 2.9 | 114 | 29 15 | 0.4 | 0.7 | ||
| 194 | LMC N J0539-6918 | 3.5 | 14 | 17 13 | 0.3 | 0.4 | ||
| 195 | LMC N J0539-7109 | 8.9 | 19 | 89 | 24 17 | 3 | 3 | 5 |
| 196 | LMC N J0539-7132 | 9.2 | 59 | 120 | 47 27 | 2 | 10 | 4 |
| 197 | LMC N J0540-7008 | 14.3 | 220 | 87 | 275 53 | 70 | 90 | 100 |
| 198 | LMC N J0540-7113 | 5.3 | 15 | 90 | 22 | 0.4 | 0.8 | 0.7 |
| 199 | LMC N J0540-7124 | 4.6 | 147 | 25 13 | 0.3 | 0.4 | ||
| 200 | LMC N J0540-6905 | 5.4 | 4 | 21 16 | 0.6 | 0.9 | ||
| 201 | LMC N J0540-6900 | 4.5 | 37 | 9 | 39 19 | 0.5 | 1 | 0.8 |
| 202 | LMC N J0540-7003 | 5.2 | 65 | 23 12 | 0.3 | 0.5 | ||
| 203 | LMC N J0541-7053 | 6.0 | 37 | 76 | 29 22 | 1 | 2 | 2 |
| 204 | LMC N J0541-6900 | 4.2 | 24 | 116 | 24 18 | 0.3 | 0.8 | 0.5 |
| 205 | LMC N J0542-7119 | 8.0 | 52 | 31 | 38 27 | 3 | 6 | 4 |
| 206 | LMC N J0542-6943 | 4.3 | 15 | 41 | 18 18 | 0.4 | 0.5 | 0.7 |
| 207 | LMC N J0542-6944 | 3.8 | 19 | 0 | 25 | 0.4 | 0.5 | 0.7 |
| 208 | LMC N J0543-6757 | 6.8 | 60 | 109 | 51 26 | 0.5 | 5 | 0.9 |
| 209 | LMC N J0543-6926 | 5.2 | 88 | 29 14 | 1 | 2 | ||
| 210 | LMC N J0543-7012 | 5.5 | 74 | 26 15 | 0.6 | 0.9 | ||
| 211 | LMC N J0543-6754 | 5.2 | 36 | 48 | 27 23 | 0.4 | 2 | 0.6 |
| 212 | LMC N J0543-7106 | 9.4 | 46 | 112 | 47 21 | 4 | 8 | 6 |
| 213 | LMC N J0543-6726 | 5.4 | 55 | 28 | 43 27 | 0.4 | 3 | 0.6 |
| 214 | LMC N J0543-6915 | 3.1 | 178 | 19 15 | 0.4 | 0.7 | ||
| 215 | LMC N J0544-7127 | 7.3 | 46 | 34 | 34 25 | 2 | 5 | 3 |
| 216 | LMC N J0544-6923 | 12.0 | 80 | 56 | 59 35 | 10 | 20 | 20 |
| 217 | LMC N J0544-6943 | 7.0 | 24 | 94 | 21 20 | 0.8 | 2 | 1 |
| 218 | LMC N J0544-6718 | 2.8 | 100 | 30 10 | 0.4 | 0.6 | ||
| 219 | LMC N J0545-6856 | 2.7 | 58 | 0 | 60 | 0.3 | 0.8 | 0.4 |
| 220 | LMC N J0545-6949 | 7.7 | 31 | 95 | 24 22 | 3 | 3 | 5 |
| 221 | LMC N J0545-6708 | 5.3 | 28 | 73 | 31 18 | 0.7 | 1 | 1 |
| 222 | LMC N J0546-7105 | 6.3 | 134 | 29 14 | 0.8 | 1 | ||
| 223 | LMC N J0546-6937 | 7.7 | 39 | 123 | 34 21 | 2 | 4 | 4 |
| 224 | LMC N J0547-6808 | 3.9 | 28 | 154 | 33 18 | 0.5 | 0.8 | 0.9 |
| 225 | LMC N J0547-7041 | 9.5 | 73 | 125 | 57 31 | 8 | 10 | 10 |
| 226 | LMC N J0547-6953 | 6.7 | 55 | 5 | 43 26 | 4 | 5 | 6 |
| 227 | LMC N J0548-7007 | 7.2 | 47 | 133 | 45 21 | 2 | 5 | 4 |
| 228 | LMC N J0548-7034 | 4.4 | 121 | 29 12 | 0.3 | 0.5 | ||
| 229 | LMC N J0550-6827 | 2.5 | 69 | 30 16 | 0.3 | 0.5 | ||
| 230 | LMC N J0555-6811 | 6.3 | 82 | 79 | 78 29 | 3 | 6 | 4 |
| Mass rangeaaClouds from the 230 GMCs with mass indicated in this column are used to derive a mass spectrum. | bbIndex value of the best-fitting power law, () , to the mass spectrum of the clouds with mass indicated in the 1st column. | Number of cloudsccNumber of the clouds used to fit the power law. |
|---|---|---|
| 0.75 0.06 | 191 | |
| 0.88 0.08 | 146 | |
| 0.93 0.10 | 123 | |
| 0.98 0.11 | 100 | |
| 1.0 0.1 | 67 | |
| 1.2 0.2 | 47 | |
| 1.6 0.3 | 28 |
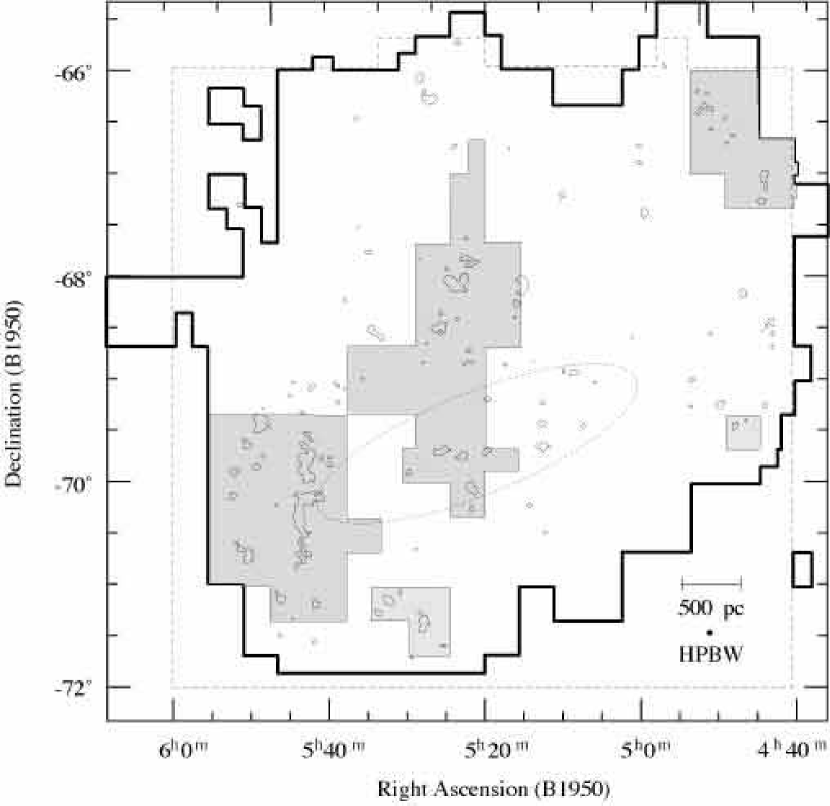
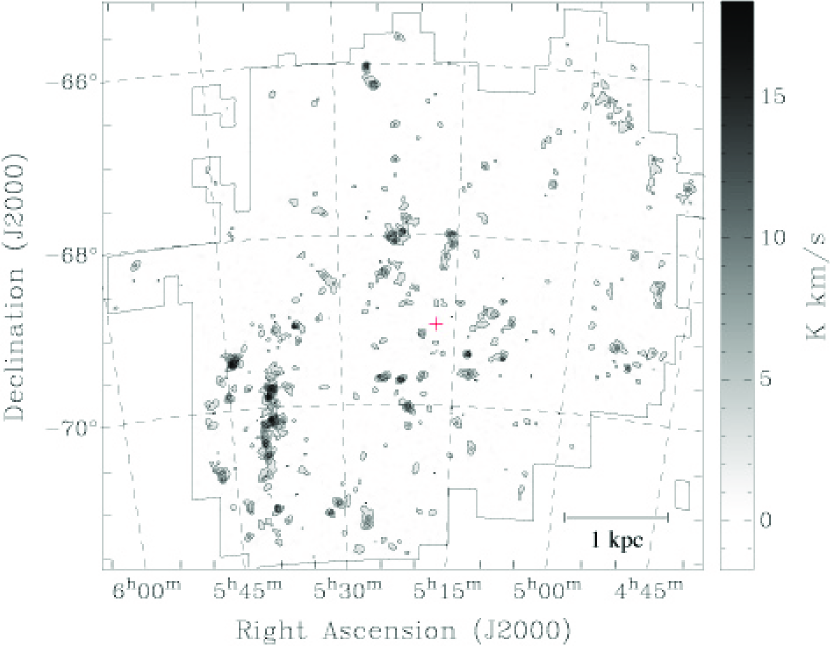
![[Uncaptioned image]](/html/0804.1458/assets/x3.png)
Fig. 2. — continued
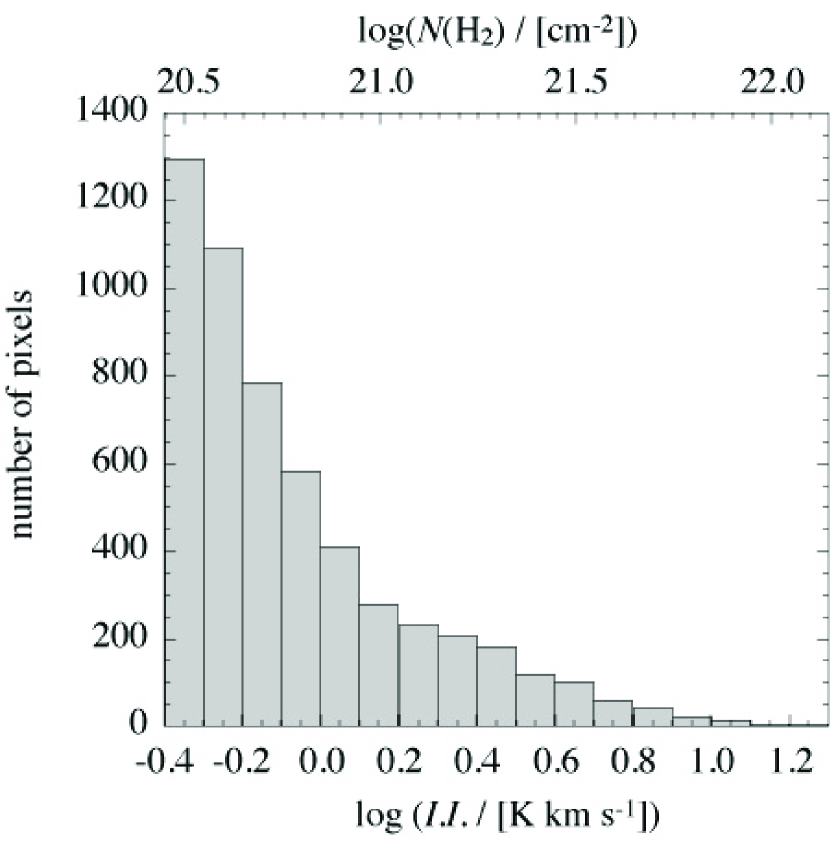
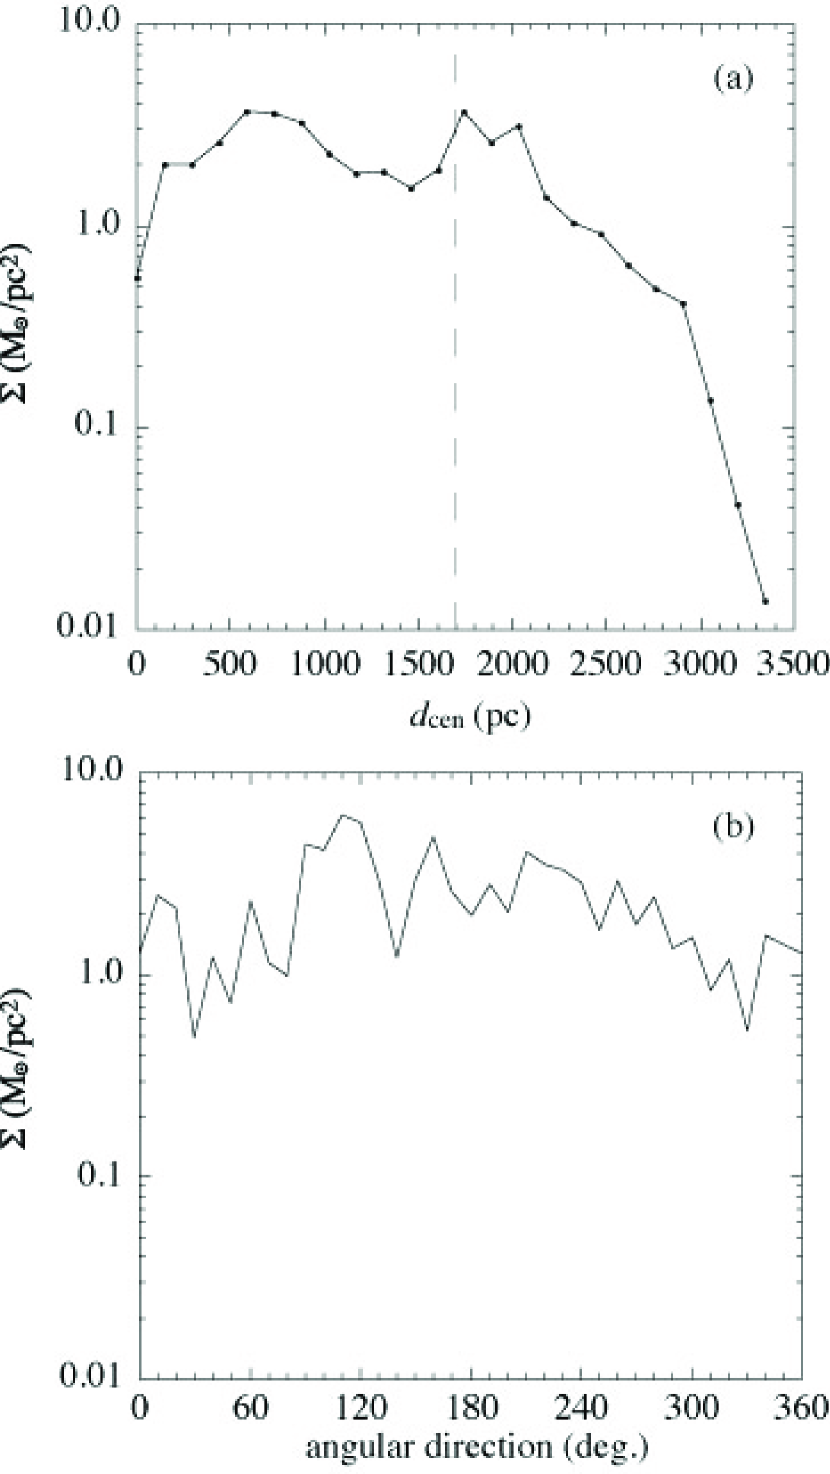
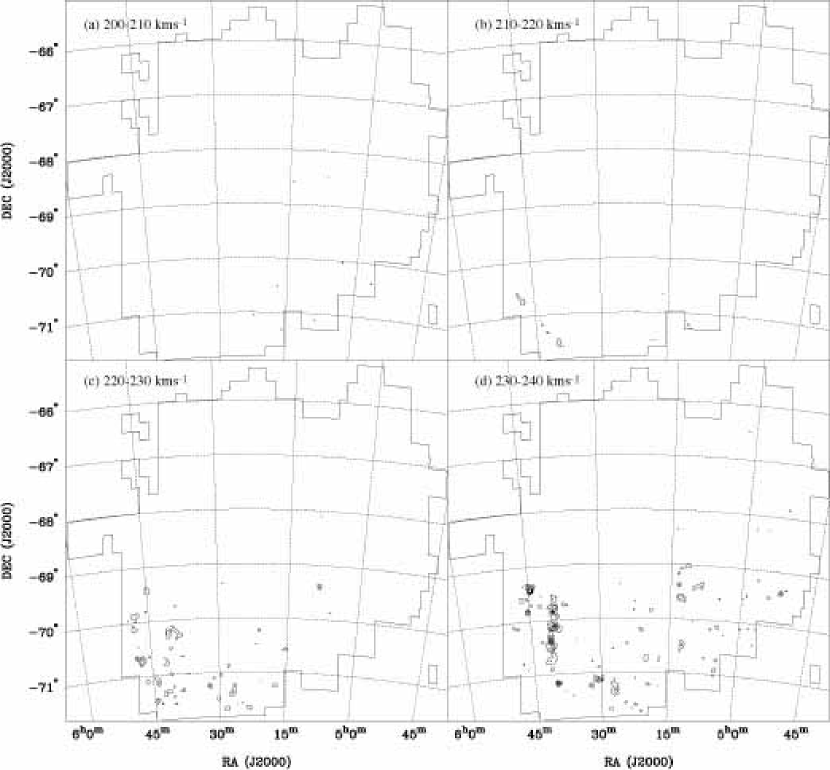
![[Uncaptioned image]](/html/0804.1458/assets/x7.png)
Fig. 5. — continued
![[Uncaptioned image]](/html/0804.1458/assets/x8.png)
Fig. 5. — continued