Quantitative Theory of a Relaxation Function in a Glass-Forming System
Abstract
We present a quantitative theory for a relaxation function in a simple glass-forming model (binary mixture of particles with different interaction parameters). It is shown that the slowing down is caused by the competition between locally favored regions (clusters) which are long lived but each of which relaxes as a simple function of time. Without the clusters the relaxation of the background is simply determined by one typical length which we deduce from an elementary statistical mechanical argument. The total relaxation function (which depends on time in a nontrivial manner) is quantitatively determined as a weighted sum over the clusters and the background. The ‘fragility’ in this system can be understood quantitatively since it is determined by the temperature dependence of the number fractions of the locally favored regions.
Two fundamental riddles in glass-forming systems 96EAN ; 01Don are (i) what determines the spectacular slowing down of the relaxation to equilibrium when the temperature is lowered through a relatively short interval, and (ii) how to predict theoretically the functional forms of various relaxation functions. In practice one usually fits the data to phenomenological relaxation functions (e.g. the Kohlrausch-Williams-Watt KKW law) without any theoretical justification. Here we employ a classical example of glass-formation, i.e. a binary mixture of particles with different interaction diameters, to demonstrate unequivocally that the slowing down is due to the creation of clusters of local order; these are mechanically stable and slow to relax. We present a quantitative computation of a (functionally non-trivial) and strongly temperature-dependent relaxation function by presenting it as a weighted sum of cluster contributions each of which decays as a simple relaxation function.
The model discussed here is the classical example 89DAY ; 99PH of a glass-forming binary mixture of particles in a 2-dimensional domain of area , interacting via a soft repulsion with a ‘diameter’ ratio of 1.4. More or less related models can be found in FA1984 ; davisonsherrington2000 ; sh2002 ; schliecker2002 ; Jstatmech2007 ; benarous2006 . We refer the reader to the extensive work done on this system 89DAY ; 99PH ; 07ABHIMPS ; 07HIMPS ; 07IMPS . The sum-up of this work is that the model is a bona fide glass-forming liquid meeting all the criteria of a glass transition. In short, the system consists of an equimolar mixture of two types of particles, “large” with ‘diameter’ and “small” with ’diameter‘ , respectively, but with the same mass . The three pairwise additive interactions are given by the purely repulsive soft-core potentials
| (1) |
where and . The cutoff radii of the interaction are set at . The units of mass, length, time and temperature are , , and , respectively, with being Boltzmann’s constant. The results presented below are extracted from molecular dynamics simulations using 30 independent systems of 4096 particles each, using the Nose-Poincare-Andersen thermostat 00SL . We employ periodic boundary conditions on the torus.
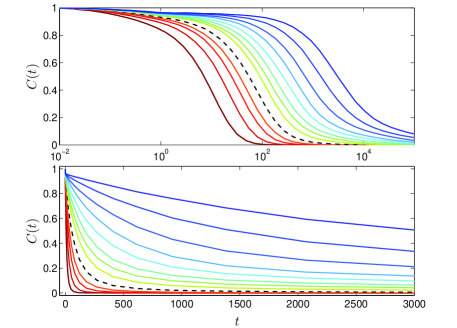
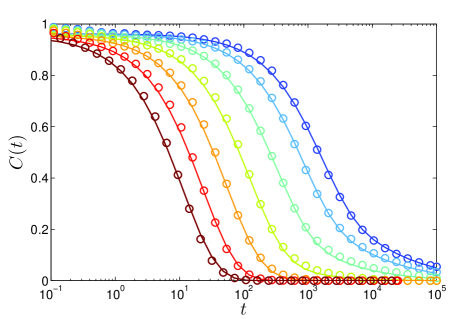
The relaxation function. For the sake of this Letter we introduce a relaxation function that is made as follows. At time zero every large particle in the system is assigned a value and a neighbour list consisting of its (small or large) nearest neighbours. In time nearest neighbours wander into the yonder, and when the th particle loses one (respectively two, three) of its nearest neighbours, having at that time (respectively ) of the original list, it is assigned a value and 0 respectively. The relaxation function that we monitor is . Fig. 1 shows how the relaxation function decays in logarithmic time for different temperatures as indicated in the figure legend. While at high temperatures () the function can be fitted to a stretched exponential, for lower temperatures a long tail develops (starting at ), destroying any fit to a stretched exponential, as can be seen in the lower panel where the same data is presented in linear time. Note the extreme slowing down exhibited in the lowest eight temperatures.
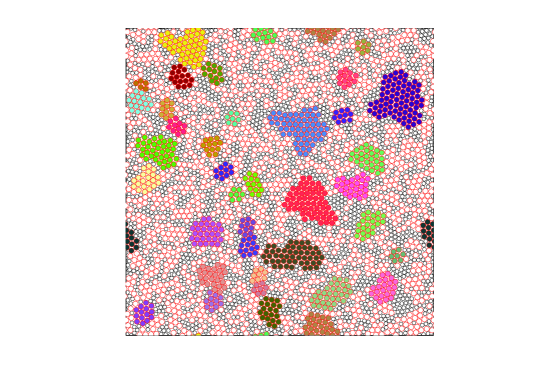
To gain a quick insight as to the nature of the slowing down it is advantageous to watch a movie of the decay of the relaxation function. Such a movie is provided as a supplementary information to this Letter movie . Color coding in green every particle whose assigned value , it is obvious from the movie that a fraction of particles lose their green colour very rapidly, whereas the non-zero values of at longer times are contributed entirely by clusters of large particles in local hexagonal order. This visual observations brings us to the central theme of this Letter. We propose that the present glass-former belongs to a generic class of glass-forming systems that have competing states (of crystalline order or not) which are locally close in energy to the ground state (which is typically unique). Upon rapid cooling, such systems exhibit patches (or clusters) of these competing states which become locally stable in the sense of having a relatively high local shear modulus. It is in between these clusters where ageing, relaxation and plasticity under strain can take place. A still picture of a typical realization of this system is provided in Fig. 2 where the locally hexagonal clusters of large particles are highlighted in colour (no meaning to different colours). For clarity of presentation we do not show in this figure the local hexagonal patches of small particles, or any other cluster of a competing phase.
Cluster decomposition formula. In the rest of this Letter we show that this insight is the basis of a quantitative theory of the relaxation function. To this aim we separate in our mind the clusters (here we only take into account the clusters of large particles in hexagonal local order, which are like curds) from the rest of the system, which we refer to as the whey. In the whey the relaxation process is dominated by ‘defects’, mainly large particles in pentagonal cages and small particles in heptagonal cages 07ABHIMPS ; 07HIMPS . The relaxation process necessitates a pair-wise annihilation of such defects, because of the Euler constraint (requiring on the torus an average of six neighbours per particle). If the average distance between such ‘defects’ is a temperature dependent typical , the analysis of 07ILLP ; 08EP showed that the relaxation of such defects is determined by a typical relaxation time which depends on the temperature according to
| (2) |
where is a constant having dimensions of . Clearly, in order to estimate the typical distance between such defects we need to know how many particles belong to clusters. Denote the number of clusters of size by ; then is the probability to find a large particle in a cluster of size . The number density of large particles in the whey is . To estimate we denote by and the average enthalpy of a large particle inside a cluster and in the whey respectively, and . There are ways to organize the neighbours of a large particle in the whey (neglecting the rare large particle in heptagonal neighbourhood), but only one way in the cluster. Thus the number density of particles in the clusters is
| (3) |
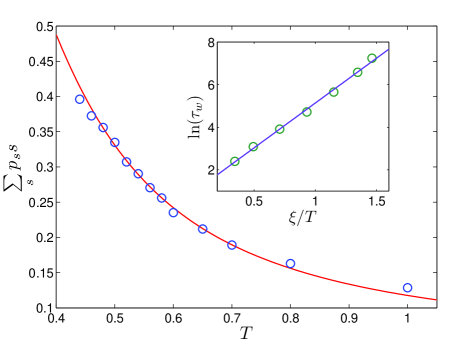
This estimate, with agrees very well with the measured value of , as can be shown in Fig. 3. From here we can determined , the typical distance between ‘defects’, as
| (4) |
To demonstrate the usefulness of this equation we have computed the relaxation function only for particles in the whey, calling it , and found that it can be excellently fitted to the simple relaxation function
| (5) |
with and . The values of were extracted from such measurements at different temperatures, and plotted as vs. . The results are shown as the inset in Fig. 3 in very satisfactory agreement with Eq. (2) with .
Note that it is highly non-trivial that exactly the same relaxation function describes the dynamics in the whey at all temperatures. We will see that this changes dramatically when the clusters are added to the picture. The coefficient of 0.95 represents an almost -independent drop in which results from thermal vibrations on the scale of one . The exponent 0.83 is a fit that appears to be specific to the present relaxation function.
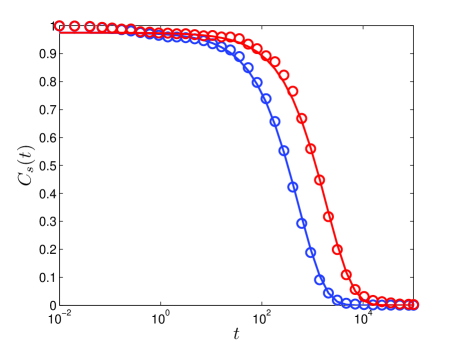
Having understood the relaxation function of the whey we turn now to the relaxation function of the clusters. Our best statistics is for relatively small clusters, and we demonstrate in Fig. 4 that the small clusters relax again as the same simple function of time as the whey, but with and an dependent relaxation time which can be fitted to
| (6) |
Note that this typical relaxation time for clusters of size goes smoothly to the whey when . For larger clusters it is more difficult to say anything precise since the statistics deteriorates very rapidly. Nevertheless, we will show now that the model (6) is sufficient for our purposes, and that we can compute the total relaxation function quantitatively using this simple model. To do so we present the relaxation function as a sum over the whey and the clusters in the “cluster decomposition formula (CDF)”
| (7) |
It is important to note that at this point there is only one parameter left to fit, which is in Eq. (6). The best fit is with which we predict the relaxation functions as shown in Fig. 5.
It is obvious that the CDF captures quantitatively both the time and the temperature dependence of the relaxation function. We submit to the reader that a comparison of data and theory of this quality had been quite rare in the subject of glass-forming systems.
We strongly believe that a similar approach should be relevant for a whole class of glass-forming systems where clusters of competing phases can form upon rapid cooling GS82 ; 93Cha ; 98KT ; 00TKV ; 06Lan ; 06ST ; 08HP . It does not mean however that one can automatically apply what had been done here to other cases. In each case the physics of the glass-former should be carefully understood to identify what are the clusters that dominate at longest times. For example in hydrogen bonded systems these may be compact clusters, fractal clusters or chains of molecules, giving difficult to guess formulae for as a function of the size of the cluster and of the temperature . In addition, we should stress that in the present case we have measured the distribution ; it is very desirable to derive this distribution from statistical mechanical first principles, as well as to provide a theoretical background to the fitted law (6). Notwithstanding these issues that remain for future research we propose that this example provides unequivocal evidence that the existence of locally favoured structure whose relaxation is much slower than the whey is fundamental to the understanding of the phenomenology of the glass-transition.
References
- (1) For a balanced review on glass-formers in which many of the common concepts and terminologies are well spelled out see M.D. Ediger, C.A. Angell and S.R. Angell, J. Phys. Chem. 100, 13200 (1996).
- (2) see E. Donth, The Glass Transition, (Springer, Berlin, 2001) and references therein.
- (3) D. Deng, A.S. Argon and S. Yip, Philos. Trans. R. Soc. London Ser A 329, 549, 575,595, 613 (1989).
- (4) D.N. Perera and P. Harrowell, Phys. Rev. E 59, 5721 (1999) and references therein.
- (5) G.H. Frederikson, and H.C. Anderson, Phys. Rev. Lett. 53, 1244 (1984).
- (6) L. Davison and D. Sherrington. Glassy behaviour in a simple topological model. J. Phys. A 33 (2000), 8615–8625.
- (7) D. Sherrington, L. Davison, A. Buhot, and J. P. Garraham. J. Physics: Condens, Matter 14 (2002), 1673–1682.
- (8) G. Schliecker. Adv. Physics 51 (2002), 1319–1378.
- (9) S. Léonard, P. Mayer, P. Sollich, L. Berthier and J.P. Garrahan, J. Stat. Mech. (2007).
- (10) G. Ben Arous and J. Černý. In: A. Bovier, F. Dunlop, A. van Enter, and J. Dalibard, eds., Mathematical Statistical Physics, Les Houches, Session LXXXIII (Elsevier, 2006).
- (11) E. Aharonov, E. Bouchbinder, H.G.E. Hentschel,V. Ilyin, N. Makedonska, I. Procaccia and N. Schupper, Europhys. Lett. 77, 56002 (2007) .
- (12) H. G. E. Hentschel, V. Ilyin, N. Makedonska, I. Procaccia and N. Schupper, Phys. Rev. E 76, 052401 (2007) .
- (13) V. Ilyin, N. Makedonska, I. Procaccia, N. Schupper, Phys. Rev. E 76, 052401 (2007).
- (14) The movie is provided as Supplementary Information, temporarily available at http://www.weizmann.ac.il/chemphys/cfprocac/home.html
- (15) J.B. Sturgeon and B.B. Laird, J. Chem. Phys. 112 , 3474–3482 (2000)
- (16) V. Ilyin, I. Procaccia, I. Regev, N. Schupper, “Ageing and Relaxation in Glass Forming Systems”, Phys.Rev. E., submitted. Also: arXiv:0803.2602
- (17) V. Ilyin, E. Lerner, T-S. Lo and I. Procaccia, Phys. Rev. Lett., 99, 135702 (2007)
- (18) J.-P. Eckmann and I. Procaccia “Ergodicity and Slowing Down in Glass-Forming Systems with Soft Potentials: No Finite-Temperature Singularities”, Phys. Rev. E, submitted, Also: arXiv:0802.4346
- (19) A. Geiger and H.E. Stanley, Phys. Rev. Lett. 49, 1749 (1982).
- (20) R.V. Chamberlin, Phys. Rev. B48, 15638 (1993).
- (21) D. Kivelson and G. Tarjus, Phil. mag. B 77, 245 (1998)
- (22) G. Tarjus, D. Kivelson and P. Viot, J. Phys. Condens. Matter 12, 6497 (2000).
- (23) J.S. Langer, Phys, Rev. Lett. 97, 115704 (2006); Phys Rev. E, 73, 041504 (2006).
- (24) H. Shintani and H. Tanaka, Nature Physics 2, 200 (2006).
- (25) H.G.E. Hentschel and I. Procaccia, “Theory of Relaxation Dynamics in Glass-Forming Hydrogen-Bonded Liquids”, Phys. Rev. E, in press.