Vol.0 (200x) No.0, 000–000
11email: zzwu@shao.ac.cn 22institutetext: Joint Institute for Galaxy and Cosmology (JOINGC) of SHAO and USTC
33institutetext: Graduate School of the Chinese Academy of Sciences, Beijing 100039
The debeamed luminosity, sychrotron peak frequency and black hole mass of BL Lac objects
Abstract
We estimate the intrinsic luminosities and synchrotron peak frequency using the derived Doppler factor for a sample of 170 BL Lac objects, of which the synchrotron peak frequency are derived by fitting the SED constructed with the collected multi-band data from literatures. We find that the debeamed radio and optical core luminosities follow the same correlation found for FR I radio galaxies, which is in support of the unification of the BL Lac objects and the FR I galaxies based on orientation. For the debeamed luminosity at synchrotron peak frequency, we find a significant positive correlation between the luminosity and intrinsic synchrotron peak frequency. This implies that the more powerful sources may have the majority of jet emission at higher frequency. At synchrotron peak frequency, the intrinsic luminosity and black hole mass show strong positive correlation, while mild correlation is found in the case of jet power, indicating that the more powerful sources may have heavier black hole.
keywords:
black hole physics — BL Lacertae objects: general — galaxies: active — galaxies: jets — galaxies: nuclei1 Introduction
BL Lac objects are one of the most extreme classes of active galactic nuclei (AGN) with no emission lines or less of them, but they have a strong highly variable and polarized non-thermal continuum emission ranging from radio to -ray bands. Traditionally, they have been divided into radio-selected and X-ray-selected BL Lac objects (RBLs and XBLs, respectively) based on the surveys they were primarily discovered. In recent years, the dichotomy has been replaced by a more physically meaningful classification based upon the overall spectral energy distribution (SED) of the object, namely, low frequency peaked BL Lac objects (LBL), intermediate objects (IBL) and high frequency peaked BL Lac objects (HBL) (Padovani & Giommi, 1995). Generally, RBLs tend to be LBLs, and XBLs tend to be HBLs (see review by Urry & Padovani (1995)). The synchrotron peak frequency of RBLs is usually in the radio/IR band, while UV/X-ray band for XBLs (Giommi et al., 1995). The recent studies on the SED of large samples of BL Lac objects shown that BL Lac objects most likely form one class with a continuous distribution of synchrotron emission peak energies, while RBLs and XBLs represent the opposite ends of the continuum (Nieppola et al., 2006).
Fossati et al. (1998) and Ghisellini et al. (1998) have proposed the so-called ‘blazar sequence’ with plots of various powers vs. the synchrotron peak frequency for a sample of blazars containing flat-spectrum radio quasars (FSRQ) and BL Lac objects, of which an anti-correlation was apparent, with the most powerful sources having relatively small synchrotron peak frequencies and the least powerful ones having the highest . The theoretical interpretation to these anti-correlations was proposed by Ghisellini et al. (1998): the more powerful sources suffered a larger probability of losing energy and therefore are subjected to more cooling and therefore translates into a lower value of . However, the recent studies have largely changed this scenario. Recently, Nieppola et al. (2006) proposed that there are anti-correlations between the luminosity at 5 GHz, 37 GHz, and 5500 and for a large sample of BL Lac objects, while based on all the correlations with , they concluded that the blazar sequence scenario is not valid. Through estimating the Doppler factor for a sample of 170 BL Lac objects selected from Nieppola et al. (2006), Wu et al. (2007) found a significant anti-correlation between the total 408 MHz luminosity, which is supposed to be intrinsic, and the intrinsic , with a large scatter which however undermines the ‘blazar sequence’. Moreover, the evidence of low-power LBLs has been recently discovered (Padonavi et al. 2003; Caccianiga & Marchã 2004; Antón & Browne 2005), and the possible discovery of high luminosity HBLs is also reported in the Sedentary survey (Giommi et al., 2005). In addition, the high-power-high- FSRQs were found in the Deep X-ray Radio Blazar Survey (DXRBS), which is both X-ray and radio-selected, though they do not reach the extreme values of HBLs. From all these discoveries, it seems that the blazar sequence in its simplest form cannot be valid (Padovani 2006). By now, what are the main physical parameters that determines the shift of the synchrotron peak frequency of BL Lac objects seems still unclear.
According to the unified scheme for AGNs, BL Lac objects are thought to be low-luminosity radio galaxies viewed at relatively small angles to the line of sight and the relativistic beaming has an enormous effects on the observed luminosities. Generally, the intrinsic (debeamed) luminosity emitted from jet in BL Lac objects can be estimated using the Doppler factor and assuming the jet geometry. Using the empirical relation of Giovannini et al. (2001), Wu et al. (2007) estimated the Doppler factor for a sample of 170 BL Lac objects with the observed radio core observed either with VLA or MERLIN. In this paper, we will correct the beaming effect in the multi-band luminosity and the synchrotron peak frequency directly using the derived Doppler factor of Wu et al. (2007) for the same sample. Our aim is mainly to investigate the correlation between the luminosity at synchrotron peak frequency and the synchrotron peak frequency after eliminating the beaming effect. The layout of this paper is as follows. The sample is given in Sect. 2. In Sect. 3, the various correlation analysis are presented, which involves the multi-band luminosity, the synchrotron peak frequency, and the black hole mass as well. The discussions are shown in Sect. 4, and the results are summarized in Sect. 5. Throughout the work, we adopt the following values for the cosmological parameters: , , and , except an otherwise stated. The spectral index is defined as .
2 The Sample
Nieppola et al. (2006) presented a large sample of BL Lac objects from the Metshovi radio observatory BL Lac sample consisting of 381 objects selected from the Veron-Cetty & Veron BL Lac Catalogue (Veron-Cetty & Veron 2000), and 17 objects from the literature, of which many sources are from the well-known BL Lac samples like 1Jy, S4, S5, Einstein Medium Sensitivity Survey (EMSS), Einstein Slew Survey, and DXRBS. The authors argued that this sample is supposed to have no selection criteria (other than declination) in addition to the ones in the original surveys. From this sample, Wu et al. (2007) estimated the Doppler factor for a sample of 170 BL Lac objects using the radio core emission from either VLA or MERLIN observations. The sample investigated in this paper is same as that in Wu et al. (2007), i.e. 170 BL Lac objects with estimated . The Doppler factor was estimated using the correlation found by Giovannini et al. (2001) for radio galaxies,
| (1) |
where Pci5 is the intrinsic core 5 GHz radio power derived assuming (see Giovannini et al. (2001) for details), and is the total radio power at 408 MHz. From the measured total 408 MHz radio power, we can obtain the intrinsic core radio power. Thus, the Doppler factor can be got from (corresponding to a continuous jet), assuming , where is the observed 5 GHz core luminosity (see Wu et al., 2007, for details).
To construct the SED for all 170 BL Lac objects, we collected the radio, optical and X-ray data from NASA/IPAC Extragalactic Database (NED), the Astrophysical Catalogues Support System (CATs) maintained by the Special Astrophysical Observatory, Russia, and the catalogue of integral blazar working group (IBWG)111http://altamira.asu.cas.cz/iblwg/catalog.php. The R band core luminosity were mainly obtained from Urry et al. (2000), O’Dowd & Urry (2005), and Nilsson et al. (2003). The X-ray data were collected from Laurent-Muehleisen et al. (1999), Donato et al. (2001), Rector & Stocke (2000), Reich et al. (2000), Turriziani et al. (2007), and RBSC-NVSS (2000). The Galactic extinction in optical band were corrected using the value from NED. Following Nieppola et al. (2006), the SED of each source were constructed in the representation in the observer’s frame, based on the multi-frequency data. The synchrotron component of the SED was fitted with a parabolic function , therefore, the synchrotron peak frequency in the rest frame was obtained as , in which is redshift.
In principle, whether or not to include X-ray data in the fit can be decided based on the X-ray spectral index fitted from high quality X-ray spectra. A X-ray spectral index of means a synchrotron origin of X-ray emission, while indicates an inverse Compton process origin, which implies that the X-ray data should be excluded in the fit. Unfortunately, most of sources in our sample have no well-measured X-ray spectral index, which precludes us to do so. Tentatively in this work, whether or not to include X-ray data in the fit was decided solely based on a visually inspection on the SED of each object. Similar to Wu et al. (2007), the objects were assigned an LBL/IBL/HBL classification according to : for LBLs log 14.5, for IBLs 14.5 log 16.5, and for HBLs log 16.5.
We estimated the jet power using the formula derived from Punsly (2005):
| (2) |
| (3) |
where is the optically thin flux density from the lobes measured at 151 MHz in units of janskys, and the value of is a good fiducial value (see Punsly, 2005, for more details). We calculated the through the extrapolation from either the extended radio flux at 5 GHz or 1.4 GHz, or the low frequency total radio flux assuming =1.0.
To estimate the black hole mass, we collected the R-band magnitude of host galaxies for 121 sources, of which the core R-band magnitude are also available. Following Wu et al. (2007), we adopted the average redshift of the classification (i.e. LBLs, IBLs and HBLs) for sources without redshift. The sample is listed in Table 1: Col. (1) the source IAU name (J2000), Col. (2) the source alias name, Col. (3) the redshift, Col. (4) the intrinsic synchrotron peak frequency, Col. (5) the observed synchrotron peak luminosity, Col. (6) the jet power, Col. (7) the Doppler factor measured in Wu et al. (2007), Cols. (8) - (9) the R-band magnitude of the host galaxies and the corresponding references, respectively, Col. (10) the black hole mass.
3 Correlation analysis
It is commonly accepted that the luminosity of blazars is dominated by the emission from jets, which however is Doppler boosted. Using the Doppler factor derived in Wu et al. (2007) and assuming a same Doppler factor at various wavebands of synchrotron emission as suggested by Capetti et al. (2002) and Trussoni et al. (2003), we calculate the intrinsic luminosity using (corresponding to a continuous jet), in which is the intrinsic luminosity, the observed luminosity. Since the synchrotron peak frequency , the intrinsic one can be obtained as , which is only dependent of and , where is the strength of the magnetic field, the Doppler factor, and a characteristic electron energy that is determined by a competition between accelerating and cooling processes. With the intrinsic parameters, we explore various correlations below.
3.1 Radio and optical core luminosity
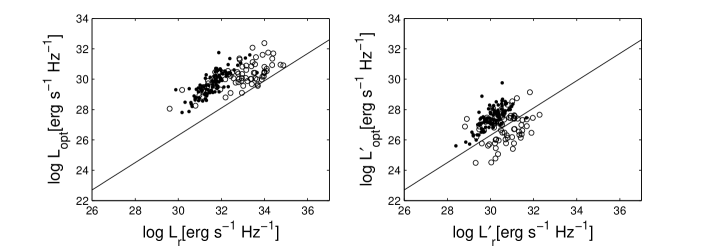
We plot the observed radio and optical core luminosity in the left panel of Fig. 1, together with the best fit (the solid line) of the correlation found by Chiaberge et al. (1999) for FR I nuclei. The objects in the present sample span about five orders of magnitude in the radio core luminosity, and the optical core luminosity increase linearly with it over this range. There is a significant correlation between the radio and optical core luminosity at 99.99% level, which is confirmed by the partial correlation analysis to exclude the common dependence on the luminosity distance. This correlation suggests that the emission at two wavebands is ascribed to the same non-thermal process, just like in FR I radio galaxies. However, we find that the points are all above the fitted line of Chiaberge et al. (1999), and the optical core luminosity are brighter with about two orders of magnitude than that of FR I nuclei, at the same radio core luminosity.
We correct the beaming effect for the radio and optical core luminosity with the estimated Doppler factor. The intrinsic optical core luminosity are estimated assuming (Falomo et al., 1994), while we use in the radio band. We also recalculated the luminosities in the hypothesis of a bulk Lorentz factor of and a viewing angle of , which is the average angle expected for the population of FR I radio galaxies used by Chiaberge et al. (1999) to derive the correlation. The recalculated luminosities are presented in the right panel of Fig. 1. It’s apparent that the data points move to the lower radio and optical luminosity due to the debeaming. Although with some scatter, the debeamed radio and optical luminosity follow the correlation of Chiaberge et al. (1999) for FR I nuclei. This supports a common nature of BL Lac objects and FR I radio galaxy nuclei, which is consistent with the results of Giroletti et al. (2006) from the study of 29 nearby BL Lac objects.
3.2 Synchrotron peak frequency and luminosity
In the left panel of Fig. 2, we present the relationship between the observed peak luminosity and synchrotron peak frequency , while the relation of the intrinsic parameters and is shown in the right panel. We find a weak negative correlation between and . In contrast, after correcting the beaming effect both in the peak luminosity and synchrotron peak frequency, we find a significant positive correlation between and with a Spearman correlation coefficient of at 99.99% confidence level. It should be noted that this correlation may be caused by the common dependence of the both parameters on the Doppler factor, as ( in this case) and . We therefore use the partial Spearman correlation method (Macklin 1982) to check this correlation. Still, a significant correlation with a correlation coefficient of 0.33 is present at 99.99% significance level between and , independent of the Doppler factor. To further check this correlation, we also perform a statistic analysis on the sources in the restricted Doppler factor range 3.5. For this subsample of sources, there is no correlation between the Doppler factor and , while a significant correlation is still present between and with a Spearman correlation coefficient of r=0.37, at over 99% significance level (see Fig. 2). Therefore, we conclude that the positive correlation between the intrinsic peak luminosity and intrinsic peak frequency might be intrinsic, at least for our present sample.
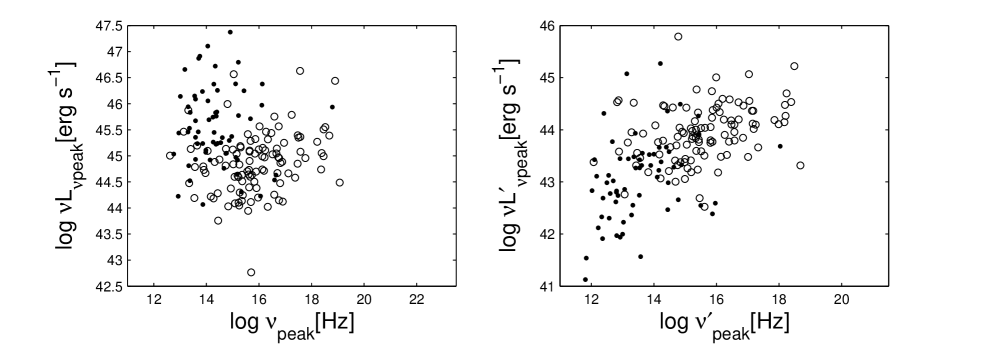
The intrinsic luminosity at synchrotron peak frequency can be a good indicator of the jet emission due to the fact that the majority of jet synchrotron emission are radiated at the synchrotron peak frequency. Therefore, the significant positive correlation between and implies that the jet emission are tightly related with the synchrotron peak frequency, which is only dependent of and .
3.3 The black hole mass and luminosity
We estimated the black hole mass using the relation between the R-band absolute magnitude of host galaxy and the black hole mass proposed by McLure & Dunlop (2002):
| (4) |
for 121 sources with available from literature. There are four sources without measured redshift, which are excluded from the correlation analysis.
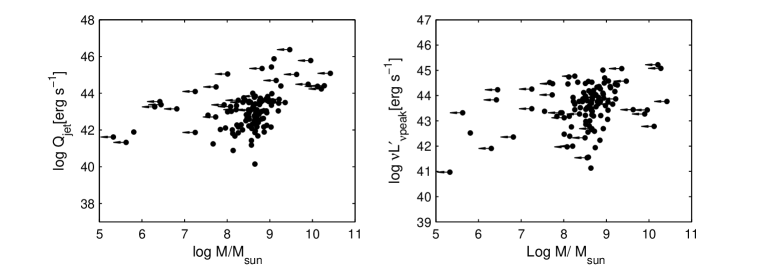
Fig. 3 shows the correlation between the black hole mass and jet power (left), and intrinsic peak luminosity (right). The black hole mass of 34 sources are only given as an upper limit due to the faintness and the upper limit of R-band magnitude of host galaxies. We used the astronomy Survival Analysis (ASURV) package (Isobe & Feigelson 1990; Lavalley et al. 1992) when we investigate the correlation involving these upper limits. We find a strong correlation between the intrinsic peak luminosity and the black hole mass with a correlation coefficient of at 99.7% confidence level, while there is originally no correlation between the observed peak luminosity and the black hole mass. The partial correlation analysis to exclude the common dependence on redshift still show a significant correlation at 99.9% significance level. Moreover, we find a mild correlation between the jet power and the black hole mass at about 95% confidence level, which is also confirmed by the partial correlation analysis. These results imply that the sources with larger jet power and/or jet emission systematically possess heavier black holes.
4 Discussion
It can be seen from Fig. 2 that very high synchrotron peak frequency exist in several objects with . Ghisellini et al. (1999) have suggested the existence of ultra-high-energy synchrotron peak BL Lacs (UHBLs), whose synchrotron peak frequencies lies at even higher frequencies than that of conventional HBLs, . In our sample, we find eight objects with (see Table 1), which thus can be potential UHBLs. However, as Nieppola et al. (2006) pointed out, using a simple parabolic function in the fitting may produce some error, especially among HBLs, and the peak frequencies of the most extreme objects can be exaggerated and cannot be considered as definite. Although there are no sources with extreme peak frequency in our sample, we conservatively re-examine our results after excluding all eight sources with . We find it does not alter our results.
We note that equation (1) used to estimate the Doppler factor is based on the assumption of a Lorentz factor of five (Giovannini et al., 2001). As Giovannini et al. (2001) claimed, the similar correlation can be obtained for in the range 3-10, so generally equation (1) can be extensively used in this range. However, the simplification of similar Lorentz factor in a sample may produce errors in the estimated Doppler factor. As a matter of fact, the superluminal motion studies (Vermeulen & Cohen, 1994; Jorstad et al., 2001, 2005) showed that some LBLs may have large apparent velocity, in some cases, which implies that their Lorentz factor are larger than 10. We collected the available apparent velocity for 27 sources of our sample from literatures, and find that the median value is about 3c, and only three sources with apparent velocity larger than 10c. As BL Lac objects are normally viewed at small viewing angle, the Lorentz factor can be roughly constrained if we assume the viewing angle . We find that the median value of the constrained Lorentz factor is right in the range 3-10. Moreover, utilizing the variability Doppler factor and apparent velocity, Lähteenmäki & Valtaoja (1999) and Valtaoja et al. (1999) showed that the averaged lorentz factors of radio selected BL Lac objects are around 5. In addition, Gabuzda et al. (2000) found no evidence that the typical jet Lorentz factor exceed from the apparent superluminal speed distribution of 16 northern BL Lac objects. We thus conclude that the assumption of a Lorentz factor of 5, or a range of 3-10 is a good approximation although the exceptions do exist. We find that the sources with large apparent velocity are mainly LBLs. If these sources do have Lorentz factor larger than ten, our method may likely underestimate the Doppler factor. Adopting a real Doppler factor may produce a smaller intrinsic synchrotron luminosity than ours, which however may strengthen our results since these sources will be lower down vertically in the LBL region in Fig. 2.
The ‘blazar sequence’, power - anti-correlation, was originally presented by Fossati et al. (1998) based on one radio- and one X-ray-selected BL Lacs samples, and one FSRQ sample. These samples had been assembled in an independent and somewhat different way, especially so as regarding the selection band, and indeed none of the individual samples in Fig. 7 of Fossati et al. (1998) shown the claimed anti-correlation between power and , which was only apparent by combining the three samples (Padovani, 2007). The blazar sequence was recently tested by Nieppola et al. (2008). After eliminating the beaming effect on peak frequencies and luminosities, Nieppola et al. (2008) found that the blazar sequence disappears. Instead, for BL Lac objects separately, they found a positive correlation between the synchrotron peak frequencies and luminosities. Intriguingly, this is consistent with our results. The blazar sequence thus can be an observational phenomenon created by variable Doppler boosting across the synchrotron peak frequency range (Nieppola et al., 2008). By now which really determines the shifting of the synchrotron peak frequency seems still unclear. Wang et al. (2002) claimed that the shape of SEDs is related to the accretion rate in BL Lac objects. They found that HBLs and LBLs follow the different anti-correlation between the peak frequency and accretion rate, which may indicate differences in the physical processes associated with the jets. We re-studied their results by collecting the emission line flux and using the intrinsic peak frequency for our samples. We found that the overall relation between the peak frequency and accretion rate is similar to their results. However, the correlation in HBLs and LBLs separately are not evident. The difference may be partly because we are using the intrinsic peak frequency. On the other hand, the number of BL Lac objects with the detected emission lines is still limited.
For a BL Lac sample, the luminosity at any fixed waveband actually represent different portion of source SED because of the changing in sources. Therefore, the dependence between the source luminosity and synchrotron peak frequency might be necessarily checked at the synchrotron peak frequency, at which the most of jet radiation are emitted. Moreover, it is necessary to debeam the luminosity, which is Doppler boosted due to the relatively small viewing angles of jets. The strong positive correlation between the intrinsic peak luminosity and the intrinsic synchrotron peak frequency implies that the intrinsic source luminosity does depend on the location of the synchrotron peak, although with a large scatter. It seems that the higher peaked BL Lac objects are intrinsically more powerful than the low frequency peaked BL Lac objects in the present sample. Since , our results show that the power of jet emission increases with the magnetic field and electron Lorentz factor. This however is hard to be explained by the existing models that advocate that the SED of relativistic jets is strongly affected by the (external) radiation field (e.g. Ghisellini et al., 1998). It may be possible that the cooling process is not important in BL Lac objects. As a matter of fact, the cooling in BL Lac objects is expected to be smaller than that in Flat Spectrum Radio Quasars (FSRQs) which have strong broad emission lines. Alternatively, the efficient injection of the fresh high energy electrons can be maintained for certain long time, although the cooling process can not be ignored. In any cases, the theoretical models should be developed to explain our results. It may also be important if we could measure the magnetic field for individual sources.
We note that the strong-lined counterparts of HBLs, i.e. FSRQs with high have also been discovered in DXRBS by Padovani et al. (2003). Solely with DXRBS, they found no anti-correlation between synchrotron peak frequency and radio, BLR and jet powers, contrary to the predictions of the blazar sequence scenario. Due to the great similarities between FSRQs and BL Lacs, it might be crucial to revisit our results with a large and complete sample including both BL Lacs and FSRQs, which will help us understand the dependence between the source luminosity and synchrotron peak frequency, jet formation and physics.
5 Conclusions
By eliminating the beaming effect with the estimated Doppler factor from the radio data (Wu et al., 2007), we have calculated the intrinsic luminosity and the intrinsic synchrotron peak frequency for a sample of 170 BL Lac objects. Moreover, we estimated the black hole mass for our sample. The results can be summarized as follows:
1. After correcting the beaming effects, the radio and optical core luminosities follow with little scatter the same correlation found for FR I radio galaxies by Chiaberge et al. (1999), in support of the unification of BL Lac objects and FR I galaxies based on orientation.
2. We find a significant positive correlation between the intrinsic luminosity at synchrotron peak frequency and the intrinsic synchrotron peak frequency. The result implies that the jet emission is tightly related with the synchrotron peak frequency.
3. After correcting the beaming effect, we find a strong correlation between the black hole mass and the peak luminosity, and a mild correlation in the case of jet power. The results indicate that the more powerful jets may have heavier black holes.
Acknowledgements.
We thank the anonymous referee for insightful comments and constructive suggestions. We thank Xinwu Cao for helpful discussions and suggestions. This work is supported by the NSFC under grants 10373019, 10633010 and 10703009. The National Radio Astronomy Observatory is operated by Associated Universities, Inc., under cooperative agreement with the National Science Foundation. MERLIN is a National Facility operated by the University of Manchester at Jodrell Bank Observatory on behalf of PPARC. This research made use of the NASA/ IPAC Extragalactic Database (NED), which is operated by the Jet Propulsion Laboratory, California Institute of Technology, under contract with the National Aeronautics and Space Administration. This work also made use of Astrophysical Catalogues Support System (CATS) maintained by the Special Astrophysical Observatory, Russia.References
- RBSC-NVSS (2000) Bauer F.E., Condon J.J., Thuan T.X., Broderick J.J. 2000, ApJS, 129, 547
- Capetti et al. (2002) Capetti, A., Celotti, A., Chiaberge, M., et al. 2002, A&A, 383, 104
- Chiaberge et al. (1999) Chiaberge, M., Capetti, A., Celotti, A., et al. 1999, A&A, 349, 77
- Donato et al. (2001) Donato, D., Ghisellini, G., Tagliaferri, G., Fossati, G. 2001, A&A, 375, 739
- Lähteenmäki & Valtaoja (1999) Lähteenmäki, A. & Valtaoja, E. 1999, ApJ, 521, 493
- Falomo et al. (1994) Falomo, R., Scarpa, R., & Bersanelli, M. 1994, ApJS, 93, 125
- Fossati et al. (1998) Fossati, G., Maraschi, L., Celotti, A., Comastri, A., & Ghisellini, G. 1998, MNRAS, 299, 433
- Gabuzda et al. (2000) Gabuzda, D. C., Pushkarev, A. B., & Cawthorne, T. V. 2000, MNRAS, 319, 1109
- Ghisellini et al. (1999) Ghisellini, G. 1999, ApL&C, 39, 17
- Giommi et al. (1995) Giommi, P., Ansari, S. G., & Micol, A. 1995, A&AS, 109, 267
- Giommi et al. (2005) Giommi, P., Piranomonte, S., Perri, M., & Padovani, P. 2005, A&A, 434, 385
- Giovannini et al. (2001) Giovannini, G., Cotton, W. D., Feretti, L., Lara, L., & Venturi, T. 2001, ApJ, 552, 508
- Giroletti et al. (2006) Giroletti, M., Giovannini, G., Taylor, G. B., Falomo, R. 2006, ApJ, 646, 801
- Ghisellini et al. (1998) Ghisellini, G., Celotti, A., Fossati, G., Maraschi, L. & Comastri, A. 1998, MNRAS, 301, 451
- Jorstad et al. (2001) Jorstad, S. G., Marscher, A. P., Mattox, J. R., et al. 2001, ApJ, 556, 738
- Jorstad et al. (2005) Jorstad, S. G., Marscher, A. P., Lister, M. L., Stirling, A. M., Cawthorne, T. V., et al. 2005, ApJ, 130, 1418
- Laurent-Muehleisen et al. (1999) Laurent-Muehleisen, S. A., Kollgaard, R. I., Feigelson, E. D., Brinkmann, W., Siebert, J. 1999, ApJ, 525, 127
- Merloni et al. (2003) Merloni, A., Heinz, S., & di Matteo, T. 2003, MNRAS, 345, 1057
- Nieppola et al. (2006) Nieppola, E., Tornikoski, M., & Valtaoja, E. 2006, A&A, 445, 441
- Nieppola et al. (2008) Nieppola, E., Valtaoja, E., Tornikoski, M., Hovatta, T., Kotiranta, M. 2008, arXiv0803.0654N
- Nilsson et al. (2003) Nilsson, K., Pursimo, T., Heidt, J., Takalo, L. O., Sillanp, A., et al. 2003, A&A, 400, 95
- Nilsson et al. (2007) Nilsson, K., Pasanen, M., Takalo, L. O., Lindfors, E., Berdyugin, A. et al. 2007, arXiv:0709.2533
- O’Dowd & Urry (2005) O’Dowd, M., Urry, C. M., 2005, ApJ, 627, 970
- Padovani & Giommi (1995) Padovani, P., & Giommi, P. 1995, ApJ, 446, 547
- Padovani et al. (2003) Padovani, P., Perlman, E. S., Landt, H., Giommi, P., & Perri, M. 2003, ApJ, 588, 128
- Padovani (2007) Padovani, P. 2007, Ap&SS, 309, 63
- Punsly (2005) Punsly, B. 2005, ApJ, 623, L9
- Rector & Stocke (2000) Rector T. & Stocke J. T. 2003, AJ, 120, 1626
- Reich et al. (2000) Reich W., Fuerst E., Reich P., Kothes R., Brinkmann W., 2000, A&A, 363, 141
- Trussoni et al. (2003) Trussoni, E., Capetti, A., Celotti, A., Chiaberge, M., Feretti, L., 2003, A&A, 403, 889
- Turriziani et al. (2007) Turriziani, S., Cavazzuti, E., Giommi, P. 2007, arXiv: 0705.1498
- Urry et al. (2000) Urry, C. M., Scarpa, R., O Dowd, M., Falomo, R., Pesce, J. E., & Treves, A. 2000, ApJ, 532, 816
- Urry & Padovani (1995) Urry, C. M., & Padovani, P. 1995, PASP, 107 , 803
- Valtaoja et al. (1999) Valtaoja, E., Lhteenmki, A., Tersranta, H., Lainela, M., 1999, IAU Circ., 159, 1999
- Vermeulen & Cohen (1994) Vermeulen, R. C., & Cohen, M. H., 1994, ApJ, 430, 467
- Veron-Cetty & Veron (2000) Veron-Cetty, M. P. & Veron, P. 2000, ESOSR, 19, 1
- Wang et al. (2002) Wang, J.-M., Staubert, R., & Ho, L. C. 2002, ApJ, 579, 554
- Wu et al. (2007) Wu, Z. Z., Jiang, D., R., Gu, M. F., Liu, Y., 2007, A&A. 466, 63
| IAU name | Source | Log | Log | Log | Refs. | Log | |||
|---|---|---|---|---|---|---|---|---|---|
| (1) | (2) | (3) | (4) | (5) | (6) | (7) | (8) | (9) | (10) |
| 0006063 | NRAO 5 | 0.347 | 12.17 | 45.44 | 44.79 | 5.97 | … | … | … |
| 0007+472 | RX J0007.9+4711 | 0.280 | 14.75 | 44.62 | 43.37 | 2.71 | 19.01 | 1 | 7.93 |
| 0035+598 | 1ES 0033+595 | 0.086 | 17.01 | 44.58 | 41.87 | 2.33 | 17.56 | 2 | 7.25 |
| 0040+408 | 1ES 0037+405 | 0.271 | 18.17 | 44.99 | 42.79 | 1.92 | … | … | … |
| 0050094 | PKS 0048097 | 0.216 | 12.89 | 45.13 | 44.22 | 3.29 | … | … | … |
| 0110+418 | NPM1G +41.0022 | 0.096 | 15.23 | 44.05 | 42.70 | 1.06 | 15.28 | 1 | 8.51 |
| 0112+227 | S2 0109+22 | 0.473 | 12.92 | 46.23 | 44.17 | 8.50 | … | … | … |
| 0115+253 | RXS J0115.7+2519 | 0.350 | 13.47 | 44.80 | 43.59 | 2.59 | 17.91 | 1 | 8.76 |
| 0123+343 | 1ES 0120+340 | 0.272 | 17.99 | 45.51 | 42.72 | 2.93 | 17.41 | 3 | 8.69 |
| 0124+093 | MS 0122.1+0903 | 0.339 | 15.61 | 44.38 | 41.43 | 1.96 | 18.20 | 4 | 8.57 |
| 0136+391 | B3 0133+388 | 0.271 | 16.20 | 45.75 | 43.29 | 2.44 | … | … | … |
| 0141094 | PKS 013909 | 0.733 | 13.19 | 46.06 | 45.03 | 7.43 | 18.09 | 4 | 9.63 |
| 0148+140 | 1ES 0145+138 | 0.125 | 15.86 | 43.94 | 42.01 | 0.54 | 16.67 | 2 | 8.12 |
| 0153+712 | 8C 0149+710 | 0.022 | 14.72 | 44.03 | 41.86 | 1.29 | 11.68 | 1 | 8.65 |
| 0201+005 | MS 0158.5+0019 | 0.299 | 17.85 | 45.27 | 42.32 | 2.30 | 17.84 | 2 | 8.59 |
| 0208+353 | MS 0205.7+3509 | 0.318 | 15.18 | 44.73 | 41.76 | 2.75 | … | … | … |
| 0214+517 | 87GB 02109+5130 | 0.049 | 15.51 | 44.12 | 42.33 | 1.50 | 13.56 | 3 | 8.60 |
| 0222+430 | 3C 66A | 0.440 | 14.84 | 46.25 | 45.41 | 3.85 | … | … | … |
| 0232+202 | 1ES 0229+200 | 0.140 | 16.48 | 44.96 | 43.04 | 1.93 | 15.34 | 2 | 8.92 |
| 0238+166 | AO 0235+164 | 0.940 | 12.68 | 46.87 | 45.09 | 10.78 | 17.18 | 4 | 10.42 |
| 0301+346 | MS 0257.9+3429 | 0.245 | 13.29 | 44.78 | 42.34 | 1.90 | 17.18 | 2 | 8.68 |
| 0314+247 | RXS J0314.0+2445 | 0.054 | 13.36 | 44.47 | 41.25 | 0.97 | 15.65 | 1 | 7.67 |
| 0326+024 | 2E 0323+0214 | 0.147 | 15.87 | 44.72 | 42.01 | 2.07 | 16.59 | 1 | 8.36 |
| 0416+010 | 2E 0414+0057 | 0.287 | 16.42 | 45.57 | 43.98 | 2.13 | 16.83 | 2 | 9.05 |
| 0422+198 | MS 0419.3+1943 | 0.512 | 16.10 | 45.44 | 43.01 | 2.32 | 18.78 | 2 | 8.81 |
| 0424+006 | PKS 0422+004 | 0.310 | 14.88 | 45.71 | 44.15 | 6.24 | … | … | … |
| 0505+042 | RXS J0505.5+0416 | 0.027 | 15.62 | 42.76 | 41.89 | 1.20 | 17.81 | 1 | 5.81 |
| 0507+676 | 1ES 0502+675 | 0.314 | 18.04 | 45.94 | 42.05 | 5.62 | … | … | … |
| 0508+845 | S5 0454+84 | 0.112 | 12.83 | 44.07 | 41.62 | 10.76 | 21.99 | 2 | 5.33 |
| 0509040 | 4U 050603 | 0.304 | 18.39 | 45.39 | 43.42 | 1.93 | 17.76 | 2 | 8.66 |
| 0613+711 | MS 0607.9+7108 | 0.267 | 14.48 | 44.84 | 41.89 | 3.49 | 17.00 | 2 | 8.87 |
| 0625+446 | 87GB 06216+4441 | 0.473 | 13.36 | 45.69 | 44.53 | 5.46 | … | … | … |
| 0650+250 | 1ES 0647+250 | 0.203 | 15.51 | 45.57 | 42.71 | 3.24 | 18.61 | 2 | 7.73 |
| 0654+427 | B3 0651+428 | 0.126 | 14.98 | 44.51 | 42.93 | 2.38 | 15.59 | 1 | 8.67 |
| 0656+426 | NPM1G +42.0131 | 0.059 | 15.41 | 44.14 | 43.73 | 0.86 | 13.63 | 1 | 8.78 |
| 0710+591 | EXO 0706.1+5913 | 0.125 | 16.85 | 44.66 | 42.85 | 1.87 | 15.57 | 1 | 8.67 |
| 0721+713 | S5 0716+714 | 0.300 | 14.30 | 45.99 | 44.35 | 3.23 | 19.55 | 2 | 7.74 |
| 0738+177 | PKS 0735+17 | 0.424 | 12.82 | 46.38 | 43.28 | 29.41 | 19.75 | 2 | 8.08 |
| 0744+745 | MS 0737.9+7441 | 0.315 | 14.52 | 45.12 | 42.60 | 3.05 | 17.55 | 2 | 8.81 |
| 0753+538 | S4 0749+54 | 0.200 | 12.36 | 44.81 | 43.26 | 9.26 | 21.44 | 2 | 6.30 |
| 0757+099 | PKS 0754+100 | 0.266 | 13.00 | 45.74 | 43.11 | 17.72 | 18.31 | 2 | 8.21 |
| 0806+595 | SBS 0802+596 | 0.300 | 15.31 | 45.28 | 43.04 | 2.36 | 16.63 | 1 | 9.20 |
| 0809+523 | 1ES 0806+524 | 0.137 | 16.14 | 45.04 | 42.69 | 3.32 | 15.83 | 3 | 8.65 |
| 0818+423 | OJ 425 | 0.530 | 12.55 | 45.53 | 45.05 | 6.33 | 20.47 | 2 | 8.01 |
| 0823+223 | 4C 22.21 | 0.951 | 12.87 | 45.88 | 46.38 | 2.73 | 19.10 | 4 | 9.47 |
| 0825+031 | PKS 0823+033 | 0.506 | 11.84 | 45.94 | 43.08 | 29.42 | 19.28 | 2 | 8.55 |
| 0831+044 | PKS 0829+046 | 0.174 | 13.07 | 45.24 | 43.56 | 6.21 | 16.66 | 2 | 8.52 |
| 0831+087 | 1H 0827+089 | 0.941 | 14.00 | 45.35 | 44.95 | 4.04 | … | … | … |
| 0832+492 | OJ 448 | 0.548 | 12.38 | 45.46 | 43.84 | 8.39 | 19.26 | 2 | 8.66 |
| 0854+441 | US 1889 | 0.382 | 15.04 | 45.19 | 43.90 | 1.79 | … | … | … |
| 0854+201 | OJ 287 | 0.306 | 12.33 | 46.09 | 43.10 | 17.87 | 18.08 | 2 | 8.50 |
| 0915+295 | B2 0912+29 | 0.302 | 15.39 | 45.32 | 44.01 | 2.96 | … | … | … |
| 0916+526 | RXS J0916.8+5238 | 0.190 | 15.36 | 44.40 | 43.55 | 1.85 | 15.95 | 1 | 8.98 |
| 0929+502 | RXS J0929.2+5013 | 0.370 | 13.33 | 45.45 | 43.86 | 9.23 | … | … | … |
| 0930+498 | 1ES 0927+500 | 0.188 | 17.33 | 44.96 | 41.85 | 2.70 | 17.36 | 2 | 8.26 |
| 0930+350 | B2 0927+35 | 0.302 | 12.81 | 44.52 | 44.29 | 3.68 | … | … | … |
| 0952+656 | RGB J0952+656 | 0.302 | 14.96 | 44.83 | 43.24 | 1.99 | … | … | … |
| 0954+492 | MS 0950.9+4929 | 0.380 | 17.25 | 45.08 | 42.06 | 2.12 | … | … | … |
| 0958+655 | S4 0954+65 | 0.368 | 13.54 | 45.76 | 43.51 | 6.79 | 18.81 | 2 | 8.37 |
| IAU name | Source | Log | Log | Log | Refs. | Log | |||
|---|---|---|---|---|---|---|---|---|---|
| (1) | (2) | (3) | (4) | (5) | (6) | (7) | (8) | (9) | (10) |
| 1012+424 | RXS J1012.7+4229 | 0.364 | 18.24 | 45.55 | 43.69 | 1.92 | 17.61 | 1 | 8.96 |
| 1015+494 | GB 1011+496 | 0.200 | 16.27 | 45.14 | 43.61 | 2.59 | 16.15 | 3 | 8.94 |
| 1031+508 | 1ES 1028+511 | 0.360 | 16.71 | 45.79 | 43.10 | 3.39 | 18.10 | 3 | 8.70 |
| 1037+571 | RXS J1037.7+5711 | 0.302 | 14.40 | 45.37 | 43.71 | 3.70 | … | … | … |
| 1047+546 | 1ES 1044+549 | 0.473 | 12.83 | 45.46 | 42.96 | 2.05 | 19.31 | 2 | 8.44 |
| 1053+494 | MS 1050.7+4946 | 0.140 | 14.99 | 44.25 | 42.16 | 2.49 | 15.12 | 1 | 9.03 |
| 1104+382 | MRK 421 | 0.030 | 16.40 | 44.67 | 42.27 | 1.99 | 13.22 | 2 | 8.23 |
| 1109+241 | 1ES 1106+244 | 0.460 | 16.57 | 45.25 | 43.78 | 2.42 | 18.86 | 2 | 8.64 |
| 1120+422 | EXO 1118.0+4228 | 0.124 | 16.33 | 44.26 | 42.38 | 1.76 | … | … | … |
| 1136+701 | MRK 180 | 0.045 | 16.86 | 44.15 | 43.02 | 0.78 | 14.37 | 2 | 8.10 |
| 1136+676 | RXS J1136.5+6737 | 0.134 | 15.40 | 44.50 | 41.95 | 2.64 | 15.76 | 3 | 8.66 |
| 1149+246 | EXO 1449.9+2455 | 0.402 | 17.13 | 45.39 | 43.60 | 2.20 | 18.12 | 1 | 8.83 |
| 1150+242 | B2 1147+245 | 0.200 | 13.29 | 44.92 | 43.15 | 7.11 | 20.40 | 2 | 6.82 |
| 1151+589 | RXS J1151.4+5859 | 0.302 | 15.43 | 45.04 | 43.79 | 2.58 | … | … | … |
| 1209+413 | B3 1206+416 | 0.302 | 13.54 | 45.22 | 43.50 | 6.70 | … | … | … |
| 1215+075 | 1ES 1212+078 | 0.136 | 14.68 | 44.60 | 43.13 | 2.49 | 15.81 | 2 | 8.65 |
| 1217+301 | B2 1215+30 | 0.130 | 14.69 | 44.59 | 43.28 | 3.39 | 15.78 | 2 | 8.61 |
| 1220+345 | GB2 1217+348 | 0.643 | 13.63 | 45.84 | 44.42 | 5.80 | … | … | … |
| 1221+301 | PG 1218+304 | 0.182 | 17.16 | 45.36 | 42.65 | 2.60 | 16.86 | 2 | 8.47 |
| 1221+282 | ON 231 | 0.102 | 14.45 | 44.65 | 42.99 | 5.32 | 16.43 | 2 | 8.01 |
| 1223+806 | S5 1221+80 | 0.473 | 14.23 | 45.29 | 44.77 | 4.32 | … | … | … |
| 1224+246 | MS 1221.8+2452 | 0.218 | 13.43 | 44.73 | 42.11 | 2.96 | 18.32 | 2 | 7.96 |
| 1230+253 | RXS J1230.2+2517 | 0.135 | 14.11 | 44.76 | 43.08 | 3.60 | … | … | … |
| 1231+642 | MS 1229.2+6430 | 0.163 | 15.19 | 44.60 | 42.18 | 2.96 | 16.15 | 2 | 8.70 |
| 1237+629 | MS 1235.4+6315 | 0.297 | 15.07 | 44.70 | 42.24 | 3.02 | … | … | … |
| 1241+066 | 1ES 1239+069 | 0.150 | 18.68 | 44.49 | 41.33 | 2.45 | 22.08 | 2 | 5.63 |
| 1248+583 | PG 1246+586 | 0.847 | 14.17 | 46.80 | 44.70 | 11.10 | 19.43 | 2 | 9.15 |
| 1253+530 | S4 1250+53 | 0.302 | 14.64 | 44.92 | 44.26 | 3.52 | … | … | … |
| 1257+242 | 1ES 1255+244 | 0.141 | 16.70 | 44.86 | 42.29 | 1.30 | 16.53 | 2 | 8.33 |
| 1310+325 | AUCVn | 0.996 | 12.61 | 47.10 | 44.38 | 27.73 | 17.93 | 4 | 10.12 |
| 1322+081 | 1ES 1320+084N | 1.500 | 13.14 | 46.91 | 44.41 | 4.09 | 18.71 | 2 | 10.28 |
| 1341+399 | RXS J1341.0+3959 | 0.163 | 18.21 | 44.74 | 43.05 | 1.44 | 15.82 | 1 | 8.86 |
| 1402+159 | MC 1400+162 | 0.244 | 16.24 | 45.03 | 44.40 | 1.90 | … | … | … |
| 1404+040 | MS 1402.3+0416 | 0.344 | 15.36 | 45.42 | 43.62 | 1.64 | 18.87 | 2 | 8.26 |
| 1409+596 | MS 1407.9+5954 | 0.496 | 15.81 | 44.97 | 43.35 | 2.55 | 18.25 | 2 | 9.04 |
| 1415+485 | RGB J1415+485 | 0.496 | 14.16 | 45.05 | 43.50 | 4.06 | 19.30 | 1 | 8.51 |
| 1415+133 | PKS 1413+135 | 0.247 | 12.08 | 45.00 | 44.52 | 3.47 | … | … | … |
| 1417+257 | 2E 1415+2557 | 0.237 | 17.17 | 45.35 | 43.57 | 2.13 | 16.28 | 3 | 9.09 |
| 1419+543 | OQ 530 | 0.152 | 12.93 | 45.11 | 42.53 | 11.38 | 15.90 | 2 | 8.74 |
| 1427+238 | PKS 1424+240 | 0.160 | 15.22 | 45.10 | 43.55 | 2.66 | 20.67 | 2 | 6.42 |
| 1427+541 | RGB J1427+541 | 0.106 | 14.13 | 44.18 | 42.17 | 1.38 | 14.81 | 1 | 8.86 |
| 1428+426 | H 1426+428 | 0.129 | 18.19 | 45.06 | 42.22 | 1.56 | 15.97 | 2 | 8.51 |
| 1439+395 | PG 1437+398 | 0.344 | 16.07 | 45.32 | 43.83 | 1.87 | 17.48 | 2 | 8.95 |
| 1442+120 | 1ES 1440+122 | 0.163 | 15.81 | 44.74 | 43.10 | 2.06 | 16.45 | 2 | 8.55 |
| 1444+636 | MS 1443.5+6349 | 0.298 | 16.58 | 44.48 | 42.17 | 1.69 | … | … | … |
| 1448+361 | RXS J1448.0+3608 | 0.271 | 14.90 | 45.16 | 43.31 | 2.51 | … | … | … |
| 1458+373 | B3 1456+375 | 0.333 | 12.85 | 44.93 | 43.76 | 5.39 | … | … | … |
| 1501+226 | MS 1458.8+2249 | 0.235 | 14.46 | 44.97 | 42.59 | 4.59 | 17.40 | 2 | 8.52 |
| 1509+559 | SBS 1508+561 | 2.025 | 14.21 | 47.38 | 44.61 | 5.03 | … | … | … |
| 1516+293 | RXS J1516.7+2918 | 0.130 | 14.82 | 44.37 | 42.87 | 1.29 | 15.52 | 1 | 8.75 |
| 1517+654 | 1H 1515+660 | 0.702 | 17.04 | 46.63 | 43.50 | 3.32 | 18.51 | 2 | 9.36 |
| 1532+302 | RXS J1532.0+3016 | 0.064 | 15.01 | 44.10 | 42.17 | 1.66 | 14.86 | 1 | 8.26 |
| 1533+342 | RXS J1533.4+3416 | 0.810 | 15.42 | 45.97 | 43.55 | 4.86 | … | … | … |
| 1534+372 | RGB J1534+372 | 0.143 | 13.82 | 44.22 | 41.81 | 2.21 | 16.97 | 1 | 8.13 |
| 1535+533 | 1ES 1533+535 | 0.890 | 18.49 | 46.44 | 44.24 | 2.55 | 17.44 | 4 | 10.21 |
| 1536+016 | MS 1534.2+0148 | 0.312 | 17.19 | 44.85 | 43.39 | 1.89 | 17.62 | 2 | 8.76 |
| 1540+819 | 1ES 1544+820 | 0.271 | 15.63 | 45.12 | 43.21 | 2.30 | 19.14 | 2 | 7.82 |
| 1540+147 | 4C 14.6 | 0.605 | 13.54 | 45.83 | 45.43 | 6.34 | 18.76 | 1 | 9.04 |
| 1542+614 | RXS J1542.9+6129 | 0.302 | 13.90 | 45.25 | 43.06 | 4.42 | … | … | … |
| IAU name | Source | Log | Log | Log | Refs. | Log | |||
|---|---|---|---|---|---|---|---|---|---|
| (1) | (2) | (3) | (4) | (5) | (6) | (7) | (8) | (9) | (10) |
| 1554+201 | MS 1552.1+2020 | 0.222 | 15.81 | 44.99 | 42.94 | 2.06 | 16.44 | 1 | 8.93 |
| 1555+111 | PG 1553+11 | 0.360 | 15.42 | 46.38 | 44.10 | 5.07 | 20.99 | 2 | 7.25 |
| 1602+308 | RXS J1602.2+3050 | 0.302 | 15.34 | 44.64 | 43.64 | 1.85 | … | … | … |
| 1626+352 | RXS J1626.4+3513 | 0.497 | 15.24 | 45.08 | 43.67 | 2.53 | 17.89 | 1 | 9.22 |
| 1644+457 | RXS J1644.2+4546 | 0.225 | 15.44 | 44.63 | 43.52 | 1.95 | 16.74 | 1 | 8.79 |
| 1652+403 | RGB J1652+403 | 0.240 | 14.05 | 44.88 | 42.89 | 1.85 | … | … | … |
| 1653+397 | MRK 501 | 0.034 | 15.96 | 44.63 | 41.68 | 4.79 | 12.51 | 1 | 8.72 |
| 1704+716 | RXS J1704.8+7138 | 0.350 | 14.76 | 45.04 | 42.84 | 2.45 | 18.52 | 1 | 8.45 |
| 1719+177 | PKS 1717+177 | 0.137 | 12.22 | 44.22 | 43.05 | 5.03 | … | … | … |
| 1724+400 | B2 1722+40 | 1.049 | 14.44 | 46.38 | 45.66 | 4.72 | … | … | … |
| 1725+118 | H 1722+119 | 0.170 | 15.86 | 45.46 | 43.38 | 2.57 | 20.75 | 2 | 6.45 |
| 1728+502 | IZw187 | 0.055 | 16.05 | 44.02 | 42.03 | 1.91 | 15.36 | 2 | 7.84 |
| 1739+476 | OT 465 | 0.473 | 12.02 | 45.03 | 44.93 | 5.42 | 19.75 | 2 | 8.22 |
| 1742+597 | RGBJ 1742+597 | 0.400 | 13.85 | 45.24 | 43.51 | 3.73 | 18.67 | 1 | 8.55 |
| 1743+195 | NPM1G +19.0510 | 0.084 | 15.46 | 44.20 | 42.26 | 3.19 | 14.14 | 1 | 8.93 |
| 1745+398 | B3 1743+398B | 0.267 | 16.01 | 45.11 | 44.40 | 1.69 | 16.22 | 1 | 9.26 |
| 1747+469 | B3 1746+470 | 1.484 | 12.50 | 46.15 | 45.10 | 11.33 | … | … | … |
| 1748+700 | S4 1749+70 | 0.770 | 13.42 | 46.26 | 44.49 | 9.94 | 17.68 | 2 | 9.90 |
| 1749+433 | B3 1747+433 | 0.473 | 13.61 | 45.26 | 44.48 | 4.46 | … | … | … |
| 1750+470 | RXS J1750.0+4700 | 0.160 | 17.05 | 44.12 | 43.14 | 0.72 | 16.33 | 1 | 8.58 |
| 1751+096 | PKS 1749+096 | 0.322 | 11.81 | 45.83 | 42.78 | 37.09 | 17.93 | 2 | 8.64 |
| 1756+553 | RXS J1756.2+5522 | 0.271 | 16.47 | 44.97 | 42.50 | 1.84 | … | … | … |
| 1757+705 | MS 1757.7+7034 | 0.407 | 13.17 | 45.20 | 42.51 | 3.02 | 18.93 | 2 | 8.44 |
| 1800+784 | S5 1803+784 | 0.680 | 13.41 | 46.72 | 45.35 | 8.51 | 19.51 | 2 | 8.82 |
| 1806+698 | 3C 371 | 0.051 | 14.18 | 44.28 | 43.75 | 1.79 | 14.07 | 1 | 8.39 |
| 1808+468 | RGB J1808+468 | 0.450 | 14.29 | 45.14 | 43.63 | 2.80 | 19.22 | 1 | 8.42 |
| 1811+442 | RGB J1811+442 | 0.350 | 15.99 | 44.70 | 43.70 | 0.79 | 17.58 | 1 | 8.92 |
| 1813+317 | B2 1811+31 | 0.117 | 14.85 | 44.09 | 42.81 | 1.73 | 17.66 | 1 | 7.55 |
| 1824+568 | 4C 56.27 | 0.664 | 12.40 | 46.14 | 45.88 | 4.07 | 18.88 | 2 | 9.10 |
| 1829+540 | RXS J1829.4+5402 | 0.302 | 14.61 | 44.81 | 43.51 | 1.34 | … | … | … |
| 1838+480 | RXS J1838.7+4802 | 0.300 | 13.65 | 45.09 | 43.33 | 2.45 | 18.61 | 1 | 8.22 |
| 1841+591 | RGB J1841+591 | 0.530 | 14.34 | 44.93 | 43.46 | 1.44 | 18.08 | 1 | 9.21 |
| 1853+672 | 1ES 1853+671 | 0.212 | 13.07 | 44.19 | 41.67 | 3.00 | 17.83 | 2 | 8.18 |
| 1927+612 | S4 1926+61 | 0.473 | 12.70 | 45.67 | 44.43 | 7.66 | … | … | … |
| 1959+651 | 1ES 1959+650 | 0.047 | 15.87 | 44.54 | 40.89 | 5.20 | 14.40 | 2 | 8.14 |
| 2005+778 | S5 2007+77 | 0.342 | 12.80 | 45.46 | 44.00 | 7.70 | 18.16 | 2 | 8.60 |
| 2009+724 | S5 2010+72 | 0.473 | 12.79 | 45.23 | 44.80 | 7.45 | … | … | … |
| 2022+761 | S5 2023+76 | 0.473 | 14.49 | 45.77 | 44.43 | 5.39 | … | … | … |
| 2039+523 | 1ES 2037+521 | 0.053 | 14.78 | 44.31 | 40.15 | 3.55 | 13.65 | 2 | 8.65 |
| 2134018 | PKS 2131021 | 1.285 | 12.10 | 46.66 | 45.78 | 11.93 | 18.94 | 2 | 9.96 |
| 2145+073 | MS 2143.4+0704 | 0.237 | 13.56 | 44.67 | 42.99 | 2.53 | 17.42 | 2 | 8.52 |
| 2152+175 | PKS 2149+17 | 0.473 | 12.57 | 45.35 | 43.88 | 10.39 | 20.63 | 2 | 7.78 |
| 2202+422 | BL LAC | 0.070 | 13.58 | 45.05 | 42.08 | 14.47 | 14.42 | 2 | 8.58 |
| 2250+384 | B3 2247+381 | 0.119 | 15.05 | 44.64 | 42.51 | 2.03 | 15.51 | 1 | 8.64 |
| 2257+077 | PKS 2254+074 | 0.190 | 13.03 | 45.07 | 42.63 | 8.85 | 16.22 | 2 | 8.85 |
| 2319+161 | Q J2319+161 | 0.302 | 15.34 | 44.90 | 43.41 | 2.00 | … | … | … |
| 2322+346 | TEX 2320+343 | 0.098 | 15.18 | 44.30 | 42.41 | 1.23 | 14.88 | 1 | 8.73 |
| 2323+421 | 1ES 2321+419 | 0.059 | 14.21 | 43.76 | 41.39 | 1.70 | … | … | … |
| 2329+177 | 1ES 2326+174 | 0.213 | 16.57 | 44.89 | 42.92 | 2.04 | 17.17 | 2 | 8.51 |
| 2339+055 | MS 2336.5+0517 | 0.740 | 14.78 | 46.57 | 44.01 | 1.82 | … | … | … |
| 2347+517 | 1ES 2344+514 | 0.044 | 15.50 | 44.23 | 41.18 | 3.63 | 13.39 | 2 | 8.57 |
| 2350+196 | MS 2347.4+1924 | 0.515 | 15.88 | 45.15 | 43.07 | 1.81 | … | … | … |
Notes: Col. 1: the source IAU name (J2000). Col. 2: the source alias name. Col. 3: the redshift. Col. 4: the intrinsic synchrotron peak frequency. Col. 5 the observed peak luminosity in units of . Col. 6 the jet power in units of . Col. 7 the Doppler factor. Col. 8 the R magitude of host galaxies. ‘’ indicates the lower limit. Col. 9 the references of : 1, Nilsson et al. (2003). 2, Urry et al. (2000). 3, Nilsson et al. (2007). 4, O’Dowd & Urry (2005). Col. 10 the black hole mass in units of solar mass.