GMASS Ultradeep Spectroscopy of Galaxies at . III: The emergence of the color bimodality at
Abstract
Aims. The aim of this work is to study the evolution of the rest frame color distribution of galaxies with the redshift, in particular in the critical interval .
Methods. We combine ultradeep spectroscopy from the GMASS project (Galaxy Mass Assembly ultradeep Spectroscopic Survey) with GOODS multi-band photometry (from optical to mid-infrared) to study a sample of 1021 galaxies up to m(4.5m)=23.
Results. We find that the distribution of galaxies in the color vs stellar mass plane is bimodal up to at least redshift . We define a mass complete sample of galaxies residing on the red-sequence, selecting objects with , and we study their morphological and spectro-photometric properties. We show that the contribution to this sample of early-type galaxies, defined as galaxies with a spheroidal morphology and no star formation, decreases from 60-70% at 0.5 down to 50% at redshift . At we still find red galaxies in the mass complete sample, even if the bimodality is not seen any more. About 25% of these red galaxies at are passively evolving, with the bulk of their stars formed at redshift .
Key Words.:
Cosmology: observations – Galaxies: fundamental parameters – Galaxies: evolution – Galaxies: formation1 Introduction
Galaxies in the local universe show a bimodal color distribution (Strateva et al. 2001, Hogg et al. 2002, Blanton et al. 2003). Even if color bimodality has been observed and studied also at higher redshift (Bell et al. 2004, Weiner et al. 2005, up to ; Franzetti et al. 2006, Cirasuolo et al. 2007, up to ; Giallongo et al. 2005, up to ), no study until now has combined spectroscopic coverage and morphological analysis at . The color bimodality suggests a different mechanism of evolution for galaxies lying on the two sequences (Menci et al. 2005; Scarlata et al. 2007; De Lucia et al. 2007): hence, it is extremely interesting to evaluate the epoch when the color bimodality was built up.
Many authors in the literature use red sequence galaxies to constrain the evolution of the early-type population (Bell et al. 2004a; Faber et al. 2007). Although the red peak is known to be dominated by early-type galaxies with old passive stellar populations, a contamination of star forming galaxies with colors reddened by dust, or by early-type spirals is also present (Bell et al. 2004b; Cassata et al. 2007; Franzetti et al. 2007; Scarlata et al. 2007). Here we use data about spectral properties, spectral energy distributions (SED), morphologies and mid-IR emission that we collected for the GMASS sample to explore the content of the red sequence as a function of the redshift. Throughout the paper, magnitudes are in the AB system, and we adopt =70 km s-1 Mpc-1, =0.3 and =0.7.
2 The sample
GMASS (“Galaxy Mass Assembly ultra-deep Spectroscopic Survey”) is a project based on an ESO VLT Large Program. For an exhaustive description of the survey see Kurk et al. (2008a, in preparation), Cimatti et al. (2008) and Halliday et al. (2008).
The sample is extracted in the m public image obtained with Spitzer Space Telescope + IRAC down to a limiting magnitude of 23.0, and contains 1021 galaxies in a field of 6.8’x6.8’. The selection at m is more sensitive to stellar mass and less affected by dust extinction than optical bands. Moreover this selection produces a “negative” k-correction at , as the peak of the stellar spectral energy distribution enters the m band at this redshift.
With the aim of studying the redshift range , the epoch when the crucial processes of massive galaxy formation took place, ultra deep spectroscopy was carried out using FORS2 on galaxies pre-selected with a cut in photometric redshift of 1.4. The spectroscopic coverage was complemented with available literature redshifts, reaching a completeness of about 50%. For the rest of the population, accurate photometric redshifts are available (Kurk et al. 2008a). The median of the galaxy redshift distribution is , with 190 objects with spectroscopic redshift , mostly coming from GMASS spectroscopy. There are several spikes in the redshift distribution, the most dominant being at , discussed in a parallel paper (Kurk et al. 2008b).
The photometric SEDs were derived for all the galaxies in the sample using the public images available in the GOODS-South area in 11 bands: optical (ACS-HST, , Giavalisco et al. 2004), near-infrared (ESO VLT+ISAAC, ) and mid-infrared (Spitzer+IRAC, 3.6m, 4.5m, 5.6m and 8m). We used the synthetic spectra of Maraston (2005; M05) to fit these SEDs, adopting a Kroupa IMF, limiting the fit to m. We use exponentially declining star formation histories, with timescales spanning from 0.1 to 30 Gyr, plus the case of constant star formation rate. Models with ages between 0.1 Gyr and the age of the Universe at the redshift of each galaxy are retained in the best-fit procedure. Extinction is a free parameter in the optimization, using the extinction curve of Calzetti et al. (2000). The fitting procedure minimizes the , and the best fit model gives an estimate for the age, the folding time of the SFR , the extinction and the stellar mass. At the same time, absolute magnitudes in Johnson bands are derived. The dataset is complemented with the Spitzer-MIPS data publicy available for the GOODS-South/GMASS region, to check for possible activity signs in the 24m data.
The high resolution imaging provided by ACS-HST allowed an accurate visual classification of all the galaxies in the sample. The analysis has been performed independently by two of us (PC and GR) on the ACS band closest to the rest-frame band. The classification scheme is based on 4 classes: 1. spheroidal galaxies (ellipticals, S0 and compact objects); 2. spirals; 3. irregular galaxies; 4. undetected in the optical bands (and thus not classifiable). On the basis of this analysis, we classified 198 spheroidal galaxies, 496 spirals and 269 irregulars, while 58 objects are undetected in the optical bands.
At redshift , where the ACS -band maps the blue UV light in the rest-frame, surface brightness dimming and morphological k-correction effects may be important. However, the separation between early- and late-types should remain robust, as –though fainter in the UV– ellipticals remain symmetrical. Spirals instead can appear more late type, as red bulges get fainter, the surface brightness of disks dimms, but knots of star formation brighten in the UV.
3 Color bimodality
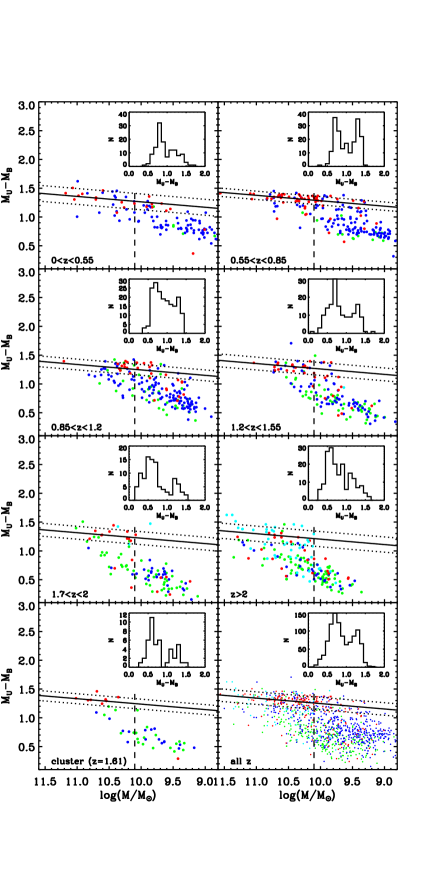
Precise redshift measurements are extremely important to reduce uncertanties in the SED fitting procedure, to derive robust absolute magnitudes, stellar masses, and other SED parameters. The GMASS spectroscopic coverage in the range allows on one hand a proper calibration of the photometric redshifts, and, on the other hand, provides us with high-quality fits of the spectral energy distribution for each galaxy. The optimal measure of the rest-frame magnitudes allows us to check for the bimodality in colors in a redshift interval that has not been much explored until now. In Figure 1 we report the rest-frame color versus stellar mass for different redshift bins, as well as for the global population. Each redshift bin contains roughly the same number of objects. In each panel a small inset shows the color distribution at that redshift. The forming cluster at is excluded from the bins at , but we dedicated a separate panel to it. The quality of our sample allows us to claim that the color distribution, looking at both the histograms and the vs plane, is bimodal at least up to , as well as for the global population. We note that galaxies show also a sort of bimodality in mass, with red galaxies being more massive of the blue ones. This is partly due to a selection effect: at a given redshift, the completeness limit is higher for red than blue galaxies. Conversely, on the other side of the diagram, the lack of massive blue galaxies is a real effect.
To characterize and define the red sequence, first we select objects redder than the valley in the global color distribution, namely (U-B)=1.1. Then, we fit the global color-mass distribution of these galaxies with a straight line (U-B)=+(log(M/M, obtaining for the slope a value =0.0943. Finally, we use this slope to fit the red sequence in each redshift bin, leaving only the intercept as a free parameter. The result of this procedure is overplotted on the data in Fig. 1. Interestingly, the intercept does not evolve significantly with redshift: we measure a =-0.2 between 0.5 and 2.5. This is consistent with the evolution expected for a galaxy formed in a instantaneous burst at redshift .
In Figure 1 we color coded galaxies of different morphologies. We find that 70% of the spheroidal galaxies reside on the red sequence. The remaining 30% show blue colors. On average, red spheroidal galaxies are more massive than blue ones (the median of the mass distribution is and respectively for red and blue). On the other hand, 77% of late type galaxies have blue colors, with the remaining 23% lying on the red sequence. At redshifts many objects have colors z-K, being very faint or undetected up to the ACS band. For these no morphological analysis could be made.
4 Red sequence composition
In general, galaxies can have a red color because they have old stellar populations, or because their star-formation activity is obscured by dust that reddens their colors. Hence, the red sequence is well known to be a mix of galaxies with different properties (Bell et al. 2004b; Cassata et al. 2007; Scarlata et al. 2007; Franzetti et al. 2007). Here we have the opportunity to explore the morphological, photometric and spectroscopic properties of red galaxies up to redshift .
To separate the blue and red population in each redshift bin, we use the best fit to the red sequence and add an offset of magnitudes to end up on the valley between red and blue galaxies. This offset is comparable to the scatter of the objects around the fit to the red sequence. To allow a comparison between galaxies at different redshifts, we define a mass complete sample, selecting only galaxies on the red-sequence having log10.1. This is roughly the smallest mass for red galaxies at redshift in our sample. With this criterion, we select a sample of 197 galaxies. The aim of this section is to study the properties of these galaxies, by combining morphological information and SED analysis, including also m data.
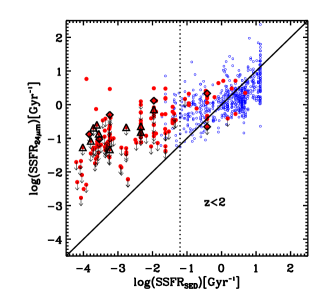
In Figure 2 we study the star formation properties of galaxies in this sample, comparing the Specific Star Formation Rates (the star formation rate for unit mass, SSFR) estimates coming from SED fitting and from 24m photometry. We plot only galaxies up to , because beyond this limit the data show to much scatter. We report also blue galaxies for comparison. The total infrared luminosity (8-1000 m) was computed by rescaling various star forming templates to the 24m flux of each source (see Daddi et al. 2007 for details). Then, this total luminosity was converted into a Star Formation Rate using the relation given by Kennicutt (1998). We use 25Jy as a conservative detection limit for 24m sources in GOODS (corresponding roughly to ), reporting as upper limits the values of the SSFR below this limit.
The agreement between the two SSFR estimates up to is quite good, in particular for blue galaxies, even if a large scatter is present. The two measurements still correlate for red massive galaxies, considering also that the m SSFR provides an upper limit for the bulk of them. The large majority of the mass complete red sample has (SSFR and no reliable detection at 24m. The quite good correlation between the two SSFR and the agreement with spectroscopic properties ensure that this diagram can be used to identify galaxies which have very low levels of SSFR and are likely to be the ones with the lowest or no star formation. In particular, we define passive those galaxies having (SSFR: at this rate, a galaxy would take about 15 Gyr to double its mass. To be more conservative, we excluded galaxies having a reddening 1 and those with (SSFR and Jy (that are reliable m sources). We checked the position on the diagram of the 16 galaxies in the mass complete sample having passive GMASS spectra (see Cimatti et al. 2008 for the 13 at ): 14 of them occupy the “passive” region of the diagram, while 2, that also show some emission lines in their spectra, are in the “active” region.
At the scatter about the relation becomes significant and we therefore decided not to plot galaxies with on Fig. 2; this scatter is probably due to increased uncertanties on the 24m luminosity and/or to an increasing number of dusty star forming objects. In this range we decided to use the same limits to define passive galaxies, which exclude objects with large 24m luminosities. Finally, among the 197 galaxies belonging to the mass complete sample, 103 () could be considered passive according to these criteria.
It is interesting to combine the results of the morphological classification with those of the analysis of the star formation activity, for our mass complete sample of galaxies on the red sequence. We find that all the objects classified as spheroidals are actually passive galaxies. This means that at we do not find, at any redshift, red sequence massive ellipticals with a secondary episode of star formation. On the other hand, not all the galaxies that are passive according to the criteria mentioned above are morphologically spheroidals. In fact, about 20% of the 103 passive galaxies on the red sequence are morphologically late-types. The large majority of them are spirals dominated by a bright bulge.
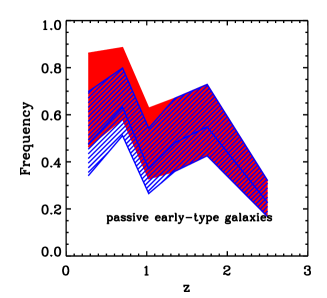
We summarize these results in Fig. 3, where we show the contribution to the massive part of the red sequence () of galaxies that show little or no signs of star formation ((SSFR & &(SSFR) and have an early-type morphology. Since at we do not have a morphological classification for all the galaxies, at that redshift we combine SED and 24m information to define galaxies with low SSFR. In the literature, authors either include or exclude bulge dominated spirals as a part of the early-type family, we therefore show here both cases. It can be noted that the trend of the two cases is similar, with the contribution of passive early-type galaxies mildly (or not at all) decreasing with the redshift from 0 to . The fluctuations in the frequency could be due to cosmic variance: i.e, the lack of massive galaxies on the red sequence in the bin around 1 may imply that our survey samples an underdense region of the Universe at that redshift (see the photometric redshift histogram in Kurk et al. 2008a). The results at redshift are in good agreement with previous results: Franzetti et al. (2007) find an increasing contribution of star forming galaxies in the red sequence between 0 and . Moreover, Scarlata et al. (2007) found that the fraction of morphologically early-type galaxies (including bulge dominated spirals) in a sample of photometrically selected ETGs decreases from 60% at to % at . Renzini (2006) reported that at z 58% of the red galaxies are morphologically early-type, similar to our findings. At z Bell et al. (2004b) and Cassata et al. (2007) find respectively 75% and 66% of early-types contributing to the red sequence: these results can be easily conciliated with ours considering that the former include Sa galaxies, while the latter consider pure ellipticals/S0.
Here we reach higher redshift. We show that even at the color distribution is bimodal, with the massive part of the red sequence dominated by passive spheroidal galaxies (Fig. 1&3). Even though at bimodality in the color distribution is no longer evident, many galaxies do show red colors and masses above . We find that of them have low or no signs of star formation (compared to 60% at ), having (SSFR & (SSFR & . Half of these red and massive galaxies have a spheroidal morphology, even if the remaining half can not be morphologically classified, because they are barely detected or undetected in the ACS band. Nevertheless, all of them have colors compatible with being passive (Daddi et al. 2004). Combining their ages (greater than 0.5 Gyr) to their redshift, we can conclude that this population of massive galaxies must have formed the bulk of their stars during a burst at redshift . It is plausible to argue that the bimodality at vanishes as a result of the decreasing number of passive red galaxies and of the consequent increase of dusty star forming objects.
Finally, we emphasize that, even at and more significantly at , the fraction of massive late-type galaxies lying on the sequence is significant, and evolves with redshift. Thus, it could be misleading to identify red-sequence with passive old galaxies. This must be taken into account when red sequence galaxies are used to constrain the evolution of the luminosity and mass function for the passive early-type population, as in Bell et al. (2004a), Scarlata et al. (2007) and Faber et al. (2007).
5 Conclusions
We study the rest-frame color distribution for a sample of 1021 galaxies selected at m. We took advantage of the ACS/HST high resolution imaging and multiwavelength coverage spanning from ACS bands to Spitzer IRAC mid-infrared and 24m to characterize morphologies, colors and SED properties of galaxies in the sample.
-
1.
We find that the classical color bimodality is preserved up to at least . This can be seen both looking at the galaxies in the (U-B) vs Mass plane, and at the distribution. The presence in the sample of a forming cluster at does not enhance the bimodality at .
-
2.
The massive part of red sequence () is a mix of early- and late-type galaxies at all redshifts. The contribution of early-type galaxies to the red sequence is about 60-70% at and about 50% at , depending on the inclusion or exclusion of bulge dominated passive spirals in the early-type class.
-
3.
Even if the color bimodality vanishes at redshift , still there are red galaxies with . About 25% of these are passively evolving, with ages 0.5 Gyr. This implies that we find a rich population of massive galaxies with redshift of formation .
References
- (1) Bell, E. F., et al., 2004a, ApJ, 608, 752
- (2) Bell, E. F., et al., 2004b, ApJ, 600, L11
- (3) Calzetti, D., et al., 2000, ApJ, 533, 682
- (4) Cassata, P., et al., 2007, ApJS, 172, 270
- (5) Cimatti, A., et al., 2008, A&A in press, [astro-ph/08011184]
- (6) Cirasuolo, M., et al., 2007, MNRAS, 380, 585
- (7) Daddi, E., et al., 2004, ApJ, 617, 746
- (8) Daddi, E., et al., 2007, ApJ, 670, 156
- (9) De Lucia, G., et al., 2007, MNRAS, 374, 809
- (10) Faber, S., et al., 2007, MNRAS, 665, 265
- (11) Franzetti, P., et al., 2007, A&A, 465, 711
- (12) Giavalisco, M., et al., 2004, ApJ, 600, L93
- (13) Giallongo, E., et al., 2005, ApJ, 622, 116
- (14) Halliday, C., et al., 2008, A&A, 479, 417
- (15) Kennicutt, R. C. Jr., 1998, ARA&A, 36, 189
- (16) Kurk, J., et al., 2008a, A&A, in preparation
- (17) Kurk, J., et al., 2008b, A&A, in preparation
- (18) Maraston, C., et al., 2005, MNRAS, 362, 799
- (19) Menci, N., et al., 2007, ApJ, 632, 49
- (20) Renzini, A., 2006, ARA&A, 44, 141
- (21) Scarlata, C., et al., 2007, ApJS, 172, 494
- (22) Strateva, I., et al., 2001, AJ, 122, 1861
- (23) Weiner, B. J., et al., 2005, ApJ, 620, 595