Galactic HI on the 50-AU scale in the direction of three extra-galactic sources observed with MERLIN
Abstract
We present MERLIN observations of Galactic 21-cm H i absorption at an angular resolution of arcsec and a velocity resolution of 0.5 km s-1, in the direction of three moderately low latitude (–8° –12°) extragalactic radio sources, 3C 111, 3C 123 and 3C 161, all of which are heavily reddened. H i absorption is observed against resolved background emission sources up to arcsec in extent and we distinguish details of the opacity distribution within 1–1.5 arcsec regions towards 3C 123 and 3C 161. This study is the second MERLIN investigation of small scale structure in interstellar H i (earlier work probed Galactic H i in the directions of the compact sources 3C 138 and 3C 147). The 0.1-arcsec scale is intermediate between H i absorption studies made with other fixed element interferometers with resolution of 1 to 10 arcsec and VLBI studies with resolutions of 10–20 milli-arcsec. At a scale of 1 arcsec (about 500 AU), prominent changes in Galactic H i opacity in excess of 1–1.5 are determined in the direction of 3C 161 with a signal-to-noise ratio of at least 10. Possible fluctuations in the H i opacity at the level of about 1 are detected at the level in the direction of 3C 123.
keywords:
radio lines: ISM – radio continuum: galaxies – ISM: kinematics and dynamics – ISM: structure – Galaxy: kinematics and dynamics1 Introduction
In order to understand the dynamics of the interstellar medium (ISM), a thorough understanding of the physical conditions of the ISM gas is required over a large range of physical scales. In particular, the magnitude of changes in density of the neutral atomic component (H i) over a wide range of physical scales from tens of AU to parsecs plays a major role in determining the evolution of the dense component of the ISM. A recent conference in Socorro, New Mexico (USA) in May 2006 was devoted to this broad topic of small scale structures in various ionized and neutral (atomic and molecular) phases of the ISM (the SINS conference: ‘Small Scale Ionized and Neutral Structures’; 2007). A major topic of discussion at this conference was the nature of H i structures with scales from tens to thousands of AU. To date, most of the effort in studying the small scale structure in H i has consisted of VLBI and pulsar determinations at the 10 to 100 AU scale (Faison et al. 1998; Faison & Goss 2001; Brogan et al. 2005; Brogan et al. 2007; Weisberg & Stanimirović 2007; Stanimirović et al. 2003).
A major gap between the 100-AU and 0.1-pc ( AU) scales has remained largely unexplored; Davis et al. (1996) used the MERLIN array and the European VLBI Network (EVN) to observed Galactic H i absorption towards the extragalactic sources 3C 138 (Galactic coordinates = 187.4° and = –11.3°) and 3C 147 (Galactic coordinates = 161.7° and = 10.3°) over angular scales of 50 to 1000 milli-arcsec (mas). Prominent changes in H i opacity at the level of 0.15 were observed in the MERLIN 0.1-arcsec resolution data and at the level of 0.5 in the 50-mas EVN data. The changes were observed over linear scales of AU arising from nearby H i gas ( 500 pc).
A number of discussions of the observational characteristics of the small scale neutral gas in addition to H i were presented at the SINS conference (Lauroesch, 2007). Andrews et al. (2001) have reviewed the nature of both spatial and temporal variations in optical IS lines, while Jenkins & Tripp (2007) have reviewed C i UV observations suggesting overpressure in some portions of the ISM. If the observations of opacity variations are interpreted in terms of density fluctuations, a major problem of excess density and pressure is implied. To overcome this problem Heiles (1997) (see also Heiles 2007 and Heiles & Stinebring 2007) has suggested several geometrical explanations that would reduce the overpressure; examples include sheet or filament morphologies. (2000) (also see 2007) has, on the other hand, proposed that the structures on small scales of tens of AU are only a natural extension of irregularities in the distribution of H i scales at much larger dimensions, based on a power law (‘red spectrum’) derived by Deshpande et al. (2000) using VLA data in the direction of the Galactic source Cas A. This derivation consisted of a power law over scales of several parsec to less than 0.1 pc. The pros and cons of these contrasting proposals are discussed by Heiles & Stinebring (2007).
In order to fill in the gap between the 0.1-pc and 10-AU scales, additional observations of the 100-AU scale are required. The MERLIN array at 21 cm is the ideal instrument for this endeavour; we undertook H i absorption observations in the direction of strong extragalactic sources with total angular sizes of order 1 arcsec. Three sources with Galactic latitudes in the range –8° to –12° were observed in 2001 and 2003. These observations represent the second instalment of Galactic H i studies following Davis et al. (1996).
The choice of sources was guided by the pioneering (and under-recognized) ground-breaking Galactic H i absorption studies by Liszt et al. (1982) and (1986). Observations were made in the early 1980s, using the newly completed VLA with an angular resolution of 3–4 arcsec and a velocity resolution of 1.3–1.6 km s-1, in the directions of 3C 111, 3C 123, 3C 161 and 3C 348. The new MERLIN observations were made with an angular resolution of arcsec and a velocity resolution of 0.49 km s-1, in the direction of all of these sources except for 3C 348. Preliminary MERLIN results were presented by Faison et al. (2007).
We outline the data acquisition process in Section 2 and describe and interpret the H i absorption towards each source in Section 3. The results and implications for the structure and kinematics of Galactic H i are summarised in Section 4 and we add an Appendix A on hitherto unpublished data for 3C 161.
2 Observations and Data Reduction
The observations were carried out in a two-stage process. The structure of our targets had never been investigated previously at 0.1-arcsec resolution (with the exception of the 3C123 hotspots at 5 GHz, Hardcastle et al. 1997) so we started by observing the radio continuum from each source, at a wavelength of either 6 or 21 cm, in order to determine the size of the field required for the final H i line and continuum images. The continuum observations were made using the MERLIN array including the antennas at Defford, Cambridge, Knockin, Darnhall, Tabley, and the MK2 telescope at Jodrell Bank, giving a usable bandwidth of 13–15 MHz. The observing parameters are given in in Table 1. Standard observing and data reduction procedures were used, see the MERLIN User Guide (Diamond et al., 2003). The resulting continuum images are in good agreement with the somewhat lower-sensitivity images made during the H i observations (see below). The continuum emission from 3C161 is discussed further in Appendix A.
The observing parameters for the H i observations are given in Table 1. The antennas listed above were used with the addition of the Lovell Telescope. Observations of the spectral targets were interleaved with observations of nearby compact phase reference sources listed in Table 1. We used a 0.5-MHz bandwidth divided into 256 channels for the H i targets and the bandpass calibration source, giving a velocity channel separation of 0.41 km s-1. The target data were recorded adjusted to a fixed velocity with respect to the local standard of rest (), given in Table 1. Other calibration sources were observed using the standard wide-band continuum configuration for maximum sensitivity. The absolute flux density scale for all sources was derived from 3C 286. We used 3C 84 to calibrate the bandpass, after eliminating its weak Galactic absorption. We applied these solutions and the phase and amplitude calibrations derived from the phase reference sources to the relevant targets. More details of MERLIN spectral line data reduction are given in Diamond et al. (2003).
After calibration, we inspected the spectrum of each target and identified the line-free channels. These were subtracted from the spectra to enable us to make H i absorption line cubes and we also imaged the continuum. The final optical depth cubes were calculated from the continuum image and the line cube. We used cutoffs of a few per cent of the peak continuum intensities (see Table 1 and captions to the relevant figures). All positions are given in J 2000 (ICRS). We can only measure H i absorption on the same scale as the continuum structures, since H i emission is undetectable on the (sub-)arcsec MERLIN scales. The maximum scale of emission which can be imaged reliably from our observations is 2–3 arcsec at 1.4 GHz and 0.7–1 arcsec at 5 GHz. Detectable emission on slightly larger scales would cause a distinctive ’bowl’ artefact due to missing flux density on most baselines. No signs of this are detected in any of the MERLIN images, implying that there is minimal missing flux density on the scales from 0.1 to 3 arcsec imaged here. In addition we compare the current MERLIN results with existing VLA data to confirm the minimal effect of missing short spacings. Detailed comments are presented for each source.
3 Results
3.1 3C 111
The large low latitude source 3C 111 ( = 16168, = –882) has a complex continuum structure. This FR (Fanaroff-Riley) II source is a nearby broad line radio galaxy at a redshift of 0.049. VLA continuum studies were carried out by Lindfield & Perley (1984); (1986) have also summarized VLA H i observations of this source, identifying a core continuum component (their ‘2’ ) and two prominent lobes with hotspots, NE (their ‘1’, displacement 2 arcmin) and SW (their ‘3’ and ‘4’, displaced by 80 arcsec). Using the MERLIN array, the NE component is detected with an extent of arcsec and a continuum peak of only 46 mJy beam-1 (not listed in Table 1); the mean H i spectrum was obtained after smoothing to a 0.3-arcsec resolution. The core of the galaxy has a peak of 1.27 Jy beam-1. The two H i spectra for components 1 and 2 are superimposed in Fig. 1.
The SW component is heavily resolved by MERLIN; the emission detected over arcsec has a peak of only 8 mJy beam-1. At this level, detection of H i absorption is not possible even after some smoothing. We also note that the highest apparent H i opacities for the NE component (at –5 and 0 km s-1) are unreliable with uncertainties in excess of 1, due to the partial saturation of the H i line and the weakness of the resolved continuum feature. The faintness of the lobes of 3C111 implies that it is impossible to determine detailed H i opacity images. The spectra obtained for the core source and for the average of the NE lobe using MERLIN are in excellent agreement with earlier VLA data obtained with a resolution of 3.5 arc sec obtained by (1986). We confirm the increase in the H i opacity for the –19 km s-1 feature, from H i 0.35 towards the core (component 2), compared with H i 0.1 towards the NE hotspot (component 1). A relatively higher opacity of H i is observed towards the NE hotspot at –11 km s-1, compared with H i towards the core.
Moore & Marscher (1995) made observations towards 3C 111 using the VLA at 16–14-arcsec resolution at the respective H i and OH line frequencies of 1.4 and 1.6 GHz as well as multi-epoch observations of H2CO at 4.8 GHz in various configurations. Their images are also consistent with the H i results from (1986), containing substantial absorption line variations in H i and OH which suggest with structure on scales of 0.14 to 0.34 pc at their adopted distance of 350 pc. The time variability in H2CO absorption observed towards the core by Moore & Marscher (1995) and Marscher, Moore & Bania (1993) over a 3.4 yr period provides additional evidence for 10-AU concentrations with number densities cm-3. These apparent fluctuations could arise from a combination of the elliptical apparent motion due to parallax, linear solar motion and the proper motion of the cloud (Moore & Marscher, 1995), giving a transverse drift of about 4 AU per year (at the adopted distance of 350 pc) of the position of the line of sight through each cloud towards the background source.
3.2 3C 123
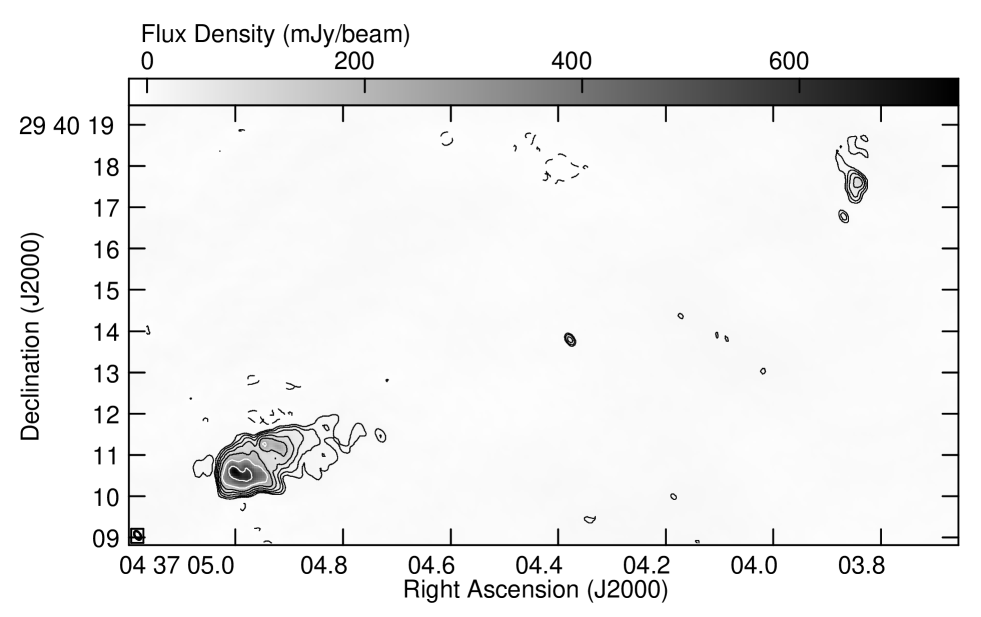
The continuum image of 3C 123 ( = 17058, = –1166) is shown in Fig. 2. Previous high-resolution VLA images of this FR II radio galaxy have been presented by Cox et al. (1991) (images made by R. Laing at 1.7, 4.9 and 14.9 GHz) and by Hardcastle et al. (1997). 3C 123 has been identified with a 19 mag galaxy with strong Galactic reddening at a redshift of 0.22. Hardcastle et al. (1997) show a 5 GHz MERLIN image (beam 0.05 arcsec); both components shown in Fig. 2 (the E and W hotspots) have been imaged by these authors. The weak core ( mJy) is also detected in the current image at right ascension , declination (J2000). The MERLIN continuum image of 3C123 contains all the flux density that was detected by the VLA at 1.4 GHz with 1.2 arcsec resolution (R. Laing in Atlas of DRAGNS http://www.jb.man.ac.uk/atlas/). The total flux density of 13.5 Jy above in the MERLIN image of the E hotspot (Fig. 2) in an area of about 10 arcsec2 is in good agreement with the VLA image over the same region. The central core radio source is unresolved by MERLIN and has a flux density of 48 mJy, compared to 51 mJy in the VLA image.
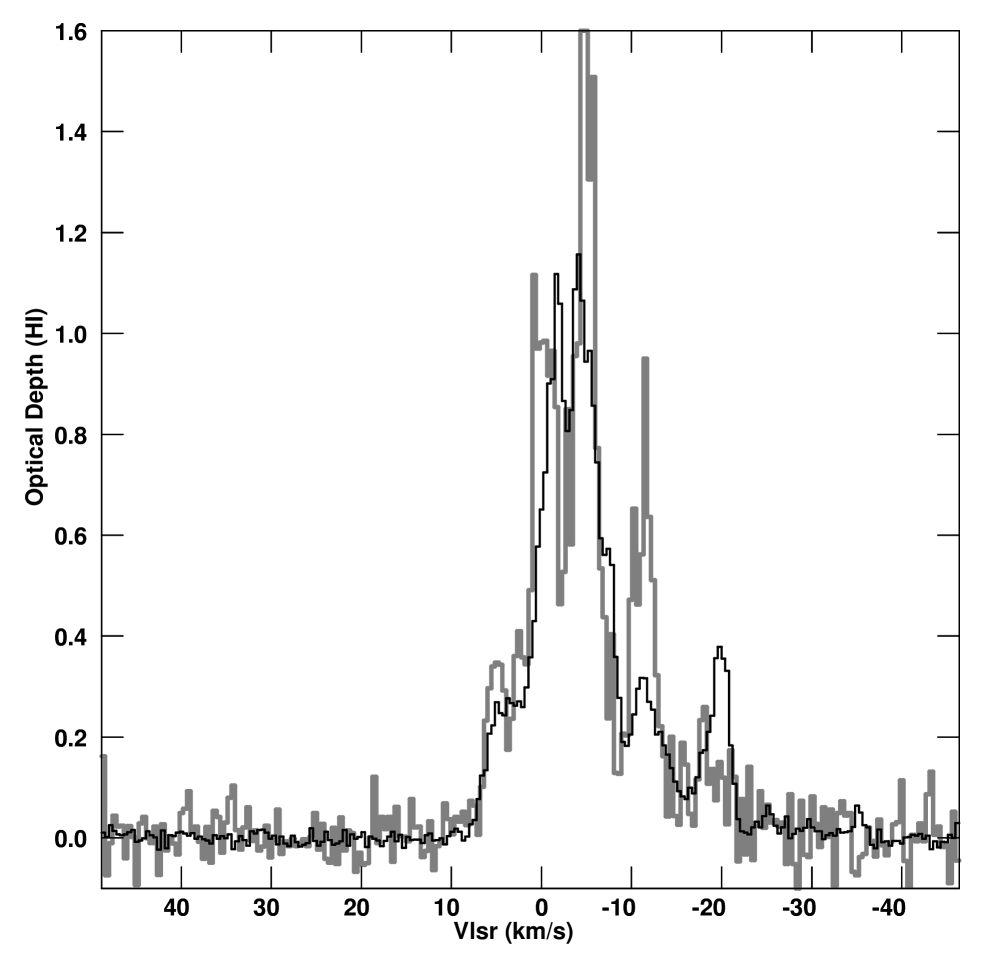
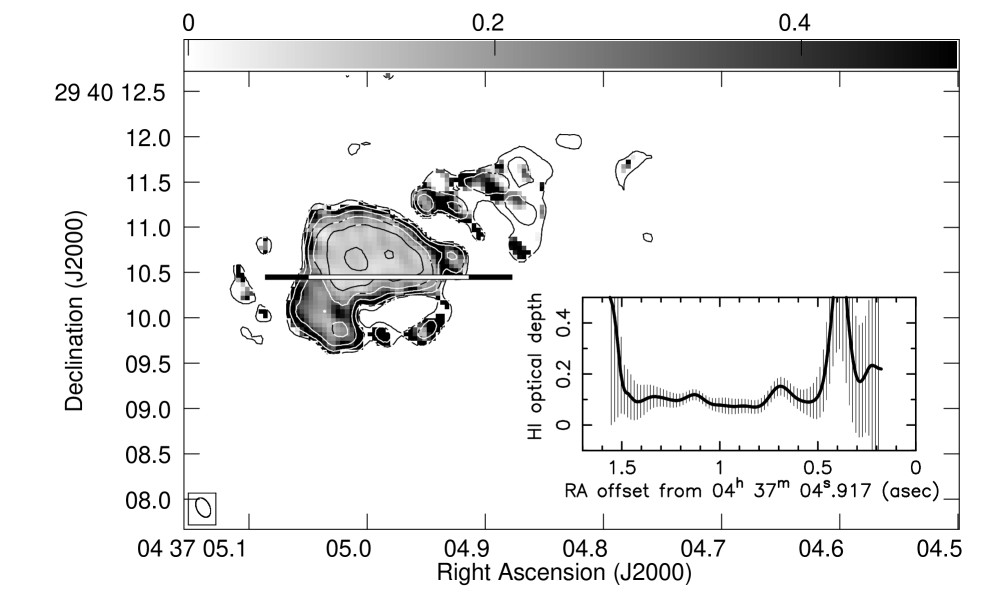
The mean H i optical depth spectrum toward the SE hotspot (over an area of 025 025) is shown in Figure 3. This spectrum is similar to the results of Liszt et al. (1982). Their anomalous velocity feature at –73 km s-1 is outside the velocity range (50 km s-1) of the current observations. The narrow line at –20.1 km s-1 (FWHM km s-1) and the +4.2 km s-1 feature (FWHM km s-1) are prominent; the latter has been associated with a CO line indicative of a possible association with a molecular cloud (Liszt et al. 1982; Liszt & Burton 1979). The mean opacity of the –20.1 km s-1 line in the MERLIN data is somewhat larger than the value reported by Liszt et al. (1982) (their position ‘c’); the properties of the +4.2 km s-1 feature agree closely. In the absence of a direct measurement, a possible distance is given by
| (1) |
where = 107 pc is the mean value of the Galactic height (Crovisier, 1978). This suggests that the moderate-velocity H i observed towards 3C123 is at pc (as adopted by Liszt et al. 1982), where 0.1 arcsec corresponds to transverse sizes 50 AU. The absorption at –20.1 km s-1 probably arises from more distant gas but a more precise estimate is not possible in this direction.
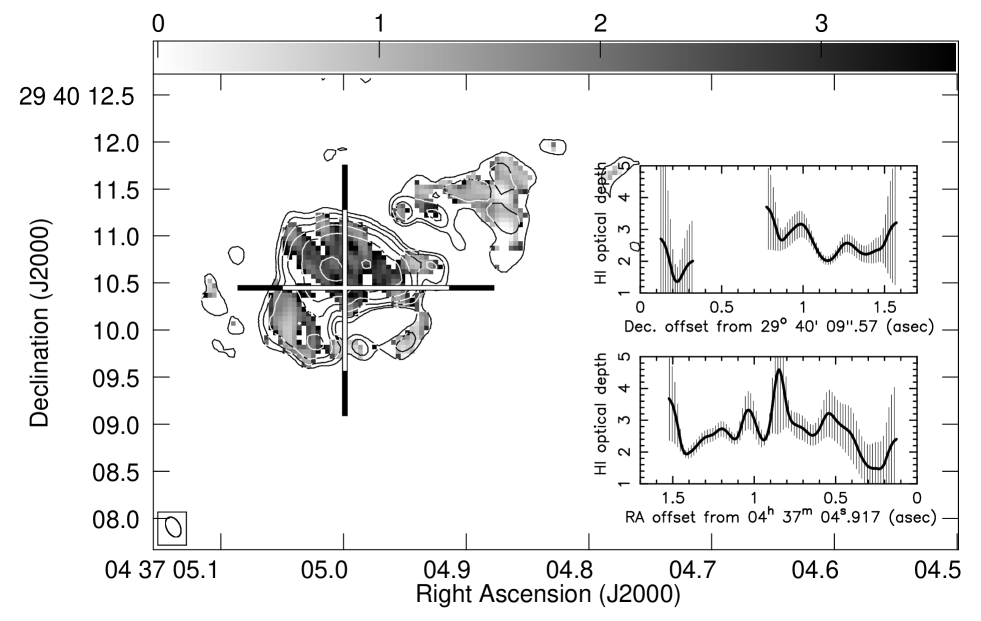
In Figs. 4 and 5 we show the major new results based on the MERLIN H i data for 3C 123. Figure 4 shows the optical depth image for the strongest line at 4.2 km s-1. At this velocity, variations in the Galactic H i opacity are observed with a statistical significance of only . The signal-to-noise ratio is limited due to the low surface brightness of this resolved source, using a beam size of arcsec. The angular scales of the variations vary from 0.2 to 0.6 arcsec (100 to 300 AU). In the N-S slice a variation of in opacity is observed. In the E-W slice a variation in opacity of is observed on a scale of 0.2 arcsec and a variation of over 0.3 arcsec. Figure 5 shows a comparable plot of the variation of H i opacity at –20.1 km s-1. The weak absorption is essentially constant over the scale of arcsec (1000 AU) at a level of (H i) .
3.3 3C 161
This low-latitude heavily reddened field ( = 21544, = –807) remains an empty field with no certain optical identification. 3C 161 is compact (Ulvestad et al. 1981; Perley 1982; Pearson et al. 1985) with observed radio structure on the arcsec scale. The later authors present a VLA image at 5 GHz (beam 0.4 arcsec) showing an obvious extension to the West. Edwards & Tingay (2004) have pointed out that 3C 161 is a CSS (compact steep spectrum source) with a spectral index of . The source has also been discussed by King et al. (1996). The continuum image made during the VLA H i observations of (1986) (beam 4.2 arcsec) remains a remarkable contribution in providing the overall morphology of the fainter components of the source over a range of 1 arcmin (see Appendix A). The source ‘B’ 20 arcsec to the NE (Ulvestad et al., 1981) is not detected by (1986). However, the strongest component of 3C 161 has not been detected by VLBI techniques; Fomalont et al. (2000) did not detect 3C 161 during the VSOP prelaunch VLBA 5 GHz survey. Faison and Goss have also observed 3C 161 with the VLBA in 1998 (unpublished) with a faint detection of emission on an angular scale of tens of mas. Thus 3C 161 contains no prominent milli-arcsec scale structure and is an ideal candidate for MERLIN 0.1 arcsec H i imaging. 3C 161 is the brightest of our three sources (the continuum flux density exceeds Jy beam-1 over almost 1 arcsec2), giving very good sensitivity to H i absorption on scales of 100 mas.
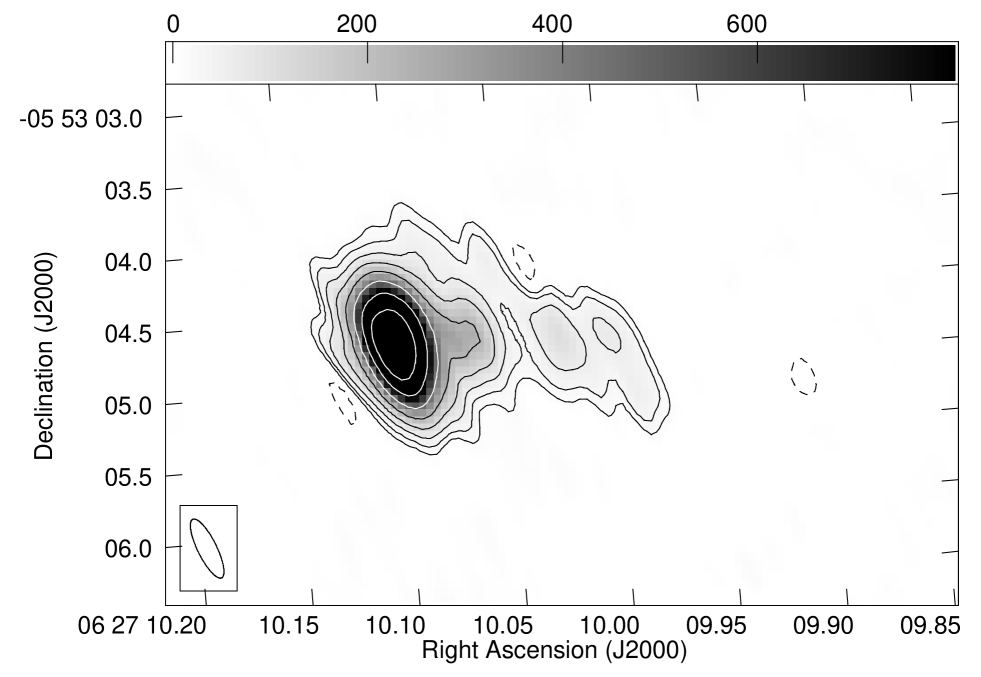
The continuum image obtained from the H i data in March 2002 is shown in Fig. 6. This and the following images have been rotated by 49 counter-clockwise in order to optimise the information in optical depth slices.
We retrieved the data presented by (1986) from the VLA archive and reduced them in order to check whether our results were consistent. The total continuum flux density detected by MERLIN in the 10-arcsec2 region around component ‘1’, shown in Fig. 6, is 10.5 Jy, compared to a peak flux density of 12.1 Jy in the newly constructed VLA image at (5.7 4.2) arcsec2 resolution. Thus, the MERLIN continuum image contains almost 90 per cent of the flux density as observed at lower resolution over the relevant field of view. The expectation that the MERLIN line data represents most of the VLA emission/absorption in this region is verified by the comparison of the two integrated H i spectra over the extent of the continuum source shown in Fig. 6. The VLA and MERLIN data agree remarkably well, given the uncertainties. In addition, the MERLIN spectrum over a much smaller region of (0.35 0.35) arcsec2, shown in Fig 7, also agrees with the mean VLA spectrum as expected. There remains the possibility that for 3C 161 the opacities at may be somewhat overestimated (by ), if there is a slight amount of missing continuum flux density. The weak extended components of 3C 161 (see Fig 16) are not detected in the MERLIN data due to the larger angular sizes and resulting lower surface brightnesses (giving mJy beam-1 on the scale of the MERLIN beam) compared with the bright NE lobe. There is some evidence in Fig. 7 for a separate line at km s-1, close to a line detected in the earlier NRAO 3-element interferometer data of (1976)
The observed range of velocities from 0 to 35 km s-1 suggests the influence of Galactic rotation in the third quadrant of the Galaxy with more positive velocities arising from IS gas at larger distances from the Sun. As an example the velocity of 34.2 km s-1 would have an inferred distance of kpc. The distances that can be associated with gas at lower velocities ( less than km s-1, twice the cloud-to-cloud velocity dispersion) are quite uncertain and a better estimate may well be to use Equation 1 with a resultant distance of 0.8 kpc. ((1986) have discussed the problem of distances of H i features in this direction. They point out that for 3C161 : “ … the Gould Belt phenomenon carries the cloud velocities to rotationally permitted values..” )
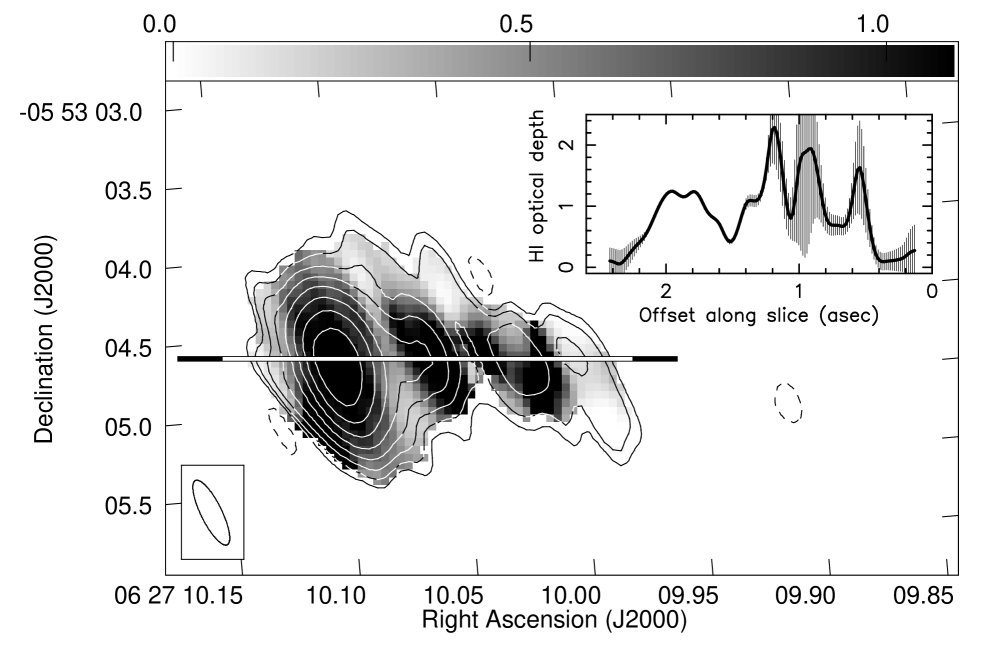
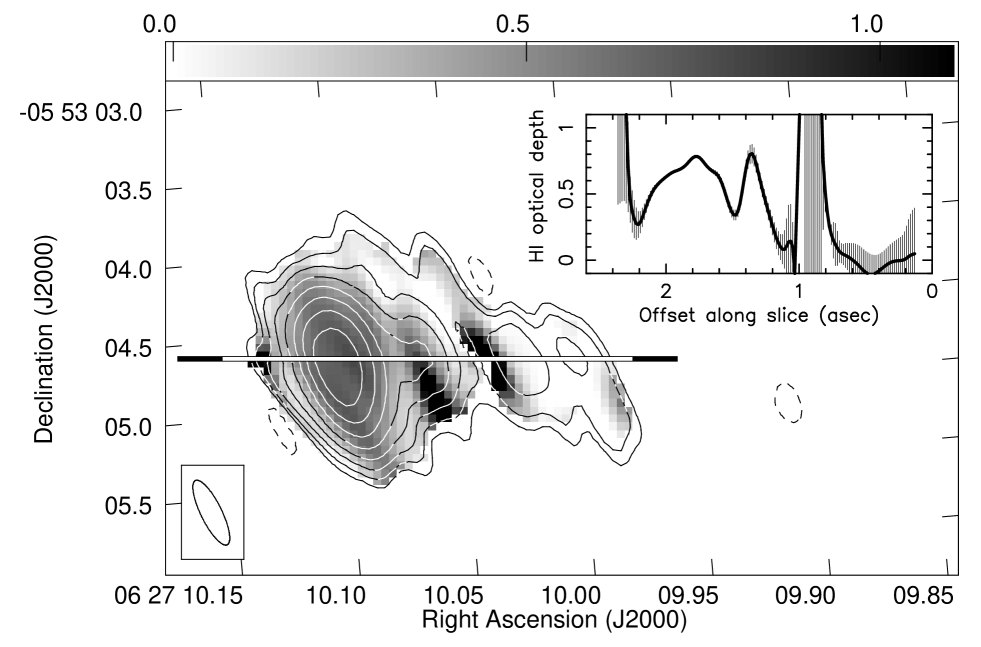
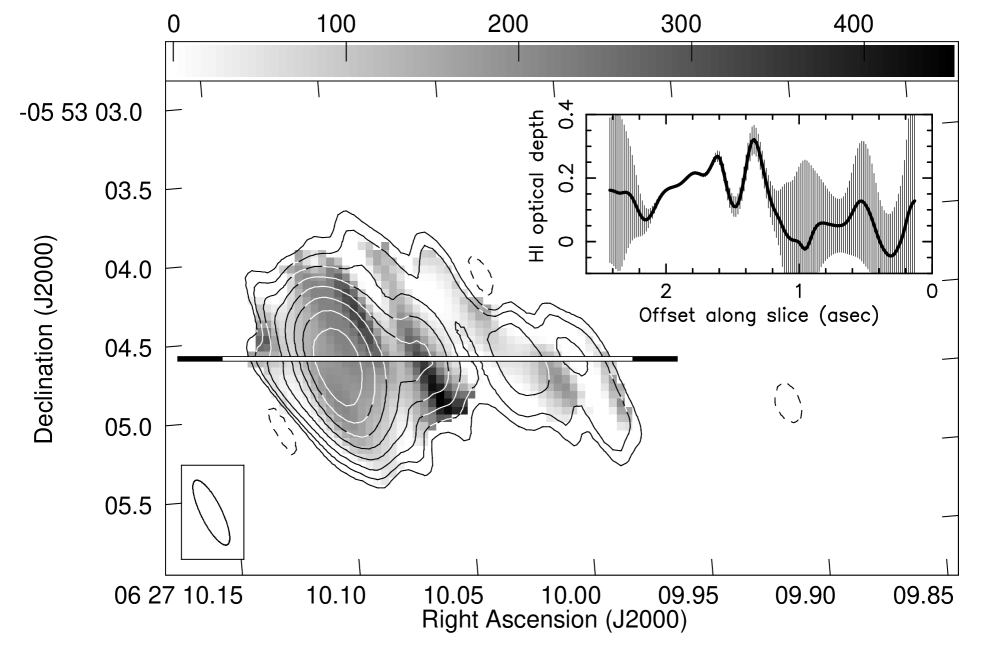
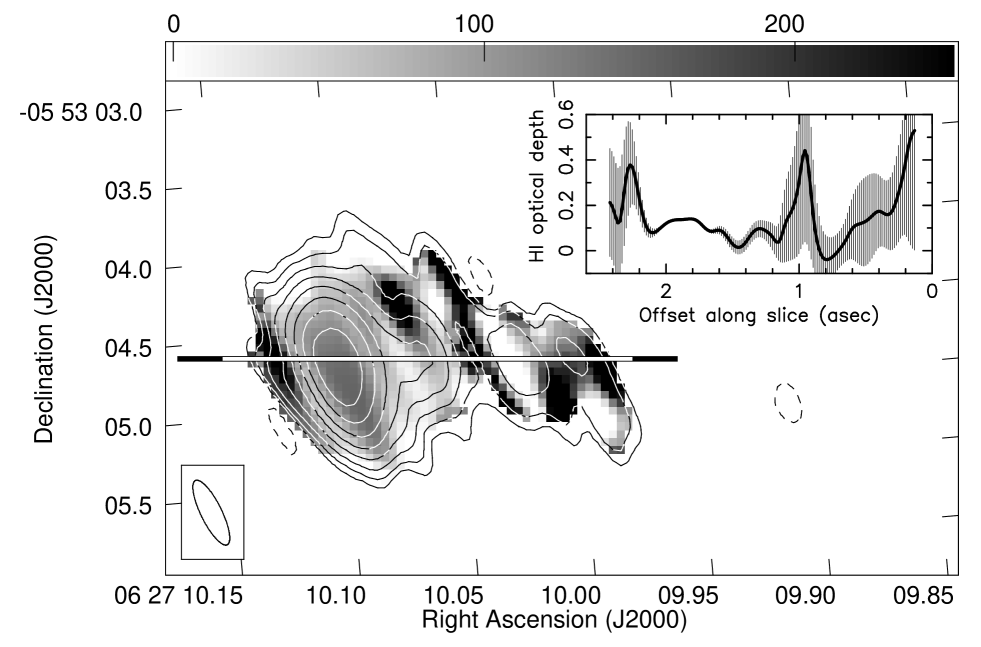
The MERLIN beam has an NS:EW axial ratio of and the resolved emission from 3C 161 is effectively only one beamwidth wide in the N-S direction. We therefore show slices in the direction of the long axis of the source, in the direction of the most favourable resolution. Figures 8, 9, 10, 11 and 12 show optical depth images with inserts showing slices of H i optical depth variation in single channels at velocities of 4.5, 6.6, 11.5, 20.2 and 34.2 km s-1. In the analysis following, we will derive distances for the lower velocity H i features (Figs. 8, 9 and 10) by assuming that they arise from gas at 0.8 kpc, where the MERLIN beam of 0.13 arcsec corresponds to about 100 AU. We will use the flat Galactic rotation curve for the higher velocities. These estimates are all quite uncertain.
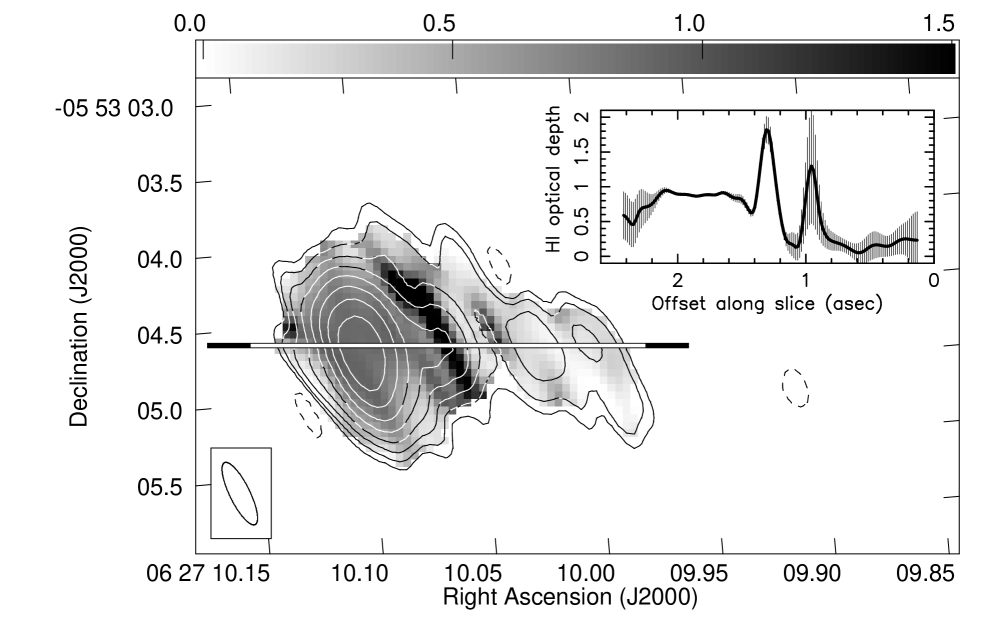
The variation of (H i) at 4.5 km s-1 (Fig. 8) is complex. The strongest H i absorption, at a positional offset along the slice of 1.8 arcsec, shows an excess opacity (with respect to the local background opacity) at a level of . This feature is spatially resolved with an angular size of 0.5 arcsec, or 400 AU. Its signal-to-noise ratio is . The other features in the slice show opacity fluctuations with poor signal to noise which are probably not significant. At a velocity of 6.6 km s-1 (Fig. 9), there is a prominent H i peak at a displacement of 1.3 arc sec; (H i) fluctuates by over a region of angular size arcsec (120 AU). These two spectral features overlap but can be decomposed into Gaussian line profiles, each of FWHM km s-1.
Farther East, the H i distribution is almost constant at (H i)=0.8 over an angular extent of at least 0.7 arcsec. Fig. 10 shows two prominent peaks at a velocity of 11.5 km s-1 at angular displacements of 1.8 and 1.4 arcsec, with excesses in (H i) of 0.5 and 0.6 and angular sizes of 0.5 and 0.2 arcsec (400 and 160 AU), respectively. The corresponding spectral feature has a FWHM of km s-1.
The H i opacity at 20.2 km s-1 (Fig. 11) is an order of magnitude weaker than at lower velocities. This spectral feature has a rather uneven shape with a FWHM of km s-1. The slice shows at least one H i component at an offset of 1.7 arcsec with fluctuations in (H i) of and an angular size of 0.5 arcsec (900 AU at a distance of 1.8 kpc). The highest velocity and hence most distant H i, at 34.2 km s-1 (Fig. 12), has a well-defined spectral profile of FWHM km s-1. The line does not show evidence of any significant variation in the H i opacity over an angular scale of 1 arcsec (3500 AU at a distance of 3.5 kpc).
4 Summary and Conclusions
We have used the MERLIN array to image Galactic H i absorption, with a resolution of 0.1 arcsec, in the direction of three background sources, 3C 111, 3C 123 and 3C 161. We resolve the H i distribution towards the latter two objects with angular sizes 1 arcsec. In the case of 3C 161, prominent spatial variations at velocities close to zero (in the range 4.5–11.5 km s-1) have been observed. In addition, at 20.2 km s-1 the opacity of the H i is an order of magnitude lower (); at this velocity significant fluctuations in the H i opacity across the face of 3C161 are observed. The inferred distance of this H i feature is 1.8 kpc. At the highest velocity in this direction (34.2 km s-1 at an inferred distance of 3.5 kpc) no significant changes in the weak H i features with (H i) are observed. In the direction of 3C123, there are suggestions of opacity variations in the low-velocity H i, but with a much lower statistical significance.
As pointed out by (1986), the expectation would be that the H i features at higher velocities would subtend smaller solid angles and thus cover a smaller fraction of the continuum background source; however the existence of a cloud size spectrum and random cloud velocities could mask the expected behaviour in this small sample. In addition, the higher-velocity H i lines have smaller opacities (0.1 to 0.2) compared to the lower velocity lines ( 1). This decrease in mean opacity reduces the sensitivity of these studies with respect to detecting significant spatial variations in the higher velocity lines.
On a spatial scale of 400 to 500 AU, prominent changes in opacity at the level of in the direction of 3C 161 are striking. Brogan et al. (2005) had previously determined with a linear resolution of 25 AU in the direction of 3C 138. The peak change in of about 1 seen in the MERLIN data is consistent with the peak fluctuation of about 0.7 on scales of 400–500 AU predicted by (2000). Previous studies of small scale H i have traditionally calculated the implied densities based on the assumption that the line of sight dimension is comparable to the observed transverse dimension. Heiles (2007) has discussed this assumption in detail; the expectation is that the objects are far from isotropic. The 400–500 AU structures detected in these observations would imply volume densities of cm-3 with column densities a few times cm-2 if the excitation temperature is 50 K (Brogan et al., 2007) and the objects have a path length along the line of sight that is more than ten times the transverse dimension.
5 Acknowledgements
We thank Kristina Barkume, who began the research on the 3C 161 data as a part of a senior thesis at Reed College in 2002–2003, and Michael Faison, who participated in the initial phases of this project. The National Radio Astronomy Observatory is a facility of the National Science Foundation operated under a cooperative agreement by Associated Universities, Inc. MERLIN is operated by the University of Manchester on behalf of the STFC (formerly PPARC).
References
- Andrews et al. (2001) Andrews, S. M., Meyer, D. M., & Lauroesch, J. T. 2001, ApJ, 552, L73
- Brogan et al. (2005) Brogan, C. L., Zauderer, B. A., Lazio, T. J., Goss, W. M., DePree, C. G., & Faison, M. D. 2005, AJ, 130, 698
- Brogan et al. (2007) Brogan, C. L., Goss, W. M., Lazio, T. J. W., & Faison, M. D. 2007, in ASP Conf. Ser. 365: SINS-Small Ionizied and Neutral Structures in the Diffuse Interstellar Medium, eds. M. Haverkorn & W.M. Goss (San Francisco: ASP), 12
- Cox et al. (1991) Cox, C. I., Gull, S. F., & Scheuer, P. A. G. 1991, MNRAS, 252, 558
- Crovisier (1978) Crovisier, J. 1978, A&A, 70,43
- Davis et al. (1996) Davis, R. J., Diamond, P. J., & Goss, W. M. 1996, MNRAS, 283, 1105
- (7) Deshpande, A. A. 2000, MNRAS, 317, 199
- Deshpande et al. (2000) Deshpande, A. A., Dwarakanath, K. S., & Goss, W. M. 2000, ApJ, 543, 227
- (9) Deshpande, A. A. 2007, in ASP Conf. Ser. 365: SINS-Small Ionizied and Neutral Structures in the Diffuse Interstellar Medium, eds. M. Haverkorn & W.M. Goss (San Francisco: ASP), 105
- Diamond et al. (2003) Diamond, P. J., Garrington, S. T., Gunn, A. G., Leahy, J. P., McDonald, A., Muxlow, T. W. B., Richards, A. M. S. & Thomasson, P., 2003, http://www.merlin.ac.uk/user_guide/OnlineMUG/
- Edwards & Tingay (2004) Edwards, P. G., & Tingay, S. J. 2004, A&A, 424, 91
- Faison et al. (1998) Faison, M. D., Goss, W. M., Diamond, P. J., & Taylor, G. B. 1998, AJ, 116, 2916
- Faison & Goss (2001) Faison, M. D., & Goss, W. M. 2001, AJ, 121, 2706
- Faison et al. (2007) Faison, M. D., Goss, W. M., & Muxlow, T. W. B. 2007, in ASP Conf. Ser. 365: SINS-Small Ionizied and Neutral Structures in the Diffuse Interstellar Medium, eds. M. Haverkorn & W. M. Goss (San Francisco: ASP), 71
- Fomalont et al. (2000) Fomalont, E. B., Frey, S., Paragi,Z. et al. 2000, ApJs, 131, 95
- (16) Greisen, E. W. 1976, ApJ, 203, 371
- (17) Greisen, E. W., & Liszt, H. S. 1986, ApJ, 303, 702
- Hardcastle et al. (1997) Hardcastle, M. J., Alexander, P., Pooley, G. G., & Riley, J. M. 1997, MNRAS, 288, 859
- (19) Haverkorn, M., & Goss, W. M. 2007, ASP Conf. Ser. 365: SINS-Small Ionized and Neutral Structures in the Diffuse Interstellar Medium, eds. M. Haverkorn & W.M. Goss (San Francisco: ASP).
- Heiles (1997) Heiles, C. 1997, ApJ, 481, 193
- Heiles (2007) Heiles, C. 2007, in ASP Conf. Ser. 365: SINS-Small Ionizied and Neutral Structures in the Diffuse Interstellar Medium, eds. M. Haverkorn & W.M. Goss (San Francisco: ASP), 3
- Heiles & Stinebring (2007) Heiles, C. & Stinebring, D. 2007, in ASP Conf. Ser. 365: SINS-Small Ionizied and Neutral Structures in the Diffuse Interstellar Medium, eds. M. Haverkorn & W.M. Goss (San Francisco: ASP), 331
- Jenkins & Tripp (2007) Jenkins, E. B., & Tripp, T. M. 2007, in ASP Conf. Ser. 365: SINS-Small Ionizied and Neutral Structures in the Diffuse Interstellar Medium, eds. M. Haverkorn & W.M. Goss (San Francisco: ASP). 51
- King et al. (1996) King, E. A., McCulloch, P. M., Jauncey, D. L., et al. 1996, in The Second Workshop on Gigahertz Peaked Spectrum and Compact Steep Spectrum Radio Sources, eds. I.A.G. Snellen et al. (Leiden Observatory), 17
- Lauroesch & Meyer (2003) Lauroesch, J. T., & Meyer, D. M. 2003, ApJl, 591, L123
- Lauroesch (2007) Lauroesch, J. T. 2007, in ASP Conf. Ser. 365: SINS-Small Ionizied and Neutral Structures in the Diffuse Interstellar Medium, eds. M. Haverkorn & W.M. Goss (San Francisco: ASP), 40
- Lindfield & Perley (1984) Lindfield, R., Perley, R. 1984, ApJ, 279, 60
- Liszt & Burton (1979) Liszt, H. S., & Burton, W. B. 1979, ApJ, 228, 105
- Liszt et al. (1982) Liszt, H. S., Dickey, J. M., & Greisen, E. W. 1982, ApJ, 261, 102
- Marscher, Moore & Bania (1993) Marscher, A. P., Moore, E. M. & Bania, T. M. 1993, ApJ, 419, 101
- Moore & Marscher (1995) Moore, E. M.& Marscher, A. P. 1995, ApJ, 452, 671
- Pearson et al. (1985) Pearsson, T. J., Perley, R. A., & Readhead, A. C. S. 1985, AJ, 90, 738
- Perley (1982) Perley, R. A. 1982, AJ, 87, 859
- Stanimirović et al. (2003) Stanimirivić, S., Weisberg, J. M., Hedden, A., Devine, K. E., & Green, J. T. 2003, ApJ, 598, L23
- Ulvestad et al. (1981) Ulvestad, J., Johnston, K., Perley, R., & Fomalont,E. 1981, AJ, 86, 1010
- Vallée, Broten & MacLeod (1988) Vallée, J. P., Broten, N. W., & MacLeod, J. M. 1988, A&A, 134, 199
- Weisberg & Stanimirović (2007) Weisberg, J. M., Stanimirović, S. 2007, in ASP Conf. Ser. 365: SINS-Small Ionizied and Neutral Structures in the Diffuse Interstellar Medium, eds. M. Haverkorn & W.M. Goss (San Francisco: ASP), 28
| Source | 3C 111 | 3C 123 | 3C 161 | |
|---|---|---|---|---|
| Galactic Coordinates | (l°, b°) | 161.68, –8.82 | 170.58, –11.66 | 215.44, –8.07 |
| Broad-band Continuum | ||||
| Date | YYYMMDD | 20030202 | 20030204 | 20011030 |
| Duration | (hr) | 17.5 | 16 | 10 |
| Frequency | (MHz) | 1408 | 1408 | 4994 |
| Phase Reference Source | B0415+398 | B0430+289 | B0605-085 | |
| Target Peak | (Jy bm-1) | 1.285 | 0.749 | 0.539 |
| RMS noise | (mJy bm-1) | 2.0 | 2.6 | 0.6 |
| Narrow-band/Line | ||||
| Date | YYYMMDD | 20030508 | 20030501 | 20020304 |
| Duration | (hr) | 16 | 16 | 9 |
| (km s-1) | 5.0 | 3.0 | 17.5 | |
| Phase Reference Source | B0415+398 | B0436+306 | B0605-085 | |
| Phase Ref. Flux Density | (Jy bm-1) | 0.41 | 0.55 | 2.1 |
| Synthesized Beam | (arcsecarcsec) | 0.19 0.15 | 0.23 0.14 | 0.46 0.13 |
| Position Angle | (deg) | 45 | 28 | 21 |
| Continuum Peak | (Jy bm-1) | 1.27 | 0.75 | 3.40 |
| Continuum | (mJy bm-1) | 2 | 4 | 4 |
| Line | (mJy bm-1) | 8.5 | 11 | 18 |


Appendix A Continuum observations of 3C161
We describe the radio continuum images of 3C161 obtained as part of this work since they are not published fully elsewhere. Although a powerful radio source, 3C161 lies at low Galactic latitude (°) and has therefore escaped much attention since it has often been excluded from samples under study. (1986) showed that this source possesses a classical double radio structure with an angular size of 62 arcseconds, albeit with a large brightness ratio in excess of 60 between the Northern and Southern hotspots. The H i absorption reported in this paper is associated with the brighter Northern hotspot.
A MERLIN high-resolution 5-GHz image is shown in Fig. 13. The observations are summarised in Table 1 and the data reduction is outlined in Section 2. The point source calibrator, B0552+398, was found to have a flux density of 5.74 Jy by comparison with 3C286. 3C 161 and the nearby (5.5°) phase-reference source B0605-085 were observed alternately for 5.5 and 2 min, respectively, over a total of 9.5 hr. We also used B0605-085 to correct for polarization leakage and we calibrated the polarization angle (P.A.) with respect to 3C286 which has an assumed P.A. of +33° (in the map plane).
Figure 13 shows a conventional hotspot structure (peak 539 mJy beam-1). The total intensity map noise around the hotspot is increased about three-fold with respect to more distant regions of the map (and the polarized intensity images) due to sidelobes of this bright source.
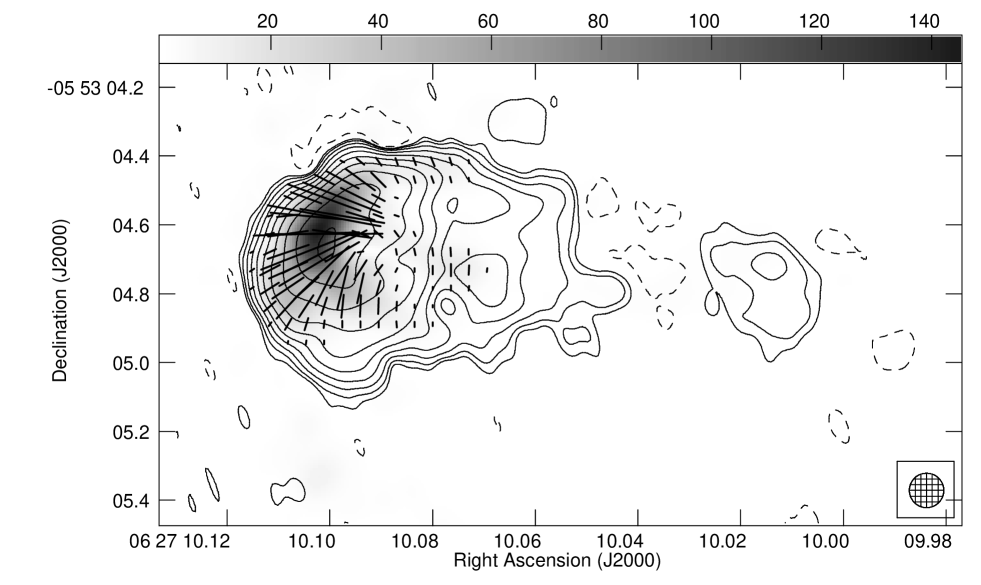
The polarized intensity image, Fig. 14 (left), shows that the brightest polarized emission lies around the outer edge of the hotspot region. The maximum polarized intensity detected is 145 mJy beam-1. The plotted vectors indicate the directions of the in situ E field, which have been corrected for foreground rotation using the rotation measure of 112 rad m2 given by Vallée, Broten & MacLeod (1988). These vectors indicate a circumferential magnetic field, as would be expected around the outer edge of the working surface of a lobe. The trajectory of the incoming beam or jet can be traced in the polarized intensity image, Fig. 14 (left). The jet enters the hotspot region from the West where the E vectors in Fig. 13 are parallel to each other and perpendicular to the jet direction (implying a magnetic field aligned with the jet). The fractional polarization is highest here and at the leading edge of the lobe, at per cent. The polarized intensity falls to nearly zero just as the jet enters the hotspot in a region where the polarized position angle is rotating rapidly, presumably due to shocks.
In addition to the bright emission associated with the Northern hotspot, we detect a compact component of mJy beam-1 ( at the local rms noise level) at a distance of 25.5 arcsec SW of the hotspot, shown in Fig. 14 (right). Its position is J 2000 right ascension , declination (uncertainty 25 mas). This is a candidate for the core of 3C 161; however, we note that it is not seen in any other available data. MERLIN did not detect any emission from the much weaker Southern hotspot.
Figure 15 shows an image of 3C 161 at 5 GHz which we made from VLA archive data (proposal code AP370, observed on 19980915 in the B-array configuration). The source was observed as a calibrator and, to our knowledge, no maps at this frequency and resolution range have previously been published. The positions of the MERLIN hotspot and core candidate are marked. The VLA did not detect any core emission but the 3 noise level of this image is close to the peak emission of the core candidate measured by MERLIN, so it is feasible that it was just below the detection threshold of these VLA data.
Figure 16 shows the 1.4-GHz continuum counterpart to the H i data published by (1986). The data have been re-processed and the image shown here is naturally-weighted. This map is thus somewhat deeper and more sensitive to extended low-surface-brightness emission than the original, figure 2a in (1986). The Northern component of this FRII double source is a little unusual since it has a tail which arcs around through degrees to the SE. This is in the same sense as the jet entry direction into the hotspot. There is also low surface brightness emission SW of the double structure which may be associated with the source.
A linear feature, seen in Fig. 16 extending from NW of the Northern hotspot, is difficult to interpret. It could be associated with a faint optical object seen in the Digitised Sky Survey111http://archive.stsci.edu/dss/index.html which also lies just NW of the 3C161 hotspot, but this cannot be related to 3C161. Indeed, there are no obvious optical counterparts which can be related to any part of the observed radio structure of 3C161, and thus it remains unidentified.