The Assembly of Galaxy Clusters
Abstract
We study the formation of fifty-three galaxy cluster-size dark matter halos () formed within a pair of cosmological CDM N-body simulations, and track the accretion histories of cluster subhalos with masses large enough to host galaxies. By associating subhalos with cluster galaxies, we find the majority of galaxies in clusters experience no “pre-processing” in the group environment prior to their accretion into the cluster. On average, of cluster galaxies fall into the cluster potential directly from the field, with no luminous companions in their host halos at the time of accretion; and less than are accreted as members of groups with five or more galaxies. Moreover, we find that cluster galaxies are significantly less likely to have experienced a merger in the recent past ( Gyr) than a field halo of the same mass. These results suggest that local, cluster processes like ram-pressure stripping, galaxy harassment, or strangulation play the dominant role in explaining the difference between cluster and field populations at a fixed stellar mass; and that pre-evolution or past merging in the group environment is of secondary importance for setting cluster galaxy properties for most clusters. The accretion times for cluster members are quite extended, with incorporated into the cluster halo more than Gyr ago and within the last Gyr. By comparing the observed morphological fractions in cluster and field populations, we estimate an approximate timescale for late-type to early-type transformation within the cluster environment to be Gyr.
Subject headings:
cosmology: theory, large-scale structure of universe — galaxies: formation, evolution, high-redshift, interactions, statistics1. Introduction
Galaxy clusters are over-abundant in red, early-type galaxies compared to the field population (Oemler, 1974; Butcher & Oemler, 1978; Dressler, 1980; Dressler et al., 1997; Treu et al., 2003; Balogh et al., 2004; Poggianti et al., 2006; Capak et al., 2007). Approximately of bright galaxies located within the virial radii of cluster halos are bulge-dominated (E + S0) compared to of similar luminosity galaxies located in very low-density environments (Whitmore & Gilmore, 1991; Postman et al., 2005). The fraction of weakly star-forming, early-type galaxies grows with the local galactic density, but even poor groups show differences compared to the general population (e.g., Postman & Geller, 1984; Dressler et al., 1997; Zabludoff & Mulchaey, 1998; Tran et al., 2001; Finn et al., 2008).
One suggestion is that “pre-processing” in the group environment prior to cluster formation is important in setting the early-type fraction in clusters (e.g., Zabludoff & Mulchaey, 1998; Zabludoff, 2002). A related possibility is that galaxies in clusters typically experience more mergers than field galaxies (prior to their accretion), and that this merger history bias plays a role in explaining population differences (Toomre & Toomre, 1972). Finally, the fact that the overall mix of galaxies in clusters by type is known to evolve with redshift (Butcher & Oemler, 1978; Ellingson et al., 2001; Tran et al., 2005; Gerke et al., 2007; Capak et al., 2007; Coil et al., 2008; Loh et al., 2008; Finn et al., 2008) suggests that the internal cluster processes play a major role in setting the differences between the cluster and field populations. Here we examine the formation of clusters in a CDM cosmological simulation in order to gain insight into these questions.
Galaxies in clusters and groups are subject to a number of processes that may suppress star formation or change the morphology of a galaxy. One such effect, ram-pressure stripping (Gunn & Gott, 1972; Quilis et al., 2000) seems to have been observed directly in Virgo (Chung et al., 2007), and simulations suggest that this process should operate on short, Gyr, timescales (Tonnesen, 2007). Other processes of relevance include galaxy-galaxy “harassment” within the cluster potential (Moore et al., 1996) and cold gas “strangulation” (Larson et al., 1980; Kauffmann et al., 1993), which cuts of the gas supply for ongoing star formation in cluster galaxies.
By incorporating subsets of these expected cluster processes into semi-analytic plus N-body models, several groups have investigated cluster galaxy population trends in the context of CDM (Balogh et al., 2000; Benson et al., 2001; Diaferio et al., 2001; Okamoto & Nagashima, 2001; Springel et al., 2001). Broadly speaking, these models have been successful in producing the general behavior that early type galaxies are more common in clusters, but full agreement between theory and observation has yet to be achieved. This is likely because some of the relevant processes (e.g., ram pressure stripping, harassment) have been neglected, and perhaps because some of the effects that were included (e.g., morphological transformation via mergers) were modeled by rough approximations. Our approach is related to these past theoretical efforts, but different in its goal. Specifically, we aim to quantify the basic assembly statistics for cluster member halos using N-body simulations and to present these as a basis for evaluating scenarios and interpreting observations. Surely, many of the of the statistical results presented here were implicitly included in past theoretical models that used N-body simulations as a basis, but our aim is to present the CDM predictions as purely as possible, without obscuring them with any particular set of model assumptions for the baryon physics.
In what follows we use a pair of N-body simulations to track the assembly history of cluster-size dark matter halos. In section § 2 we discuss the simulations and the method for finding halos and subhalos. We present our findings in § 3. We reserve § 4 for a discussion of potential implications. We conclude in § 5.
2. Methods
We study the formation histories of fifty-three cluster-size dark matter halos extracted from two cosmological N-body simulations with comoving cubic volumes of and on a side. Each simulation corresponds to a flat CDM cosmology with , , and and were performed using the Adaptive Refinement Tree (ART) code of Kravtsov et al. (1997). As discussed in Allgood et al. (2006) and Wechsler et al. (2006), the simulation followed the evolution of particles with a mass of and achieved a maximum force resolution of . The simulation (Allgood et al., 2006) followed the evolution of particles with a mass of with a maximum force resolution of .
We identify halos in the simulation using a variation of the Bound Density Maxima Algorithm (BDM Klypin et al., 1999), specifically adopting the methods outlined in Kravtsov et al. (2004). As described in Stewart et al. (2008) , virial radii and virial masses for halos are set by the radius within which the average density is times the mean density of the universe (e.g., Bryan & Norman, 1998). At this definition implies a radius-mass relation of . Subhalos are defined to be self-bound halos with centers located within the radius of a larger halo. In most cases, subhalo density profiles become overwhelmed by the larger halo’s density field at a truncation radius, , that is smaller than . The truncation radius is defined to be the radius where a halo’s density profile flattens to a value larger than . We define a halo’s mass, , to be the minimum and the mass within .
We use snapshot outputs from the simulation, spaced roughly equally in expansion factor back to to generate merger histories for halos and subhalos. For the simulation we used snapshot outputs, spaced roughly equally in expansion factor back to a . The merger trees were derived using the methods discussed in Allgood et al. (2006), Wechsler et al. (2006), and Stewart et al. (2008) . When halos are accreted into larger halos, we record the mass at this time and label it . For halos that are not subhalos (field halos) we set . We use this mass, , as a proxy for luminosity in defining our cluster galaxy samples (see below). Once a halo becomes a subhalo, we continue to track its mass as it evolves within the larger halo. When subhalos fall below a critical mass, , we explicitly remove them from our catalogs, and assume that any galaxy it was hosting has fallen out of the observational sample (either because it has lost a significant fraction of luminous mass or because it has been disrupted). This choice for allows us to define a sample cleanly at a mass scale where our halo finder is complete and our simulations are not strongly affected by over-merging.
In what follows we will assume that halos and subhalos with larger than a specific threshold will host one galaxy at their center. If a halo contains one or more subhalos, it is assigned one “central” galaxy in addition to one galaxy for each of its subhalos. The term host is used to describe the largest halo that contains a galaxy. A halo need not contain a subhalo in order for it to be classified as a host, it simply needs to be massive enough to contain a galaxy at its center. A subhalo cannot be a host. Finally, we term field halos to be all halos that are not contained within a larger halo. Thus, by definition field halos cannot be subhalos.
By associating galaxies with subhalos larger than a critical mass at the time of their accretion, we are adopting a strategy similar to that used successfully by Conroy et al. (2006) and Berrier et al. (2006). These authors were able to reproduce both the large-scale and small-scale clustering statistics of galaxies by assuming a monotonic relationship between the luminosity of a galaxy and the maximum circular velocity that its halo had when it is first accreted into a larger halo (see Wang et al., 2006, for a similar approach).
Our primary population of cluster galaxies is defined by setting and . Averaging over both simulation volumes, this choice defines a sample with number density . Matching this number density to the the Sloan Digital Sky Survey (SDSS) r-band luminosity function (Blanton et al., 2003), we estimate that these cuts correspond to a galaxy population with an r-band magnitude brighter than for . This is comparable to the luminosity ranges used in most cluster morphology studies (e.g., Dressler, 1980; Dressler et al., 1997; Postman et al., 2005). Note that our results are insensitive to the precise choice of . We have redone the analysis described below and using an value that differs by a factor of from our fiducial and find virtually identical results.
Twelve of our cluster halos are taken from the higher resolution simulation. For these high-resolution clusters, we explore the accretion histories of a second set of lower-mass cluster subhalos with and . This sample has a number density of , which, with , corresponds to minimum luminosity of using the SDSS luminosity function (Blanton et al., 2003). This sample will be used to test the dependence of our results on sample selection and should represent galaxies that are comparable to (although somewhat fainter than) the observational sample studied by Treu et al. (2003).
Of course, these estimated cluster galaxy luminosities are only approximate. We certainly don’t expect that a simple mapping between mass and luminosity will hold in detail, especially within the cluster environment. However, as we show below, our results do not depend strongly on the adopted mass cut. This suggests that the uncertain mapping between individual halo masses their associated galaxy luminosities should not hinder the interpretation of our results.
The total sample of cluster halos have masses spanning , with a median mass of . The total number of galaxy subhalos in this, our main sample of subhalos is ( per cluster). We also explore trends with cluster halo mass by dividing our main cluster sample into three mass bins containing 18, 17, and 18 clusters each, with mass ranges that span , , and , respectively. The clusters in these respective samples contain an average of , , and galaxies each. The subset of high-resolution cluster halos we study have masses that span . These clusters host a total of subhalos that meet our criterion and have an average of galaxies per cluster. The most massive cluster in this sample hosts galaxies. A summary of the clusters we study along with some properties of their accretion histories are given in Table 1.
In order to investigate the assembly of more massive clusters we also study clusters generated semi-analytically using the code described in Zentner et al. (2005, see also ). This model uses the extended Press-Schechter (EPS) formalism, applying the specific implementation of Somerville & Kolatt (1999) to produce mass accretion histories for host halos of a given present-day mass, and then tracks the orbital evolution of each tree’s subhalos in their host potential via analytic prescriptions governing dynamical friction and tidal mass loss. The initial orbital energy and impact parameter for each satellite system are drawn from probability distributions yielded by cosmological N-body simulations. This algorithm produces several statistics which match those produced in well understood cosmological simulations. While not as accurate as our numerical simulations, this computationally-inexpensive semi-analytic model allows us to explore trends with cluster mass (from ) with thousands of stochastically-generated halo formation histories.
3. Results
3.1. The environmental history of cluster galaxies
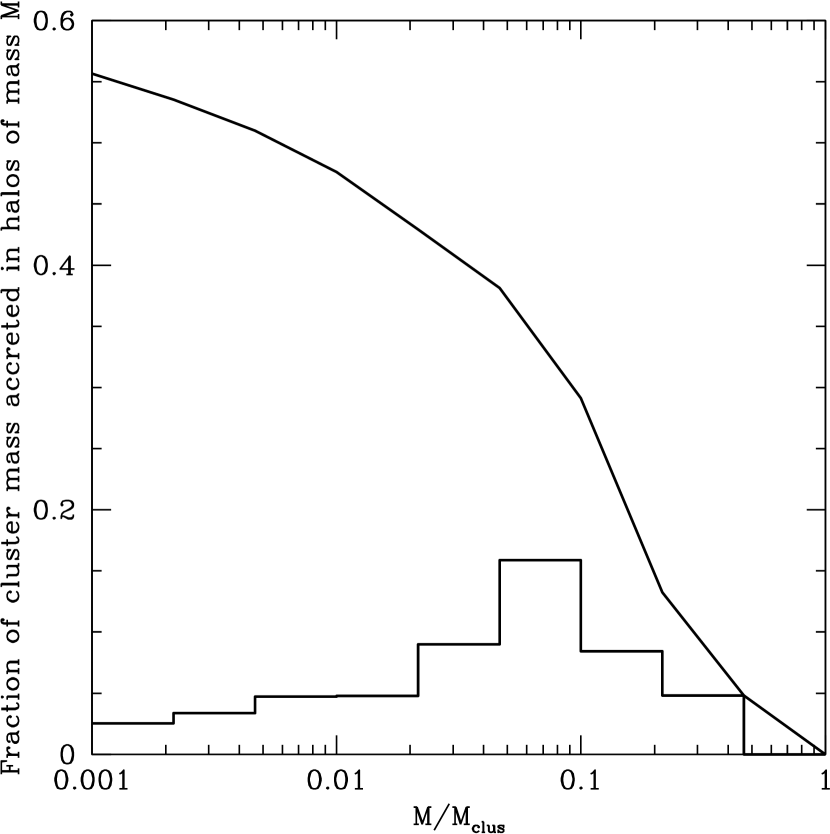
Before presenting results on the characteristics of cluster galaxies, we first explore the mass assembly distribution for the clusters themselves. The solid, monotonically increasing line in Figure 1 shows the mass fraction of our sample of 53 clusters that was built up from accreting halos more massive than , where is the halo mass just prior to accretion into the cluster. Note that we have normalized the accreted halo mass relative to the final cluster mass at , . The histogram shows the corresponding differential distribution. We see that the distribution peaks at . This result is consistent with the expectation that dark matter halos of any size mass are built primarily from objects that are of the mass of the final halo (Purcell et al., 2007; Stewart et al., 2008; Zentner, 2007). Note that more than half of the mass accreted from objects large enough to host galaxies () is accreted from group-scale systems with .
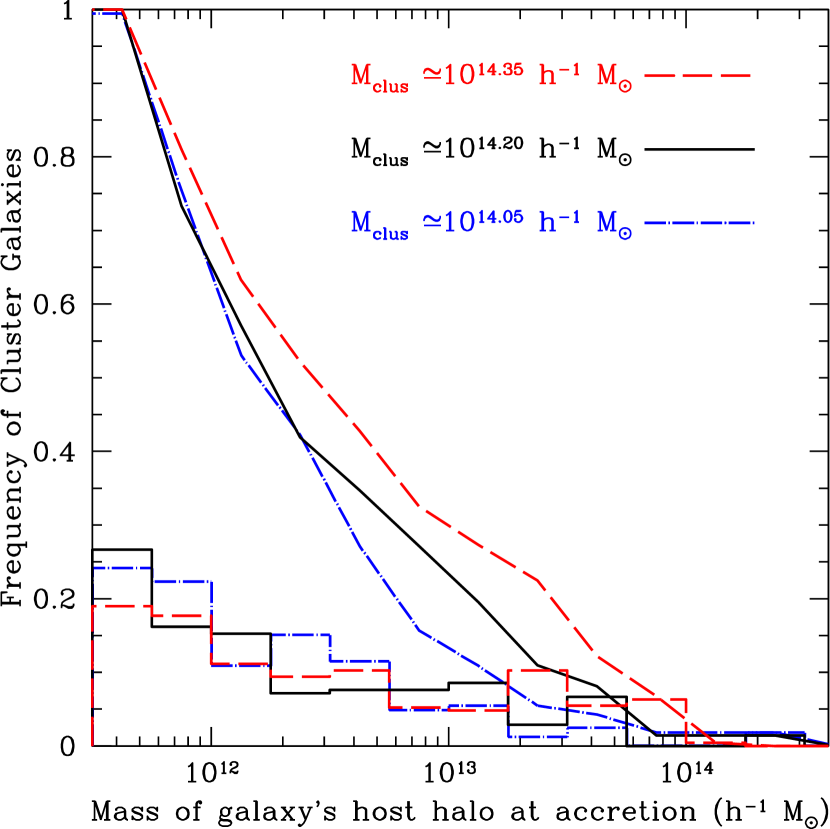
Compare this result to Figure 2, which shows the fraction of cluster galaxies that were accreted as members of host halos of a given mass. The short-dashed (blue), solid (black) and long-dashed (red) lines correspond to clusters in our three mass bins, centered on masses , , and , respectively. We see that for the typical cluster in our sample, only of the cluster’s galaxies were accreted as part of group-size objects with . For the lowest and highest mass subsamples we see that and of galaxies are accreted from group-mass halos. The results are not sensitive to the selection of our value.
The previous two figures show that cluster mass assembly is dominated by the most massive (group-size) accretion events, while cluster galaxy assembly is dominated by lower-mass (galaxy-size) halos. This can be understood by noting that the number of galaxies that a halo hosts does not increase linearly with host mass. A small group () contains times the mass of a single-galaxy halo (). However, typically a group halo of this mass will host only galaxies that are as bright as the galaxies associated with halos. (e.g., Berrier et al., 2006, and references therein). This means that a small number of group-size halos can deposit a significant amount of mass into a cluster without contributing an equally large fraction of its galaxies.
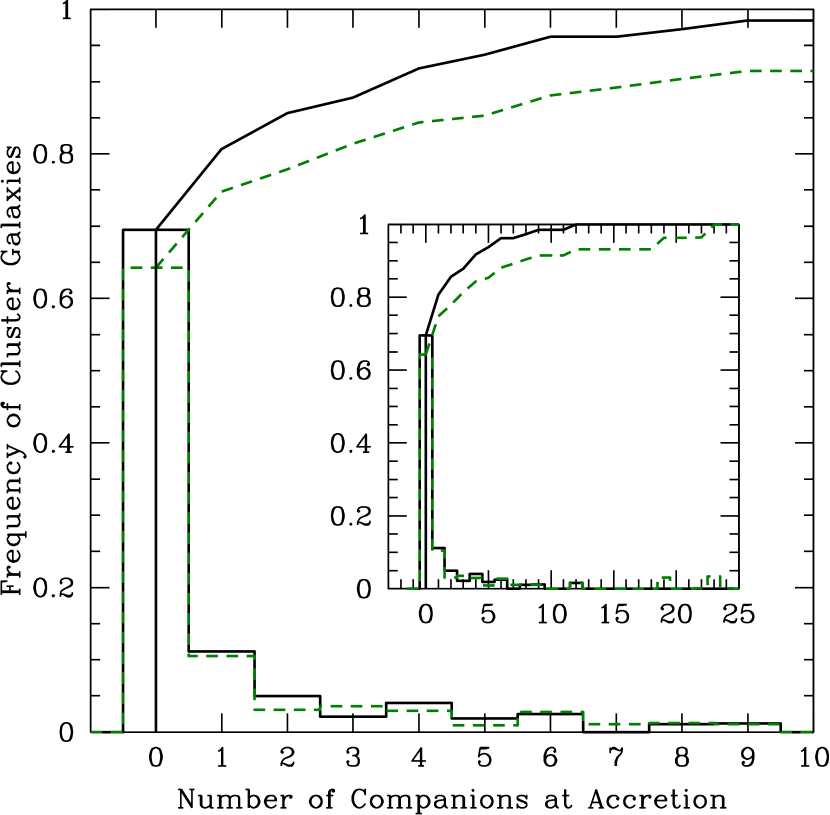
While the mass of a galaxy’s host at accretion provides some insight into the environment within which it formed and evolved before joining the cluster, a more direct measure of the environment can be obtained by counting the number of galaxies that each host halo contained at the time of its infall. Figure 3 shows the distribution of the number of companions each cluster galaxy had within its host halo at the time it was accreted into the cluster. The companion count includes any other galaxies that existed within a galaxy’s host halo at the time of accretion. We do not require that a companion galaxy “survives” with at in order to include it in this count — it simply must have at the time of accretion into the cluster. A companion count of zero implies that the galaxy was accreted as the only object in its halo (i.e., it was accreted from the field). The two solid lines show the binned and cumulative distributions for our standard sample of 834 galaxies within 53 clusters, and the pair of dark green dashed lines correspond to our sample of 643 lower mass galaxy halos taken from the high-resolution clusters. For our standard sample, approximately of cluster galaxies were accreted as the only galaxy within their halo and were accreted with fewer than galaxies. The numbers are similar for the sample that includes smaller galaxy halos. In this case, of the cluster galaxies are accreted directly from the field.
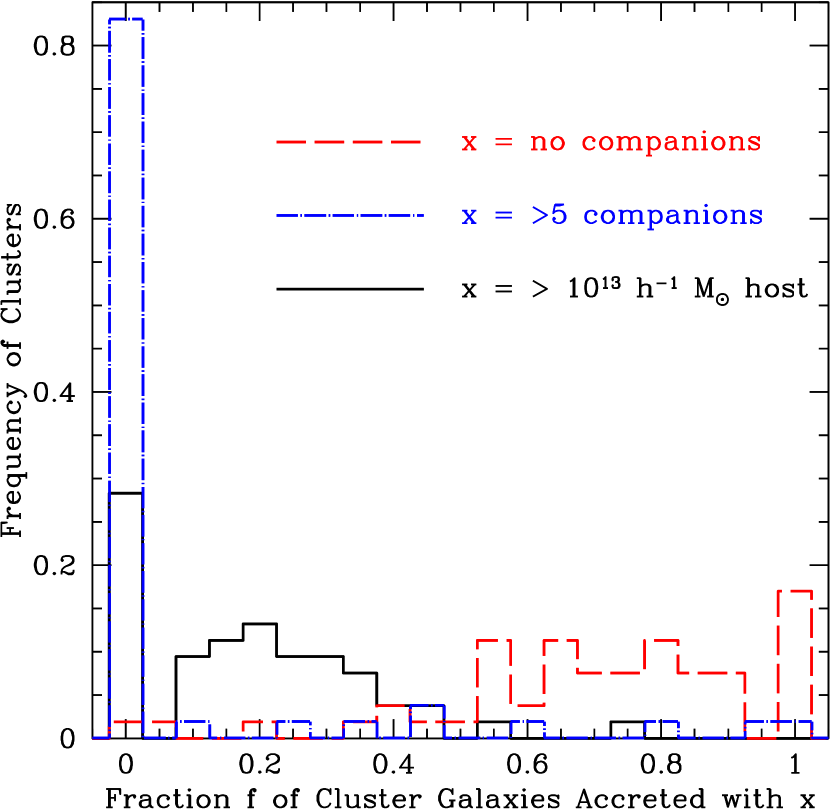
So far we have considered only averages for entire samples and sub-samples of our cluster-galaxy population. We would also like to obtain some indication of the variation in assembly histories from cluster to cluster. Figure 4 presents statistics on the individual () galaxy populations subdivided into their respective clusters. The red-dashed line shows the distribution of our clusters that have a given fraction () of their galaxies accreted directly from the “field”, as the only object in their halos. For example, an abscissa value of implies that 50 % of a cluster’s galaxies were accreted from the field. The peak in the red-dashed histogram at shows that (10/53) of our clusters were assembled entirely from field accretions. The blue, short-dashed line shows the distribution of our clusters that had a fraction of their galaxies accreted together with or more companions in their host halos at the time of their infall into the cluster. The spike in the blue short-dashed histogram at implies that (44/53) of our clusters had none of their galaxies accreted from a group with or more companions. Finally, the solid line shows the frequency of clusters with a fraction of their galaxies accreted from within group-mass halos with . We see that most clusters have between and of their galaxies accreted from group-mass halos. However, the solid-line’s peak at shows that a non-negligible fraction (, 15/53) of our clusters had none of their galaxies accreted as members of group or cluster-size halos.
3.2. Trends with Cluster Mass
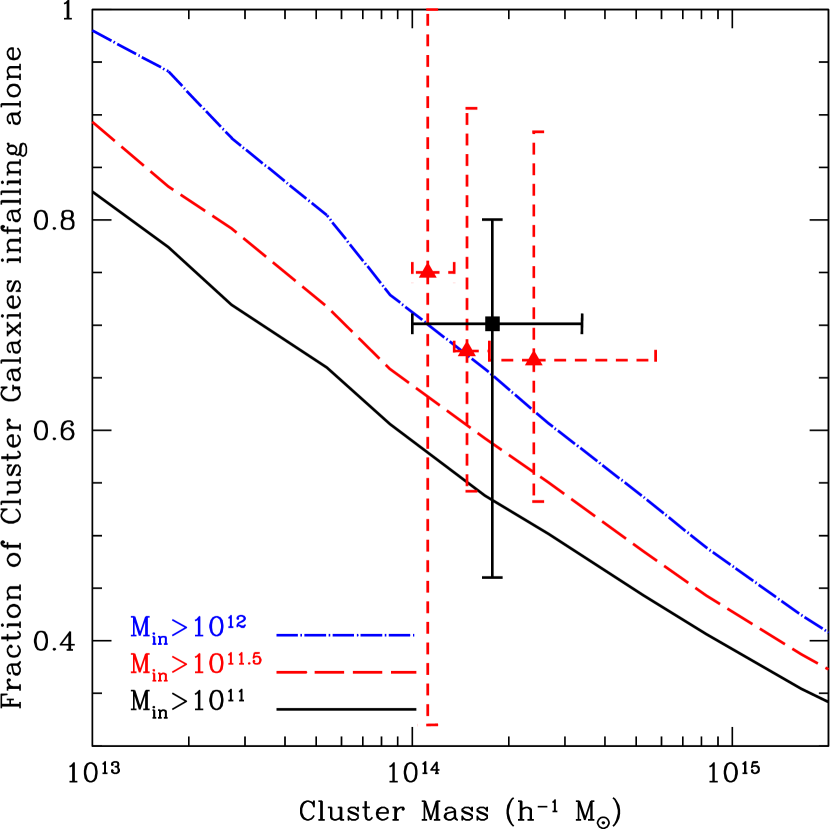
Figure 2 shows that more massive clusters are more likely to have had their galaxies accreted from massive host halos. Figure 5 explores the issue of mass dependence more fully. Shown is the fraction of surviving cluster galaxies that fell into the cluster without a bright companion in their host halo at the time of accretion as a function of the cluster mass. The three triangle data points show the median fractions for three mass bins based on our standard sample of clusters with galaxy halos set via , . The square data point is from our high-resolution sample, with galaxies identified using our criterion, corresponding to . Vertical error bars correspond to the sixty-eighth percentile range and the horizontal error bars span the mass range of clusters included in the bins. As expected, we do see a slight mass trend in the median, with the fraction of field-accreted galaxies falling from to as the cluster mass increases from to , although the overall trend is weak compared to the scatter from cluster-to-cluster at fixed mass.
In order to explore how this trend continues over a broader cluster
mass range, we have used the Zentner et al. (2005) semi-analytic
merger-tree and substructure code (see also, Purcell et al., 2007)
to generate cluster halo realizations at each of cluster
halo mass values between and . The three line types correspond to three different
choices for defining the galaxy samples, with ,
, and , from top-to bottom, respectively.
Galaxy subhalos are counted at as surviving galaxies if they
maintain masses larger than , , and
, respectively. The long-dashed red and solid
black lines should correspond to the red triangle and black square
N-body points, respectively. While the overall normalization of the
semi-analytic estimates is low compared to the N-body result, the mass
trend is in approximate agreement, with more massive clusters
accreting a smaller fraction of their galaxies directly from the
field, with a mass scaling as over the mass
range plotted. Note that we expect even the most massive clusters to
have a significant fraction of their galaxies accreted directly from
the field.
3.3. Cluster assembly with time
The results presented in the previous section suggest that most cluster galaxies experienced no evolution in a group environment prior to their accretion into the cluster, lending support to the idea that internal cluster processes are responsible for the differences seen between cluster galaxies and those in field environments. If this is so, then the distribution of time spent in the cluster environment can provide insight into the timescales required for morphological transformation or the truncation of star formation.
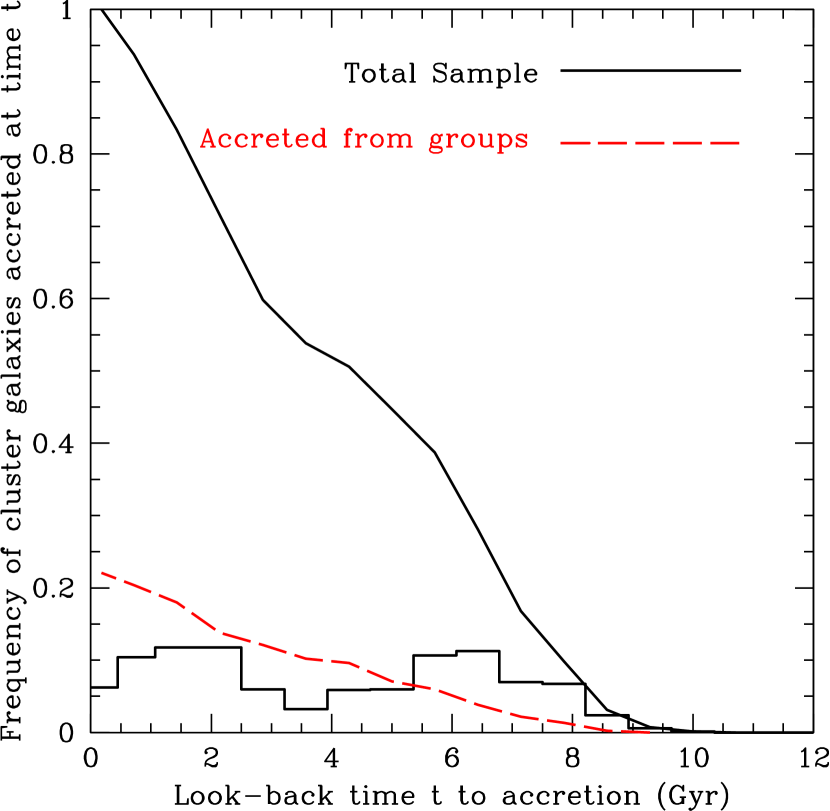
Figure 6 shows the distribution of accretion times for surviving cluster galaxies in our main cluster sample. We see that the accretion rate has been fairly uniform over the past Gyr, with the median lookback time to accretion at Gyr. Interestingly, as shown by the red-dashed line, galaxies that were acccreted as part of group-mass halos with are biased to having been accreted later than the full sample. Specifically, the median lookback time for galaxies accreted as part of a group-mass system is Gyr. This is not surprising, since it takes time for group-mass systems to form in a hierarchical universe. Indeed, we suspect that this fact is driving the double-peaked signature in the accretion time histogram, which has a slight dip at Gyr. We do not find a trend between the accretion time distribution and cluster mass within our sample. Table 1 lists the median lookback accretion times for each cluster individually.
Another way to gain insight into the history of cluster galaxies is to quantify the amount of time a galaxy spends within a host halo of a given mass. Figure 7 shows the mean time that a cluster galaxy has spent in a host halo of a given mass, averaged over the history of the simulation. We see that this time-weighted host mass distribution for cluster galaxies is bimodal – on average, cluster galaxies have spent time either in their cluster or within a galaxy-mass halo prior to accretion. This distribution is calculated by examining the mass of each galaxy’s dark matter halo at each of the snapshots taken from the simulation. The simplifying assumption is made that the halo spends all of its time at that given mass until the next timestep. The pronounced dip in the middle shows that cluster galaxies tend to avoid spending time in groups. Here we have used the full sample of cluster galaxies with to compute the average time that a cluster galaxy has spent in a host halo of a given mass. The peaks of the distribution are at the single galaxy-halo scale, , and at the median cluster scale . Note that galaxies can spend some time in halos smaller than our threshold. Specifically, these halos grew from a small mass to a mass larger than before being accreted. It is clear that, on average, cluster galaxies spend very little time in the group-mass halos between and .
Figure 8 makes a similar point, but in a more extreme fashion. Here we plot the fraction of galaxies that have spent any time within a halo within a given mass bin. We use the same simplifying assumption that the halo remains at the same mass until the next time step, therefore our ability to determine whether halos have spent anytime in a halo is limited by our output timestep spacing. In this figure, a value of unity implies that every galaxy has spent at least some time in a halo of this size.


3.4. Cluster Galaxies and Merger Histories
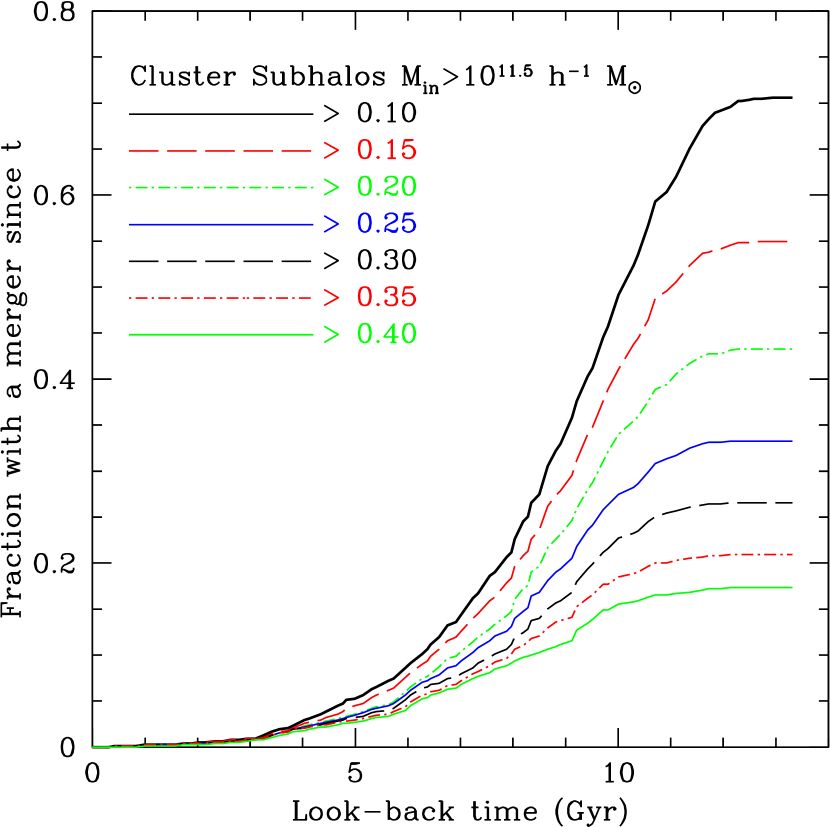
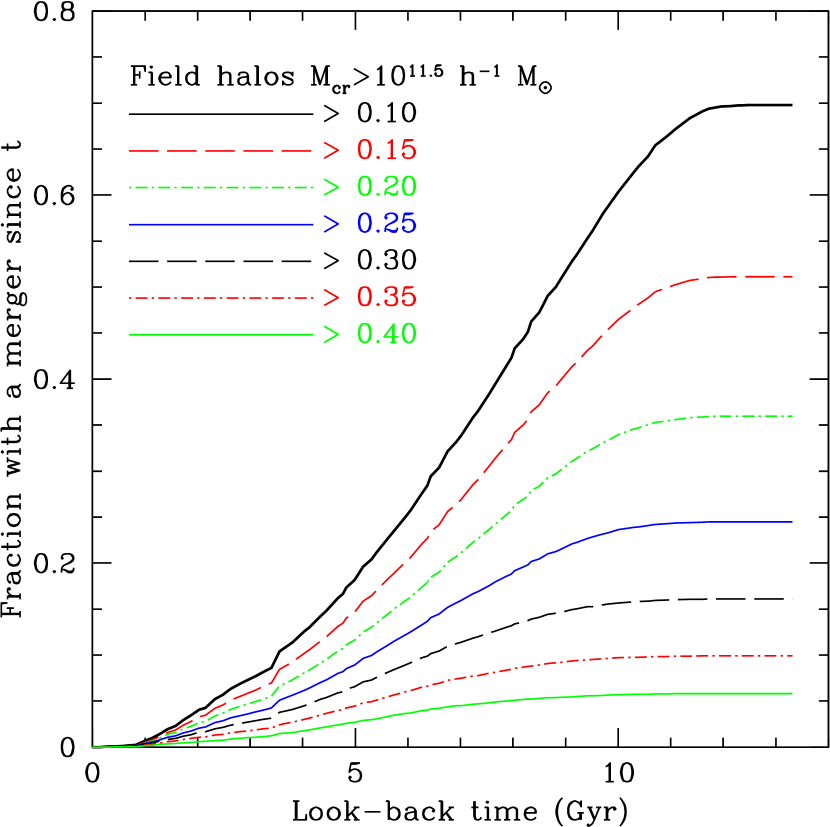
It is common to argue that spheroidal galaxies are associated with halos that have undergone significant mergers. This motivates us to compare the merger histories of field and cluster galaxies. The left panel of Figure 9 shows the cumulative fraction of cluster galaxies halos (, ) that have have had a large merger since a given lookback time. The right panel shows the same statistic, now for field halos with . The different line types correspond to different mass-ratio mergers: to from top (solid) to bottom (dashed). The mass ratio is defined to be the ratio relative to for cluster galaxies and relative to at for field halos.
At large lookback times cluster galaxies and field galaxies show similar results, at least for intermediate-size mergers. The total fraction of systems with and mergers in the last Gyr are and , respectively, for both the cluster and field populations. The cluster population has a larger fraction of systems that have ever experienced very large mergers. For example, of cluster galaxies have experienced something larger than a merger in the last Gyr, compared to just in the field.
Perhaps the most striking difference is that the cluster population is much less likely to have had a recent ( Gyr) merger event than galaxies in the field. The fraction of cluster galaxies with a significant merger in the last Gyr is less than . Given that half of cluster galaxies were accreted more than Gyr ago (Figure 6), this general result is not surprising. We expect the high-speed cluster environment to greatly reduce the likelihood for a merger. Large mergers are more likely to occur in the field.
4. Discussion
4.1. Pre-processing
Galaxy groups provide an important intermediate environment between the field and high-density clusters for testing ideas about galaxy formation and evolution (Zabludoff & Mulchaey, 1998). Indeed, it is possible that pre-processing in the group environment prior to the assembly of galaxy clusters is an important factor in explaining why cluster galaxies differ significantly from the field population. Assuming that CDM provides an accurate description of the universe, the simulations presented here allow us to characterize the importance of groups in the global formation of galaxy clusters.
Note that with our definition, groups and clusters are defined using the standard “virial” over-density boundary for host dark matter halos. In this case, most galaxies in the universe do not reside in groups. CDM simulations suggest that only of L∗ galaxy halos reside within the virial radii of group or cluster halos (e.g., Berrier et al., 2006, and references therein). It is interesting then to ask whether majority of cluster galaxies were assembled from the field population or whether they are biased to be galaxies that evolved in groups.
While Figure 1 demonstrates that a significant fraction of the mass in clusters is accreted from group-size dark matter halos, Figures 2 and 3 show that the same is not true for galaxies in clusters. Less than of cluster galaxies in clusters fell in as a part of a group with five or more other galaxies. Similarly, were accreted as part of a halo more massive than . This finding suggests that pre-processing cannot play the dominant role in differentiating cluster galaxy populations from the field. As we discuss below, our results suggest that global differences between cluster and field populations must be set by environmental influences associated with the clusters themselves.
It is also important to emphasize that the pre-cluster evolution histories of cluster galaxies varies significantly from cluster to cluster. This variation is demonstrated in Figure 4. For example, while most of our clusters () have galaxy populations that are completely devoid of objects that were accreted from groups with five or more companions, a small fraction () of our clusters have a majority () of their galaxies that fell into the cluster from groups of this kind.
Zabludoff & Mulchaey (1998) have suggested that cD galaxies in clusters may form originally in the group environment. Our results do not prevent such a scenario from occurring in some cases, particularly in those where a large group-scale merger has occurred recently. As seen in Figures 7 and 8, there are always a few galaxies that evolve in groups. Additionally, these figures only include galaxies that survive to the present. Galaxies that are accreted into the cluster and destroyed may provide material for the growth of cD galaxies and is consistant with the results of Lin & Mohr (2004).
We also find a weak trend between the fraction of cluster galaxies that could have experienced pre-processing and the mass of the cluster. For the lowest mass third of our cluster sample, , we see from Figure 5 that of cluster galaxies are accreted directly from the field. This number drops to in our largest mass sample, . This trend with mass is certainly real, however, the variation from cluster-to-cluster is much stronger than the mass trend itself. The results of Weinmann et al. (2006) suggest that the early-type fraction of cluster galaxies rises from to in clusters of mass to . It is possible that pre-processing could play a role in driving this weak mass trend.
4.2. Cluster Galaxy Merger Histories
As we showed in Figure 9, there are clear statistical differences between the merger histories of cluster galaxies and field galaxy halos. Nonetheless, it is unlikely that merger histories alone can explain the morphology, color, and spectral-type differences seen between cluster galaxies and the field. For example, let us take and as characteristic bulge-dominated fractions in clusters (within ) and the field, respectively (Whitmore & Gilmore, 1991; Postman et al., 2005). By examining Figure 9 we see that the field spheroid population potentially could be associated directly with the of field halos that have experienced a merger in the last Gyr. However, the cluster spheroid population cannot be explained with the same set of assumptions: only of cluster halos have had a similar merger in the same period of time, and only have ever experienced a merger.
Given that merger histories alone cannot explain the differences between cluster and field populations, we are forced to construct more complicated scenarios involving mergers to help explain the observed population differences. For example, galaxies in the field are expected to be surrounded by reservoirs of baryons that can cool to reform a disk after a large merger. Galaxies in clusters would likely be stripped of this reservoir by the ambient cluster medium, making it impossible for cluster galaxies to accrete material to reform a disk after they have fallen into the cluster. The right panel of Figure 9 shows that we could potentially associate the of bulge-dominated galaxies in the field with the mergers that occurred within the last Gyr (and assume that merger remnants, older than Gyr, in the field have reformed disks). However, even this scenario would have difficulties explaining the cluster population: only of cluster galaxies have ever experienced a merger (left panel, Figure 9) and only were accreted into the cluster in the last Gyr. Thus, obtaining more than a spheroid fraction without other transformational effects (i.e., harassment) would seem difficult.
The scenario discussed above is similar to that adopted in many semi-analytic models (e.g., Benson et al., 2001; Springel et al., 2001), where galaxies experience “strangulation” as their fresh gas supply is cut off when they fall into the cluster environment. Not only does this effect prevent the possible reformation of disks, but it can cause the galaxy to redden over Gyr timescales (Poggianti et al., 1999; Balogh et al., 2000; Ellingson et al., 2001) and thus help explain the morphological and spectral mix of cluster populations. It should be noted, however, that observations of moderate redshift clusters suggest that either two different physical processes or at least two different timescales are responsible for spectral and morphological transformations in clusters (Poggianti et al., 1999).
4.3. Accretion Times and Galaxy Transformation
The timescales available for cluster galaxy transformation can be garnered directly from Figure 6 (also Figure 7). We expect gravitational processes like harassment to operate over timescales similar to the cluster dynamical time, Gyr. Given this, Figure 6 shows that of cluster galaxies have been in the cluster potential long enough to experience significant dynamical perturbations. In order to transform a field disk population to a cluster disk population, we need of accreted galaxies to be affected (assuming spheroids remain spheroids). Figure 6 shows that of cluster galaxies have been within the cluster longer than Gyr ( dynamical times). This estimate suggests that Gyr is a typical transformation timescale for cluster galaxies.
The timescale for strangulation is much shorter than a dynamical time, and should begin to operate as soon as the galaxy encounters the intra-cluster medium ( Gyr). We expect ram pressure to be important at higher hot gas densities than strangulation (i.e., at smaller cluster-centric radii) and therefore the associated timescale for ram pressure to act should be somewhat longer than that for strangulation, perhaps of order a dynamical time. Given the infall time distribution in Figure 6, we expect that most cluster galaxies will have been affected to some degree by the cutoff of fresh gas infall (e.g., with infall times Gyr). This process can alter spectral properties without affecting the morphological mix. A smaller fraction have been in the cluster for dynamical time ( with infall times Gyr) – long enough to experience significant dynamical (morphological) transformations.
The above discussions provide some qualitative evaluation of ideas
that may explain why the cluster galaxy population is different from
the field population. A similar analysis, involving a more precise
characterization of radial dependencies and merger histories, and the
evolution of cluster galaxy infall times with the redshift of the
cluster, will be an important avenue for future investigation.
5. Conclusions
We use two cosmological N-body simulations set within the concordance CDM cosmology to study the formation of cluster-sized dark matter halos with masses spanning . Our primary results are based on tracking the merger histories of galaxy subhalos within these clusters. These, our cluster galaxies, are picked to have masses at the time they first fell into their host halos, and should correspond approximately to L∗ galaxies. Our conclusions may be summarized as follows.
-
•
We find that the majority of cluster galaxies () are accreted directly from the field, as the only objects within their dark matter halos at the time of their infall into the cluster virial radius. A minority () were accreted as part of group-mass halos, and a small fraction () of cluster galaxies fell into their clusters with more than galaxies in their halos at the time of accretion.
-
•
Cluster galaxy infall histories show significant variation from cluster to cluster. For example, 9/53 () of the clusters in our sample were assembled entirely from the accretion of field galaxies. However, 4/53 () of our clusters had a majority of their galaxies () accreted from groups with five or more companions. Therefore, while on average cluster galaxies tend to be accreted from the field, there are some clusters that do not follow this trend.
-
•
More massive clusters have a smaller fraction of their galaxies (at fixed luminosity) accreted directly from the field. Approximately of galaxies in halos are accreted from the field, compared to of galaxies in clusters. The scatter in formation histories from cluster-to-cluster at fixed mass is more significant than this mass trend.
-
•
The median lookback time to accretion for galaxies within clusters is Gyr, and of galaxies are accreted between and Gyr ago. By assuming that cluster galaxies are accreted with a morphological mix similar to the field, we estimate an approximate cluster-environmental transformation timescale of Gyr.
-
•
Galaxy subhalos in clusters are significantly less likely to have had a recent ( Gyr) merger than similar mass galaxy halos in the field. The merger fraction within the past Gyr is higher for the cluster subhalo population.
Taken together, these results suggest that the observed population differences between galaxies in clusters and those in the field are driven primarily by internal cluster processes. Given CDM as a basis, merging in the group environment, or any other type of pre-processing in galaxy groups prior to cluster assembly, cannot be a major factor in setting the nearly two-to-one difference in early-type fraction between clusters and the field.
Approximately half of an average cluster’s population is accreted more than Gyr ago ( dynamical time). This allows ample time for gravitational processes to drive morphological transformations within the cluster environment. Moreover, interactions with the intra-cluster medium that remove gas and suppress star formation in cluster galaxies likely begin to operate on even shorter timescales ( Gyr). Therefore, most cluster galaxies () will be affected by the cluster environment, at least to some degree.
While our results suggest that pre-processing is not the dominant mechanism in setting galaxy cluster processes, we do find most clusters have a non-negligible fraction of their galaxies accreted from a group environment. This is especially true for the more massive clusters in our sample (), for which we find that of their galaxies were accreted as part of a halo larger than a group-mass scale . Therefore, some amount of preprocessing should occur.
As mentioned in the introduction, important constraints on the types of processes that act to shape the cluster and group galaxy populations come from studies at intermediate to high redshift (Butcher & Oemler, 1978; Tran et al., 2005; Gerke et al., 2007; Capak et al., 2007; Finn et al., 2008). A valuable direction of future work will be to combine the predicted N-body statistics for cluster halo assembly time with these results as a means to constrain specific scenarios for galaxy transformation and star formation suppression.
References
- Allgood et al. (2006) Allgood, B., Flores, R. A., Primack, J. R., Kravtsov, A. V., Wechsler, R. H., Faltenbacher, A., & Bullock, J. S. 2006, MNRAS, 367, 1781
- Balogh et al. (2004) Balogh, M. L., Baldry, I. K., Nichol, R., Miller, C., Bower, R., & Glazebrook, K. 2004, ApJ, 615, L101
- Balogh et al. (2000) Balogh, M. L., Navarro, J. F., & Morris, S. L. 2000, ApJ, 540, 113
- Benson et al. (2001) Benson, A. J., Frenk, C. S., Baugh, C. M., Cole, S., & Lacey, C. G. 2001, MNRAS, 327, 1041
- Berrier et al. (2006) Berrier, J. C., Bullock, J. S., Barton, E. J., Guenther, H. D., Zentner, A. R., & Wechsler, R. H. 2006, ApJ, 652, 56
- Blanton et al. (2003) Blanton, M. R., Hogg, D. W., Bahcall, N. A., Brinkmann, J., Britton, M., Connolly, A. J., Csabai, I., Fukugita, M., Loveday, J., Meiksin, A., Munn, J. A., Nichol, R. C., Okamura, S., Quinn, T., Schneider, D. P., Shimasaku, K., Strauss, M. A., Tegmark, M., Vogeley, M. S., & Weinberg, D. H. 2003, ApJ, 592, 819
- Bryan & Norman (1998) Bryan, G. L. & Norman, M. L. 1998, ApJ, 495, 80
- Butcher & Oemler (1978) Butcher, H. & Oemler, Jr., A. 1978, ApJ, 219, 18
- Capak et al. (2007) Capak, P., Abraham, R. G., Ellis, R. S., Mobasher, B., Scoville, N., Sheth, K., & Koekemoer, A. 2007, ApJS, 172, 284
- Chung et al. (2007) Chung, A., van Gorkom, J. H., Kenney, J. D. P., & Vollmer, B. 2007, ApJ, 659, L115
- Coil et al. (2008) Coil, A. L., Newman, J. A., Croton, D., Cooper, M. C., Davis, M., Faber, S. M., Gerke, B. F., Koo, D. C., Padmanabhan, N., Wechsler, R. H., & Weiner, B. J. 2008, ApJ, 672, 153
- Conroy et al. (2006) Conroy, C., Wechsler, R. H., & Kravtsov, A. V. 2006, ApJ, 647, 201
- Diaferio et al. (2001) Diaferio, A., Kauffmann, G., Balogh, M. L., White, S. D. M., Schade, D., & Ellingson, E. 2001, MNRAS, 323, 999
- Dressler (1980) Dressler, A. 1980, ApJ, 236, 351
- Dressler et al. (1997) Dressler, A., Oemler, A. J., Couch, W. J., Smail, I., Ellis, R. S., Barger, A., Butcher, H., Poggianti, B. M., & Sharples, R. M. 1997, ApJ, 490, 577
- Ellingson et al. (2001) Ellingson, E., Lin, H., Yee, H. K. C., & Carlberg, R. G. 2001, ApJ, 547, 609
- Finn et al. (2008) Finn, R. A., Balogh, M. L., Zaritsky, D., Miller, C. J., & Nichol, R. C. 2008, ArXiv:802.2282 [asstro-ph]
- Gerke et al. (2007) Gerke, B. F., Newman, J. A., Faber, S. M., Cooper, M. C., Croton, D. J., Davis, M., Willmer, C. N. A., Yan, R., Coil, A. L., Guhathakurta, P., Koo, D. C., & Weiner, B. J. 2007, MNRAS, 376, 1425
- Gunn & Gott (1972) Gunn, J. E. & Gott, J. R. I. 1972, ApJ, 176, 1
- Kauffmann et al. (1993) Kauffmann, G., White, S. D. M., & Guiderdoni, B. 1993, MNRAS, 264, 201
- Klypin et al. (1999) Klypin, A., Gottlöber, S., Kravtsov, A. V., & Khokhlov, A. M. 1999, ApJ, 516, 530
- Kravtsov et al. (2004) Kravtsov, A. V., Gnedin, O. Y., & Klypin, A. A. 2004, ApJ, 609, 482
- Kravtsov et al. (1997) Kravtsov, A. V., Klypin, A. A., & Khokhlov, A. M. 1997, ApJS, 111, 73
- Larson et al. (1980) Larson, R. B., Tinsley, B. M., & Caldwell, C. N. 1980, ApJ, 237, 692
- Lin & Mohr (2004) Lin, Y.-T. & Mohr, J. J. 2004, ApJ, 617, 879
- Loh et al. (2008) Loh, Y. ., Ellingson, E., Yee, H. K. C., Gilbank, D. G., Gladders, M. D., & Barrientos, L. F. 2008, ArXiv:802.3726 [astro-ph]
- Moore et al. (1996) Moore, B., Katz, N., Lake, G., Dressler, A., & Oemler, A. 1996, Nature, 379, 613
- Oemler (1974) Oemler, A. J. 1974, ApJ, 194, 1
- Okamoto & Nagashima (2001) Okamoto, T. & Nagashima, M. 2001, ApJ, 547, 109
- Poggianti et al. (1999) Poggianti, B. M., Smail, I., Dressler, A., Couch, W. J., Barger, A. J., Butcher, H., Ellis, R. S., & Oemler, A. J. 1999, ApJ, 518, 576
- Poggianti et al. (2006) Poggianti, B. M., von der Linden, A., De Lucia, G., Desai, V., Simard, L., Halliday, C., Aragón-Salamanca, A., Bower, R., Varela, J., Best, P., Clowe, D. I., Dalcanton, J., Jablonka, P., Milvang-Jensen, B., Pello, R., Rudnick, G., Saglia, R., White, S. D. M., & Zaritsky, D. 2006, ApJ, 642, 188
- Postman et al. (2005) Postman, M., Franx, M., Cross, N. J. G., Holden, B., Ford, H. C., Illingworth, G. D., Goto, T., Demarco, R., Rosati, P., Blakeslee, J. P., Tran, K.-V., Benítez, N., Clampin, M., Hartig, G. F., Homeier, N., Ardila, D. R., Bartko, F., Bouwens, R. J., Bradley, L. D., Broadhurst, T. J., Brown, R. A., Burrows, C. J., Cheng, E. S., Feldman, P. D., Golimowski, D. A., Gronwall, C., Infante, L., Kimble, R. A., Krist, J. E., Lesser, M. P., Martel, A. R., Mei, S., Menanteau, F., Meurer, G. R., Miley, G. K., Motta, V., Sirianni, M., Sparks, W. B., Tran, H. D., Tsvetanov, Z. I., White, R. L., & Zheng, W. 2005, ApJ, 623, 721
- Postman & Geller (1984) Postman, M. & Geller, M. J. 1984, ApJ, 281, 95
- Purcell et al. (2007) Purcell, C. W., Bullock, J. S., & Zentner, A. R. 2007, ApJ, 666, 20
- Quilis et al. (2000) Quilis, V., Moore, B., & Bower, R. 2000, Science, 288, 1617
- Somerville & Kolatt (1999) Somerville, R. S. & Kolatt, T. S. 1999, MNRAS, 305, 1
- Springel et al. (2001) Springel, V., White, S. D. M., Tormen, G., & Kauffmann, G. 2001, MNRAS, 328, 726
- Stewart et al. (2008) Stewart, K. R., Bullock, J. S., Wechsler, R. H., Maller, A. H., & Zentner, A. R. 2008, ApJ, accepted, ArXiv:711.5027 [astro-ph]
- Tonnesen (2007) Tonnesen, S. 2007, New Astronomy Review, 51, 80
- Toomre & Toomre (1972) Toomre, A. & Toomre, J. 1972, ApJ, 178, 623
- Tran et al. (2001) Tran, K.-V. H., Simard, L., Zabludoff, A. I., & Mulchaey, J. S. 2001, ApJ, 549, 172
- Tran et al. (2005) Tran, K.-V. H., van Dokkum, P., Illingworth, G. D., Kelson, D., Gonzalez, A., & Franx, M. 2005, ApJ, 619, 134
- Treu et al. (2003) Treu, T., Ellis, R. S., Kneib, J.-P., Dressler, A., Smail, I., Czoske, O., Oemler, A., & Natarajan, P. 2003, ApJ, 591, 53
- Wang et al. (2006) Wang, L., Li, C., Kauffmann, G., & De Lucia, G. 2006, MNRAS, 371, 537
- Wechsler et al. (2006) Wechsler, R. H., Zentner, A. R., Bullock, J. S., Kravtsov, A. V., & Allgood, B. 2006, ApJ, 652, 71
- Weinmann et al. (2006) Weinmann, S. M., van den Bosch, F. C., Yang, X., & Mo, H. J. 2006, MNRAS, 366, 2
- Whitmore & Gilmore (1991) Whitmore, B. C. & Gilmore, D. M. 1991, ApJ, 367, 64
- Zabludoff (2002) Zabludoff, A. 2002, in Astronomical Society of the Pacific Conference Series, Vol. 257, AMiBA 2001: High-Z Clusters, Missing Baryons, and CMB Polarization, ed. L.-W. Chen, C.-P. Ma, K.-W. Ng, & U.-L. Pen, 123–+
- Zabludoff & Mulchaey (1998) Zabludoff, A. I. & Mulchaey, J. S. 1998, ApJ, 496, 39
- Zentner (2007) Zentner, A. R. 2007, International Journal of Modern Physics D, 16, 763
- Zentner et al. (2005) Zentner, A. R., Berlind, A. A., Bullock, J. S., Kravtsov, A. V., & Wechsler, R. H. 2005, ApJ, 624, 505
- Zentner & Bullock (2003) Zentner, A. R. & Bullock, J. S. 2003, ApJ, 598, 49
| Cluster id | Mass | Galaxies | ||||||
|---|---|---|---|---|---|---|---|---|
| () | () | () | () | () | Gyr | Gyr | () | |
| 1.120 | 5.86 | 1.71 | 15/53 | 34/53 | 6/53 | 7.1 | 2.4 | NA |
| 2.120 | 4.41 | 1.56 | 10/31 | 23/31 | 0/31 | 7.4 | 5.0 | NA |
| 3.120 | 3.80 | 1.48 | 3/23 | 19/23 | 0/23 | 7.4 | 4.9 | NA |
| 1.80 | 3.44 | 1.44 | 6/28 | 17/28 | 0/28 | 6.2 | 5.2 | 26/102 |
| 4.120 | 2.95 | 1.36 | 9/23 | 18/23 | 0/23 | 4.9 | 2.2 | NA |
| 5.120 | 2.77 | 1.34 | 5/26 | 14/26 | 0/26 | 5.2 | 5.8 | NA |
| 6.120 | 2.60 | 1.31 | 7/33 | 21/33 | 0/33 | 5.2 | 5.5 | NA |
| 7.120 | 2.57 | 1.30 | 7/21 | 14/21 | 0/21 | 3.4 | 1.8 | NA |
| 2.80 | 2.44 | 1.28 | 0/19 | 19/19 | 0/19 | 7.8 | 6.5 | 6/89 |
| 3.80 | 2.11 | 1.22 | 3/19 | 17/19 | 0/19 | 6.2 | 3.0 | 11/51 |
| 8.120 | 2.06 | 1.21 | 4/23 | 9/23 | 10/23 | 8.4 | 6.1 | NA |
| 9.120 | 1.94 | 1.19 | 23/41 | 21/41 | 9/41 | 6.6 | 4.5 | NA |
| 10.120 | 1.92 | 1.18 | 8/27 | 16/27 | 0/27 | 4.7 | 3.0 | NA |
| 11.120 | 1.88 | 1.17 | 6/22 | 18/22 | 0/22 | 8.1 | 5.8 | NA |
| 4.80 | 1.87 | 1.17 | 6/19 | 13/19 | 5/19 | 5.8 | 4.9 | 25/71 |
| 12.120 | 1.85 | 1.17 | 2/19 | 17/19 | 0/19 | 6.0 | 5.5 | NA |
| 13.120 | 1.80 | 1.16 | 2/17 | 15/17 | 0/17 | 5.8 | 4.5 | NA |
| 14.120 | 1.74 | 1.14 | 12/16 | 9/16 | 7/16 | 0.7 | 1.3 | NA |
| 15.120 | 1.71 | 1.14 | 0/17 | 17/17 | 0/17 | 8.7 | 5.7 | NA |
| 16.120 | 1.60 | 1.11 | 6/16 | 9/16 | 0/16 | 7.4 | 2.1 | NA |
| 17.120 | 1.59 | 1.11 | 7/15 | 8/15 | 0/15 | 2.4 | 3.0 | NA |
| 5.80 | 1.55 | 1.10 | 0/18 | 14/18 | 0/18 | 7.4 | 3.0 | 3/43 |
| 6.80 | 1.51 | 1.09 | 3/15 | 10/15 | 5/15 | 6.2 | 3.0 | 9/47 |
| 18.120 | 1.51 | 1.09 | 5/13 | 9/13 | 0/13 | 2.2 | 2.2 | NA |
| 19.120 | 1.49 | 1.09 | 0/10 | 10/10 | 0/10 | 6.5 | 7.1 | NA |
| 7.80 | 1.48 | 1.08 | 6/23 | 16/23 | 0/23 | 6.2 | 3.9 | 14/67 |
| 20.120 | 1.48 | 1.08 | 1/11 | 6/11 | 0/11 | 5.8 | 4.2 | NA |
| 21.120 | 1.48 | 1.08 | 3/8 | 7/8 | 0/8 | 3.6 | 1.8 | NA |
| 22.120 | 1.48 | 1.08 | 1/6 | 4/6 | 0/6 | 7.6 | 1.9 | NA |
| 23.120 | 1.45 | 1.08 | 1/10 | 8/10 | 0/10 | 7.3 | 2.1 | NA |
| 8.80 | 1.44 | 1.07 | 3/10 | 5/10 | 0/10 | 6.8 | 5.2 | 9/42 |
| 9.80 | 1.42 | 1.07 | 1/9 | 8/9 | 0/9 | 5.5 | 3.9 | 9/37 |
| 24.120 | 1.41 | 1.07 | 0/11 | 9/11 | 0/11 | 7.6 | 4.9 | NA |
| 25.120 | 1.39 | 1.06 | 3/12 | 8/12 | 0/12 | 7.4 | 7.1 | NA |
| 26.120 | 1.39 | 1.06 | 1/7 | 5/7 | 0/7 | 6.8 | 6.0 | NA |
| 27.120 | 1.34 | 1.05 | 3/13 | 0/13 | 13/13 | 5.5 | 5.8 | NA |
| 28.120 | 1.28 | 1.03 | 1/5 | 5/5 | 0/5 | 6.9 | 3.9 | NA |
| 29.120 | 1.27 | 1.03 | 0/12 | 10/12 | 0/12 | 6.0 | 5.0 | NA |
| 30.120 | 1.23 | 1.02 | 0/9 | 9/9 | 0/9 | 7.1 | 6.8 | NA |
| 31.120 | 1.23 | 1.02 | 3/15 | 8/15 | 0/15 | 6.6 | 2.4 | NA |
| 32.120 | 1.22 | 1.02 | 0/10 | 10/10 | 0/10 | 7.1 | 4.1 | NA |
| 33.120 | 1.16 | 1.00 | 0/8 | 6/8 | 0/8 | 7.4 | 5.3 | NA |
| 10.80 | 1.14 | 0.99 | 2/8 | 6/8 | 0/8 | 7.8 | 6.5 | 3/30 |
| 11.80 | 1.12 | 0.99 | 0/12 | 12/12 | 0/12 | 7.4 | 6.2 | 0/30 |
| 34.120 | 1.12 | 0.99 | 1/5 | 4/5 | 0/5 | 6.1 | 5.8 | NA |
| 35.120 | 1.12 | 0.99 | 1/7 | 6/7 | 0/7 | 5.8 | 1.8 | NA |
| 36.120 | 1.12 | 0.99 | 0/8 | 6/8 | 0/8 | 5.8 | 2.2 | NA |
| 37.120 | 1.10 | 0.98 | 0/12 | 5/12 | 7/12 | 5.2 | 4.4 | NA |
| 38.120 | 1.09 | 0.98 | 3/9 | 4/9 | 0/9 | 7.3 | 3.6 | NA |
| 39.120 | 1.08 | 0.98 | 4/9 | 2/9 | 7/9 | 8.4 | 0.7 | NA |
| 12.80 | 1.01 | 0.95 | 0/9 | 9/9 | 0/9 | 8.1 | 3.9 | 0/34 |
| 40.120 | 1.01 | 0.95 | 0/6 | 2/6 | 0/6 | 7.1 | 6.1 | NA |
| 41.120 | 1.01 | 0.95 | 0/9 | 9/9 | 0/9 | 8.5 | 4.7 | NA |
Note – The first column denotes the our id numbers, ordered by mass within their respective simulation box. The number following the decimal point corresponds to the box size in comoving . The second column lists the cluster virial mass in units of . The third column lists the cluster virial radius in . The fourth column, , lists the fraction of () galaxies that were accreted in a group-size halos with . The fifth and sixth columns list the fraction of galaxies that were accreted as the only object in their halo () and with five or more companions in their halo (), respectively. Columns seven and eight show the approximate lookback times to the host halos accretion of half of its mass and half of its surviving substructure respectively. Finally, the last column is the same as the fourth column, except now we track the fraction of galaxies accreted in group-mass halos using our high-resolution sample of galaxies.