11email: ginevra.trinchieri@brera.inaf.it 22institutetext: ESO - Alonso de Cordova 3107 Vitacura Casilla 19001 Santiago 19, Chile 33institutetext: CSIRO/ATNF - Paul Wild Observatory Narrabri NSW 2390 AUSTRALIA 44institutetext: Astrophysics Group, School of Physical and Geographical Sciences, Keele University, Keele, Staffordshire ST5 5BG, UK. 55institutetext: Departamento de Astronomía, Universidad de Guanajuato, 36000 Guanajuato, Guanajuato, Mexico 66institutetext: Laboratoire AIM, CEA/DSM - CNRS - Université Paris Diderot, DAPNIA/SAp, 91191 Gif sur Yvette, France
Detection of a hot intergalactic medium in the spiral-only compact group SCG0018-4854
Abstract
Aims. Compact groups of galaxies are excellent laboratories for studying galaxy interactions and their effects on the evolution of galaxies. In particular, dynamically young systems, with a large fraction of interacting, late type galaxies, have so far escaped proper studies in the X-ray band and their hot intergalactic medium properties are virtually unknown. Motivated by this lack of knowledge, we present a detailed investigation here of the X-ray properties of such a dynamically young system.
Methods. We obtained XMM-Newton observations of one spiral-only system in the new southern compact group catalogue: SCG0018-4854. We present here the results of the data analysis and discuss them in comparison with the few other similar systems also studied in the X-ray band.
Results. The 4 members of SCG0018-4854 emit at a level comparable to what is expected based on their optical properties. We detect the low level diffuse emission between galaxies, which is most likely due to the presence of the intergalactic medium. Compared to other spiral–only groups, SCG0018-4854 could be the coolest system detected so far, although the measurements have large uncertainties. These results indicate that high quality deep X-ray observations are needed to allow a proper study of the properties of the potential well of dynamically young systems, before more general conclusions can be drawn on their average characteristics.
Key Words.:
ISM: general; X-rays: galaxies: clusters; Galaxies: ISM; X-rays: ISM1 Introduction
Compact groups (CGs) are small associations of galaxies (4-8) characterised by high over-densities (/ 80) and low velocity dispersions, in the range 13 to 617 km s-1, with a median value of 200 km s-1 (Hickson et al., 1992). It seems now well established that these structures are physically real, and that they are likely to play an important role in the environmentally driven evolution of galaxies (see e.g. Mendes de Oliveira and Hickson, 1994; Coziol & Plauchu-Frayn, 2007).
Recent optical results (Coziol et al., 2000) indicate that we observe CGs with a wide range of properties. In some of them, member galaxies show significant amounts of ionised gas in their nuclei, indicating recent star formation or low luminosity AGNs. Others are instead characterised by a low level of activity of their members, which are mainly E/S0 galaxies with old stellar populations. In a fraction of CGs an intermediate age stellar population is present in the member galaxies, consistent with a post-starburst phase.
A reasonable evolutionary sequence would see CGs evolve from dynamically young groups, expected to be dominated by a population of late-type galaxies, to more relaxed systems, dominated by an early-type galaxy population, through a multiplicity of mechanisms such as mergers of member galaxies, accretion of new gas from external reservoirs, infall of new galaxies and heating of the intra-group medium through dynamical friction and AGN feedback (Coziol et al., 2004; Gómez-Flechoso & Domínguez-Tenreiro, 2001).
Inserting this evolution in the larger picture of hierarchical structure formation theory, one would expect that CGs, being the lower mass tail of structures in the Universe, would have formed more recently than eg. massive cluster of galaxies (Coziol et al., 2004). This would be particularly true for dynamically young systems, that in the evolutionary sequence above should be at the lowest mass tail of CGs.
The observations of X-ray emission in CGs should be interpreted within this context. In the early discussions about the nature of CGs, the presence of a hot intergalactic gas in these systems was taken as evidence that these are physically bound structures with a common potential well.
The presence of hot inter galactic gas in CGs was confirmed by Ponman et al. (1996), and it was further established that its characteristics are indistinguishable from those of the more general class of groups (Helsdon & Ponman, 2000). Taken as a whole, groups form the fainter part of the X-ray luminosity function or luminosity vs. velocity dispersion relation for clusters (Ponman et al., 1996; Helsdon & Ponman, 2000; Mulchaey et al., 2003; Jeltema et al., 2006), a result fully consistent with the predictions of the hierarchical structure formation theory.
Another interesting matter concerning X-ray emission in CGs is the problem of the so called fossil groups (Ponman et al., 1994; Vikhlinin et al., 1999; Jones et al., 2003). These groups have been suggested as the possible end product of the evolution of CGs. However some observational differences between compact groups and fossil groups seem to argue against this hypothesis. Among them, a possible difference in mass range between fossil groups and compact groups, the former so far observed at the higher end of the mass distribution (1013-1014 vs 1011-1014 M☉, see, e.g. Jones et al., 2003; Hickson et al., 1992; Pompei et al., 2007), and in X-ray luminosity, where again fossil groups are observed at the bright end (L 1042 vs 1041-1042 erg s-1 Jones et al., 2003). This, however could just be more an observational bias than a real problem as systematic searches for low X-ray/mass fossil groups are still lacking. Furthermore in the hierarchical structure formation model fossil groups could be the end result of the massive groups formed at early cosmic times that coalesced in the single massive X-ray bright galaxy observed today (see eg. von Benda-Beckmann et al., 2007).
So far very little is known about the X-ray properties of spiral-only compact groups, which would presumably be at the beginning of the simple evolutionary sequence presented above. This is due to the small fraction of such systems in the best-studied catalogue of CGs by Hickson (1982) and to the difficulty in observing them to the appropriate sensitivity levels in the X-ray band. To date, a hot IGM has been detected only in a few spiral dominated groups. The only example in Hickson’s catalog is HCG 16 (Belsole et al., 2003), which is also a quite remarkably active group (Ribeiro et al., 1996). A few other cases of diffuse X-ray emission in spiral-dominated groups have also been recently reported in a higher redshift sample (Mulchaey et al., 2006).
X-ray emission in these systems can be an important probe both of the dynamical (by probing the system’s potential), and activity stage (by completing the information on galaxy activity) of the group itself. Can we distinguish between young and evolved CGs based on their X-ray emission? In particular, what is the origin of the intergalactic gas in CGs? According to the hierarchical structures formation model we would expect recently formed CGs to be relatively poor in hot gas, due to their smaller potential wells.
In this paper we present the hot diffuse component and the high energy properties of one such group, SCG0018-4854, selected from the sample of Southern Compact Groups (SCGs, Iovino, 2000; Iovino et al., 2003). The SCGs is a highly complete sample of CGs, selected in an automated fashion from a galaxy catalog obtained from UKST digitised blue plates. Follow-up spectroscopic observations of the brightest candidates (with a blue magnitude of the brightest galaxy of ) have confirmed the CG structure, with three or more concordant member redshifts, for 49 of the 60 pre-selected candidates. Preliminary studies of the atomic gas content of these systems have just begun with a pilot sample of six (Pompei et al., 2007).
SCG0018-4854 is a beautiful tight quartet of galaxies, already listed in the Rose compilation of CGs as Rose34 (Rose, 1977). It is located at a recession velocity of km/sec and consists of four galaxies (NGC 88, NGC 89, NGC 87 and NGC 92) in an extremely tight configuration on the sky: all within a circle of radius of 16. A possible fifth member (ESO 194-G 013) is at a larger projected distance of (at the distance of the group kpc). The velocity dispersion of only 120 km s-1 is very low, albeit with a large associated uncertainty because it is derived from only five individual redshift measurements. All members of the tight quartet exhibit a disturbed morphology, including a spectacular extended tidal tail of the brightest galaxy (NCG 92, see also Temporin et al., 2005; Pompei et al., 2007).
All these observational properties support that SCG0018-4854 is one good example of a “dynamically young” CG and, as such, a particularly interesting target for the XMM-Newton observations presented here.
We adopt = 70 km s-1 Mpc-1 throughout.
2 Observation and Data Reduction
| Observation | Original Exp. Time (ks) | Cleaned Exp. Time (ks) | RA† | DEC† | ||||
| Id | EPIC-pn/MOS1/MOS2 | EPIC-pn/MOS1/MOS2 | J2000 | |||||
| 0152330101 | 35.3 | 39.2 | 39.3 | 16.7 | 29.9 | 29.9 | 00h21 | -48°38 |
† Position of the target
We obtained a ks XMM-Newton (Jansen et al., 2001) observation of SGC0018-4845 with EPIC with its medium filter in December 2002 (see Table 1). We used the XMM-Newton Science Analysis System (SAS, version ) to update the event files with the newest calibration and to clean it from flaring events (see the science threads at http://xmm.vilspa.esa.es). A significant increase of the background is observed towards the end of the observation, that had to be excluded from the analysis. Additional flaring episodes are observed throughout the observation. Cleaning the data from all high background episodes reduces the net observing time to ks for EPIC-pn and EPIC-MOS, respectively. We retain single, double and quadruple events for the morphological analysis, and for the MOS spectral data. For the spectral analysis of the EPIC-pn data we only consider single and double events. We also use both CIAO (http://cxc.harvard.edu/ciao/) and DS9-Funtools (http://head-cfa.harvard.edu/RD) astronomical software to analyse the data and present results.
To improve the photon statistics we have summed all EPIC-MOS data for the spatial analysis. The EPIC-pn data are kept separate to avoid artifacts that could be introduced by the different patterns in the CCD-gaps in the two sets of instruments. The areas of the CCD gaps are excluded from the following analysis.
2.1 X-ray maps
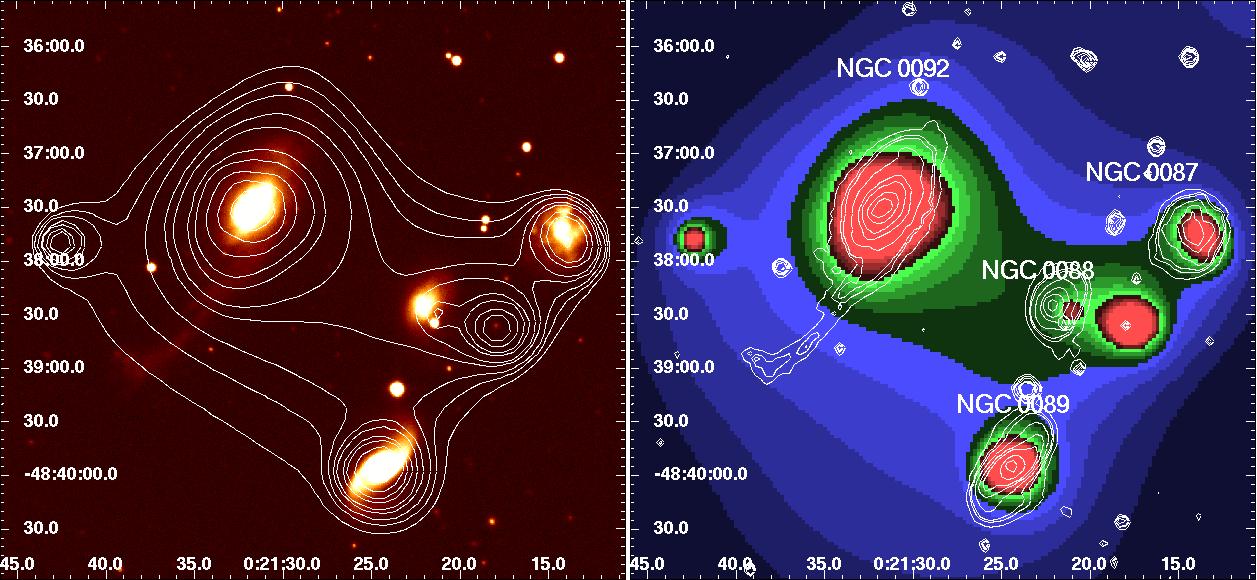
To better visualise the X-ray emission from SCG0018-4854 we have smoothed the data with an adaptive smoothing algorithm. We show the isointensity contours derived from the adaptively smoothed EPIC-MOS data in the 0.3-2.0 keV energy range superposed onto a V-band image in Fig. 1, together with the smoothed X-ray map with the contours indicating the optical sources in the field.
It is evident that most of the emission arises from individual sources, but some low surface brightness diffuse emission is also present between the galaxies.
All members of SCG0018-4854 are detected: NGC 87, NGC 89, NGC 92 are clearly visible in Fig. 1. A source coincident with NGC 88 is also detected, although it is less clearly visible due to a very close brighter source to the W, coincident with a faint optical source, most likely a background object. ESO 194-G 013 also coincides with a source in the EPIC-pn and EPIC-MOS2, very close to the edge of the field (not covered by Fig. 1). The source to the E of NGC 92 is most likely another background object, barely visible on the UK Schmidt Telescope data.
The space between the galaxies appears to be filled with genuine emission, as will be quantified later, which we interpret as due to a hot intergalactic medium (IGM).
2.2 The extended diffuse component
To quantify the amount and distribution of this diffuse X-ray component, the determination of the background shape and level is important, in particular considering that we want to measure a very low surface brightness emission. Two methods of determining the background were tested, using the “blank sky” data available online vs. using a local background from our data. After careful consideration (see below), we resolve to use a local determination of the background, while using some information from the blank sky field to make some required adjustments to the surface brightness levels.
The medium filter event files for the “blank sky” data available online111at http://xmm.vilspa.esa.es/external/xmm_sw_cal/back- ground/blank_sky.shtml or kindly provided by A. Read and J. Carter, that constitute and improved version of the on line data with a smaller residual at the centre (see Carter & Read, 2007, for a comprehensive discussion on the characteristics and preparation of the files) have been cleaned from the high background episodes in a manner consistent with the SCG0018-4854 data and the files have been rotated to the same angle as our observation with the 222see http://www.sr.bham.ac.uk/xmm2/scripts.html program.
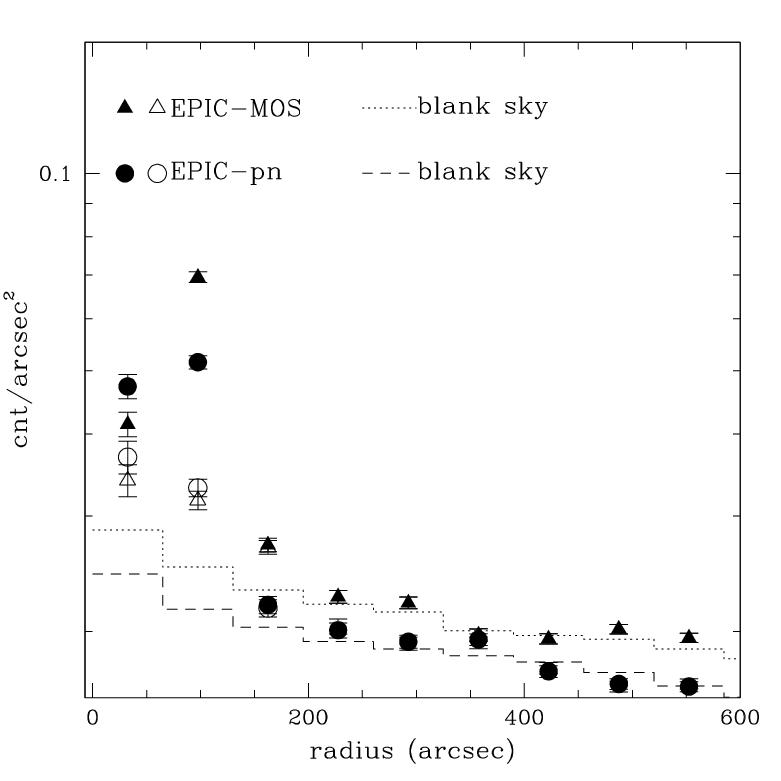
Fig. 2 shows the comparison between the azimuthally averaged radial profile obtained from our observation of SCG0018-4854 and from the blank sky data, normalised to the SCG0018-4854 profile at large radii (note that the normalisation is consistent within 10% with the ratio of the exposure times). We show both the full profile, inclusive of all sources (with filled symbols), and the profile of the “residual” emission, where all detected sources have been masked out, with the regions shown in Fig. 3. We use the 0.3-2.0 keV band to maximise the relative contribution to the total emission of the soft component, while retaining a wide-enough band to include also the harder components. The centre of the profile is at 00h21, -48°38, in the central area between the 4 galaxies of the group. The good agreement between the data and the blank sky profile shapes at radii larger than suggests that these could be used to estimate the background in the central area of the group, and indicate a significant excess emission at least out to .
However, an analysis performed over narrower energy bins indicates that the normalisation of the two sets is different at different energies, requiring a correction of up to 17% to raise the background to the observed value at energies below 2 keV, and 6% to lower it for energies above 2 keV, relative to the average value for the 0.5-2.0 keV band. This is most likely a consequence of the difference in the spectral shape of the blank sky relative to our field background that converts into slightly different normalisations in different bands (see also Carter & Read, 2007, and references therein).
Since it appears that outside a radius of the spatial shape of the emission is entirely consistent with the rescaled blank fields, and that the shapes of the blank sky profiles are virtually the same at all energies below keV, we conclude that a local determination of the background is possible, provided the blank sky spatial profile is used to rescale it to the appropriate level at the source area, which is what we have done.
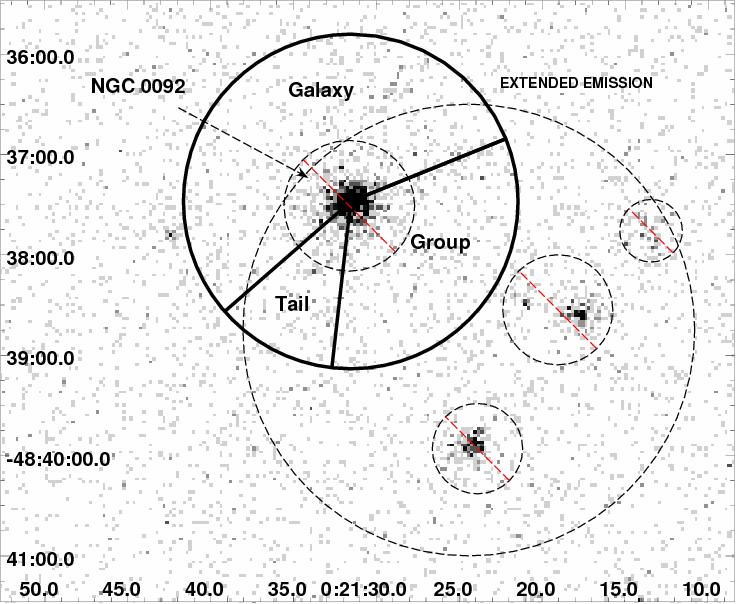
The net profile from the diffuse emission in SCG0018-4854 is shown in Fig. 4, where all detected discrete sources have been excluded. Emission is clearly visible out to a radius of , with a total of net EPIC-pn counts. Since all detected sources have been masked out, we expect that the excess is truly from emission other than from the individual galaxies: photons in the wings of the Point Spread Function (PSF) due to the sources detected individually can account only for a fraction of the diffuse emission. Given that the masking regions (circles of r, depending on the source strength and the presence of more than one source in a small region, see Fig. 3) contain 70-80% of the emission of the point sources (see the XMM-SOC-CAL-TN-0029 and XMM-SOC-CAL-TN-0022 documents online at http://xmm.vilspa.esa.es333Belsole et al. (2003) have shown that extended sources like galaxies can be treated as point sources with little loss of accuracy for this purpose), we estimate that 20% of the counts in the extended component could be contributed from the individual sources detected.
2.3 The tail of NGC 92
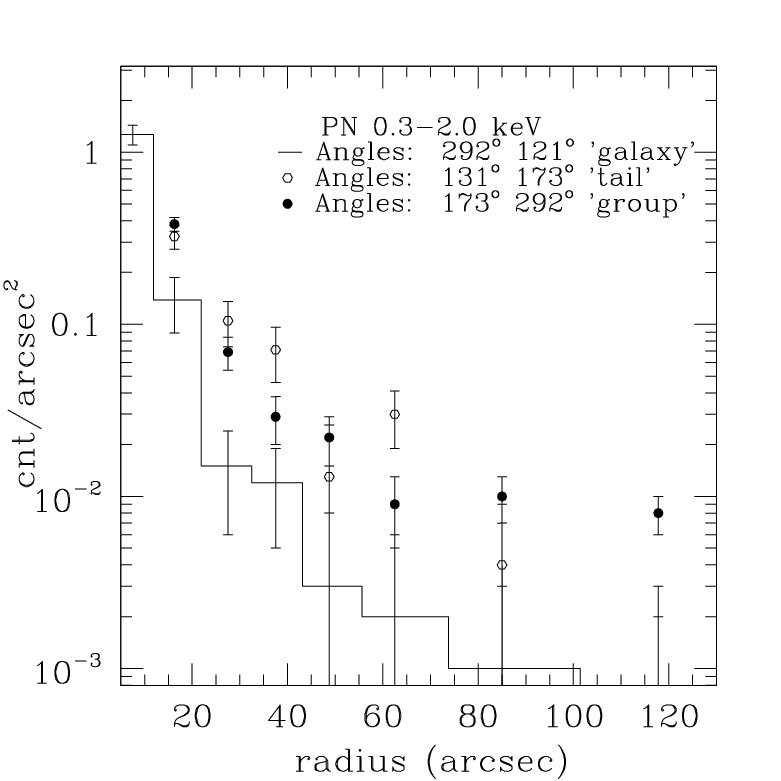
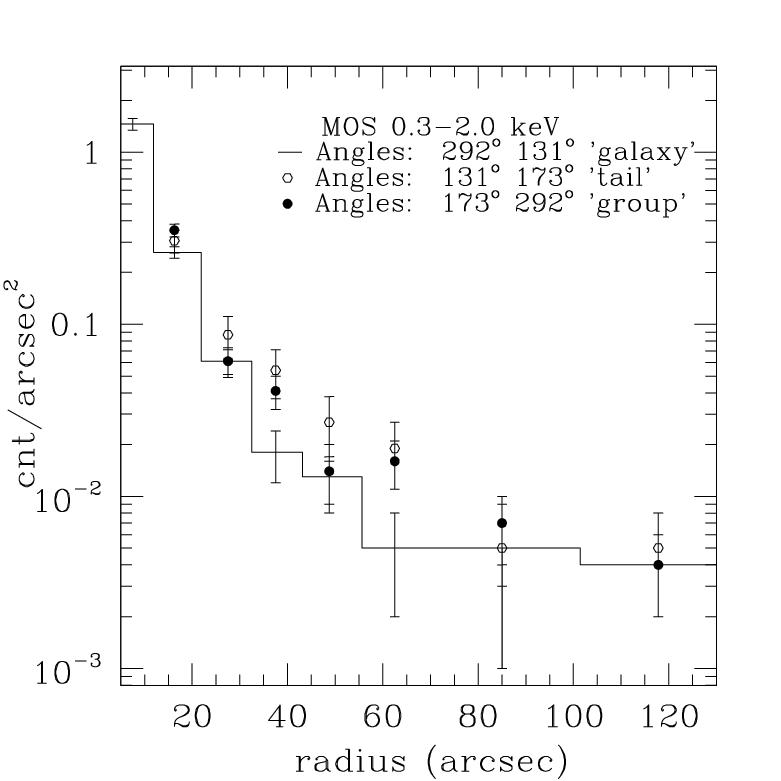
A rather unexpected feature can be observed in the raw data as an excess to the SSE of this galaxy. The statistical significance of the excess emission is limited by the poor photon statistics and cannot be seen as a separate feature in the iso-intensity contours of Fig. 1, possibly because of its closeness to the relatively bright source associated with the galaxy. However, the contours centred on the galaxy are clearly elongated in this direction. The location of the feature is intriguing, since it coincides with the base of the tail to the South seen prominently in H and H i (Temporin et al., 2005; Pompei et al., 2007). Again, we make use of a radial profile plot (Fig. 5) to compare the distribution along the SSE direction and the expected distribution from the same source in the N-NE directions (see Fig. 3). There is a clear excess of emission in the SSE direction (tail) relative to the northern half (the galaxy only). This latter component can be parameterised by a combination of a central point source and a -type model ), with r and , consistent with the contribution from a nuclear source and gaseous emission from the ISM (see next section). In the tail sector instead the parametrisation requires a significantly flatter -type model with (1- confidence), indicative of a shallower radial gradient. Although the excess in this region could in part be due to the emission from the gas in the group (see above), there appears to be an excess even above this component, as shown by the comparison with the profile towards the group centre (Fig. 5) outside of radius. We can measure an excess of counts in the region in the EPIC-pn and EPIC-MOS data, respectively, relative to the model of the emission from the galaxy in the northern azimuthal sector. Assuming a plasma with kT keV (the average value in the whole galaxy, see next section), the tail could contribute L erg s-1 (0.5-2.0 keV) to the total X-ray luminosity of NGC 92.
2.4 Spectral properties of the emission
To measure the spectral properties of the emission from different sources we have extracted photons in different size regions. We have corrected for the areas lost due to CCD gaps in the EPIC-pn. We use the EPIC-MOS data when statistically significant to confirm the EPIC-pn results, or to assess the total luminosities, when the EPIC-pn gaps cover a significant fraction of the source area.
The background is in all cases taken from an annulus outside the group area, rescaled as discussed in the previous section. We have also considered the region between galaxies as background for the sources associated with the group members, and we found entirely consistent results in the derived quantities, with only a small decrease in the net count rates (%, for NGC 92 and NGC 89 respectively). We binned the data to increase the photon statistics per spectral bin to ensure that the statistics can be applied. We have used a binning based on a minimum number of counts in the total data (typically 30 counts per bin) or based on a minimum signal-to-noise ratio in the net data, depending on the observed number of photons, while at the same time ensuring that there was a reasonable number of bins for the spectral fit. The data are fitted in XSPEC (version 11.3.1) with either a plasma with low energy absorption (e.g. MEKAL) or a combination of plasma and bremsstrahlung or power law to account for high energy tails. We adopt the tables of Wilms et al. (2000) for the abundances and a Galactic value of N cm-2 (Dickey & Lockman, 1990). Quoted errors correspond to a =2.7 unless specified otherwise.
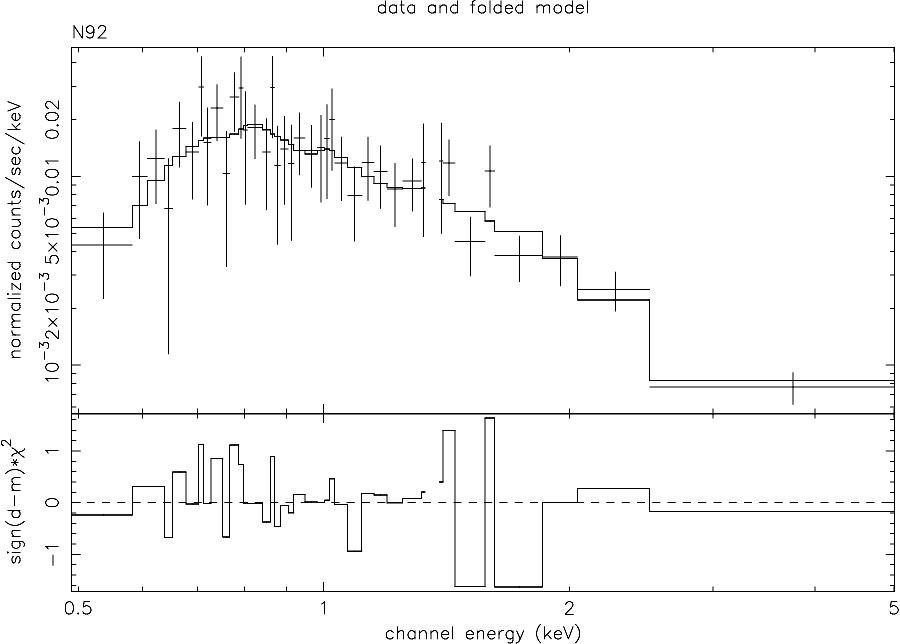
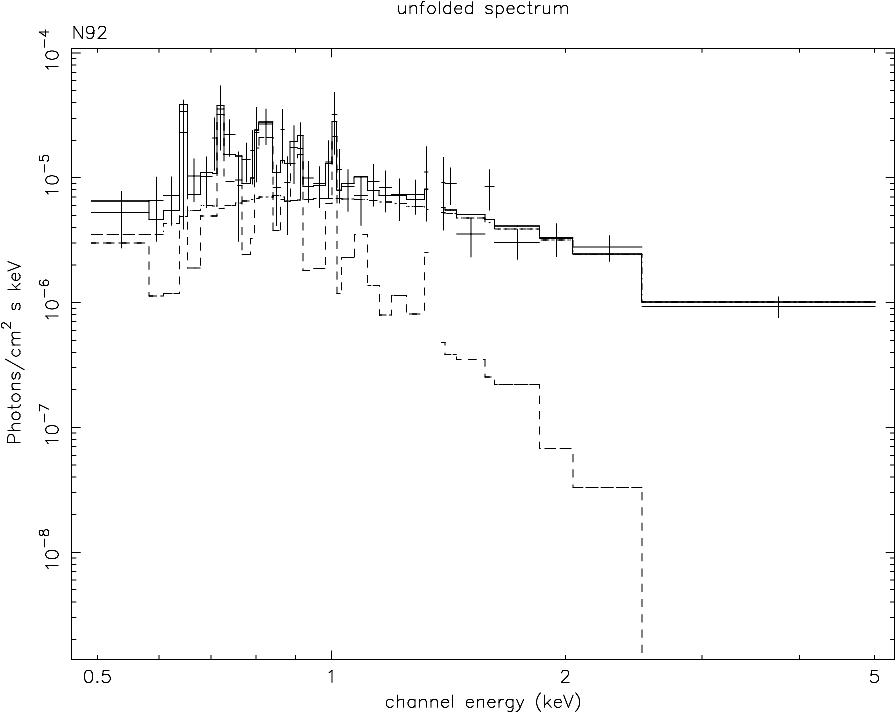
NGC 92 The X-ray spectrum of NGC 92 can be parameterised by a combination of a power law with and a solar abundance plasma with kT keV (Fig 6). A relatively large amount of low energy absorption is required, corresponding to N cm-2, consistent with the presence and amount of neutral hydrogen observed in HI emission (visible in Figure 5 in Pompei et al., 2007). The intrinsic luminosity of the power law component, L erg s-1 in the 0.5-10 keV band, points to the presence of an AGN, albeit of very low luminosity.
The absorption corrected plasma luminosity of erg s-1(0.5-2 keV, within a 30′′ radius), is relatively high for a normal spiral galaxy, but is consistent with the presence of starburst activity. Unfortunately we cannot study the spectral properties of the emission in different regions; however, given its extended nature, also testified by the fit parameters with a -model (see previous sections), we speculate that the emission is not to be attributed exclusively to the nuclear starburst region, but is most likely distributed throughout the body of the galaxy.
NGC 89 The energy distribution of the signal allows a binning of the net spectrum only at low energies, up to keV. In the 2-10 keV range, too few photons () are detected, for a meaningful spectral analysis. However, taking into account that this object has a Seyfert 2 nucleus, from the optical line ratios, we will first use the spectral data at low energies, to obtain information on the X-ray spectral properties of the object. We will then add the high energy range to obtain some information on possible nuclear emission.
A single component plasma model does not fit the data well; a single temperature bremsstrahlung or a power law model could give significantly better fits, but with unreasonable parameters (kT keV, which is also obtained with a zero abundance MEKAL model, or , respectively). We obtain a reasonable fit ( for 16-17 degrees of freedom in EPIC-pn) with a two-component model (two thin plasmas at 0.25, 1.4 keV, 50-100% solar abundance or one plasma at keV, 100% solar abundance and a power law component with fixed at 1.9).
Either models could be interpreted in the framework of the emission from spiral and starburst galaxies, resulting from to the combined contribution of a population of unresolved compact sources and a diffuse emission, most likely due to a hot phase of the ISM. The line-of-sight absorption is always consistent with the Galactic value. The unabsorbed total flux from this object is f erg cm-2 s-1, which corresponds to a total intrinsic luminosity of L erg s-1(0.5-2.0 keV), with a contribution of 1/3 from the softer (plasma) component and 2/3 arising from the harder (higher temperature/power law) component, respectively.
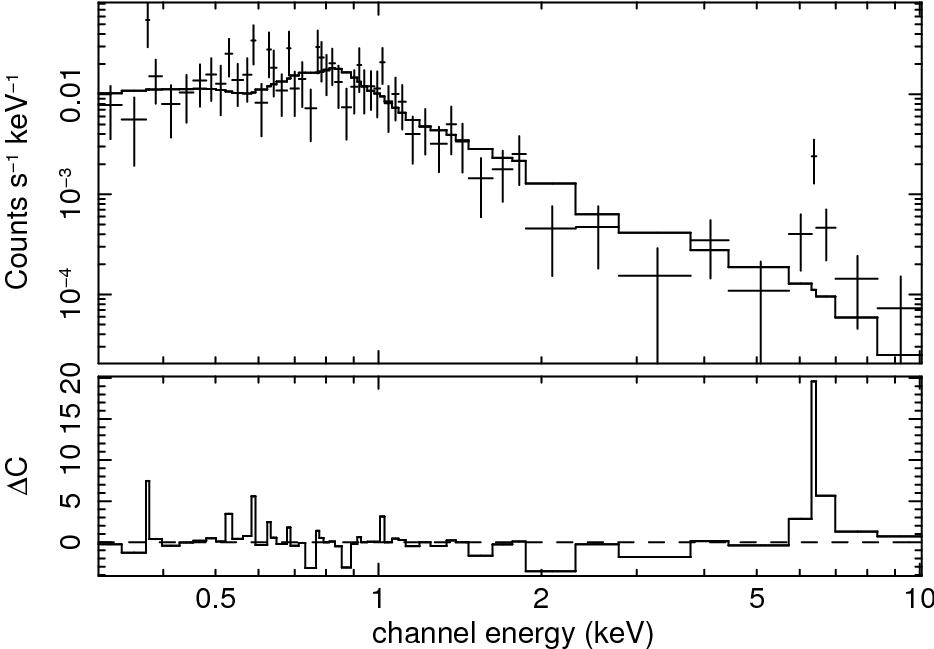
The power law component could however also be interpreted as due to a central AGN, visible in the optical data. However, its intrinsic luminosity would only be Lerg s-1(2.0-10 keV), indicative of a very faint AGN, unless it were interpreted as the scattered component of a heavily obscured object. Optical line emission ratios indicate a Seyfert 2 nucleus in NGC 89, so the presence of an absorbed central source is quite plausible. This interpretation is supported by the evidence of an excess at the expected position of the Fe line. Given the low statistics in the high energy bins, we have neglected to take into account the significance of individual bins, and simply rebinned the data in such a way that no bin contains a “negative” signal. The resulting spectrum, shown in Fig.7, is then compared with an absorbed AGN model, in addition to a plasma component to account for the low energy emission. To account for the small number of counts in each bin we have used the C statistic (Cash, 1979). An excess of counts is evident at the Fe line energies. If we assume a typical absorbed AGN spectrum, the data are consistent with an intrinsic luminosity of a few erg s-1, and an absorption greater than a few cm-2. The excess at keV is at a % significance from the C statistics (C=20), and it is consistent with the expected narrow 6.4 keV Fe line emission seen in local Seyfert galaxies (e.g. see Nandra et al., 2007).
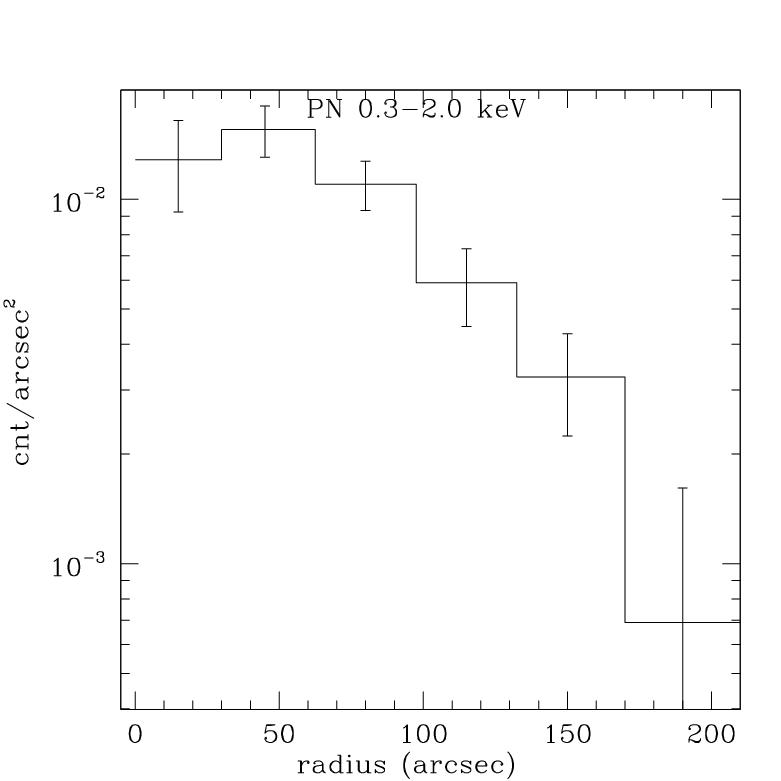
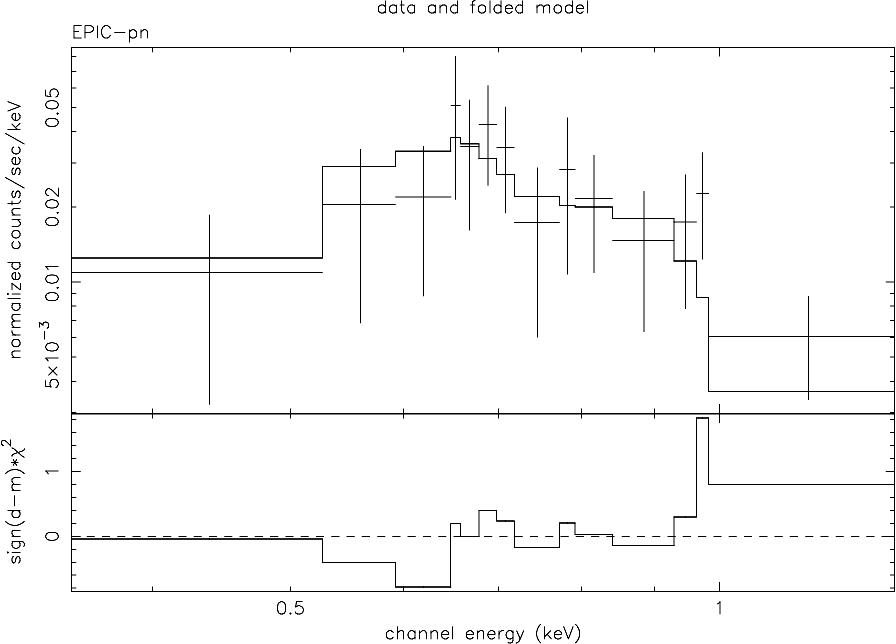
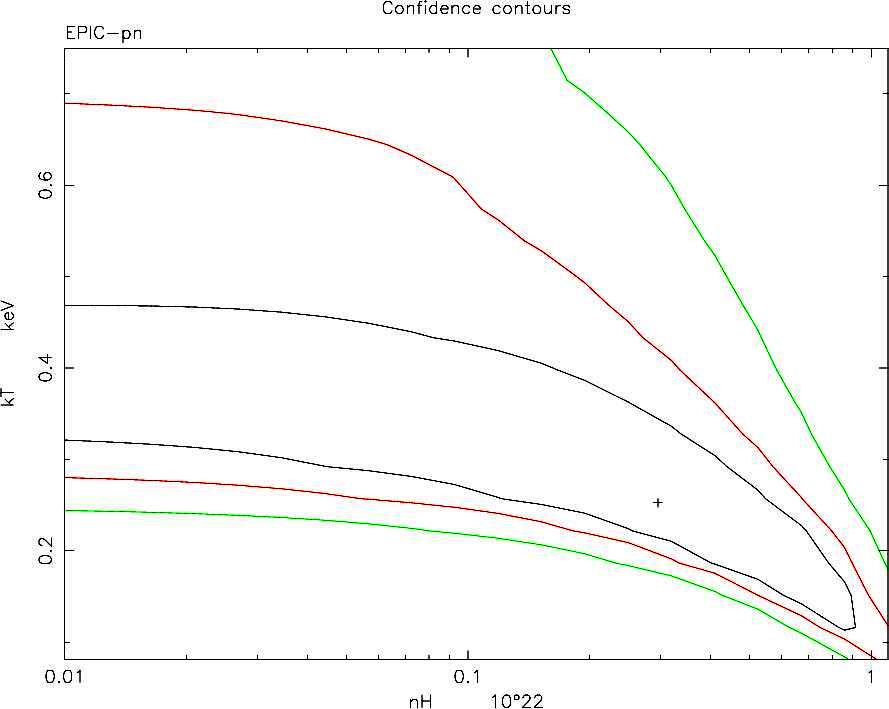
Extended intra-group emission EPIC-pn data have been extracted from a region of , excluding the CCD gaps and all detected discrete sources (the 4 galaxies and the source W of NGC 88, see Fig. 3). The background is rescaled by % to take into account the effect of vignetting, as explained in previous sections. The data are unfortunately of low signal-to-noise, so the results are highly uncertain, which reflects also on the derived quantities (Fig 8). If we assume a plasma model (MEKAL) with abundances fixed at 30% cosmic, we derive a temperature of 0.2 ([0.1-0.5] keV, see Fig. 8, right panel) and a higher than Galactic line-of-sight absorption, N cm-2. This converts into an emitted flux f erg cm-2 s-1, in the 0.5-2.0 keV band, strongly dependent on the exact values of NH and kT assumed. If we take into account the area lost due to the CCD gaps and the sources excluded from the analysis, the extended component flux should be raised by %, assuming a flat surface brightness distribution in the area. Therefore the total intrinsic luminosity of this component is of the order of erg s-1 for the stated best fit parameters.
Point source West of NGC 88. The data can be fitted with a power law with [1.4-2.0] with mild absorption N cm-2, for an unabsorbed flux of erg cm-2 s-1in the 0.5-2.0 and 2.0-10.0 keV range respectively. This would imply a luminosity of erg s-1(0.5-10.0 keV), if the source were at the distance of the group. While this would be consistent with an ultra luminous source in NGC 88, its coincidence with a faint optical counterpart makes it more likely to be a background source.
3 The X-ray picture
The sensitivity achieved with the XMM-Newton observation has provided firm evidence of a hot intergalactic medium in which galaxies are embedded in the spiral-only, dynamically young system SCG0018-4854, analogous to what has been known to permeate more evolved systems. With these data we have detected and characterised the emission from the member galaxies (most clearly from a, b, and c, or NGC 92, NGC 89 and NGC 87 respectively) and from a diffuse component, and have investigated the spatial distribution and the spectral features for the galaxies and for the intergalactic medium in some detail.
3.1 Individual galaxies
All galaxies of the group are detected, at a level comparable to other systems of the same optical characteristics, both in the field and in groups (see Helsdon et al., 2001). When measured, the spectral properties are consistent with a contribution from a hot thin plasma and unresolved X-ray binaries, typical of the emission of late type galaxies with elevated star formation activity.
For NGC 87 and NGC 88 and ESO 194-G 013, not detected with enough counts for a proper spectral analysis, we derive a luminosity L erg s-1 from a simple rescaling from net counts into fluxes and luminosities, assuming a power law model with .
NGC 89 has a higher luminosity, L erg s-1, in the 0.5-2.0 keV band, consistent with the combination of a hot ISM at 0.4 keV and the unresolved contribution of binary systems. In spite of the very low statistics at higher energies, the data are consistent with the presence of a heavily absorbed (N cm-2) AGN, of intrinsic L erg s-1(2-10 keV). The evidence for such a component is given by an excess of counts at the expected position of a Fe line. The equivalent width of the Fe line would be of several keV (poorly measured) against the very weak hard X-ray continuum that we can infer for NGC 89, but would be a few tens of eV against an AGN with an unabsorbed luminosity of a few erg s-1, i.e. consistent with the narrow iron lines seen in local Seyferts (i.e. Nandra et al., 2007). Moreover the energy of the line is formally consistent with 6.4 keV (6.460.08 keV), as would be expected from neutral Compton reflection. This is in excellent agreement with the optical evidence of a Seyfert 2 nucleus, although the maximum luminosity allowed by the data, for a reasonable set of parameters for the AGN spectrum, is significantly lower than predicted for example on the basis of the observed [OIII] line (see, e.g., the NGC 1068 example by Colbert et al., 2002), but in line with the scatter observed for local AGNs (see Heckman et al., 2005; Panessa et al., 2006). Interestingly, this is the only member of SCG0018-4854 without trace of H i gas (Pompei et al., 2007).
NGC 92 is the brightest of the galaxies, with a total luminosity L erg s-1, in a hot plasma component. A mildly absorbed, low luminosity (L erg s-1) nuclear source is also inferred from the morphology and spectrum. A population of binary sources, which must also be present, cannot be detected separately from the central “AGN-like” component. A central radio continuum source is also detected in this galaxy (P W Hz-1, Pompei et al., 2007), which so far has been associated with starburst activity. At the present time there is no measure of the compactness of the source nor good spectral index information, to help understand whether the radio source could be associated with the possible central AGN.
For both galaxies, the luminosity measured in the “plasma” component is higher than what is predicted by the emissivity of the old stellar population, and should therefore most likely be a truly hot ISM component (see Revnivtsev et al., 2007).
The global star formation rate measured for NGC 92 is 14.7 M⊙ yr-1 (Pompei et al., 2007), which is significantly higher than that of other starforming galaxies like M82, NGC1482 or NGC3079 ( M⊙ yr-1 Strickland et al., 2004), although the total luminosity in the diffuse X-ray emission is lower. If we use the spectral results and attribute the emission modelled with a plasma spectrum to a hot ISM, we can derive an average gas density of n cm-3 and a total mass of M M⊙ in the hot phase, under a simple assumption of a spherical distribution within r kpc. This is lower than what is detected in the neutral cold phase (H i Pompei et al., 2007), but relatively high with respect to the hot ISM detected in the disk and halos of star-forming late type galaxies (Tüllmann et al., 2006) and comparable to the amount of hot gas detected in HCG80a (Ota et al., 2004).
A peculiar extension to the SE of NGC 92 coincident with a tidal feature observed in H i and H is also detected. While current data do not allow us to properly separate it from the emission of the galaxy, its existence is clearly shown in the elongation of the isointensity contours in the soft energy map and in the significantly flatter -model required to fit the radial profile in the SSE direction. As will be discussed later, the formation of the X-ray tail is unlikely of stripping origin. Most likely, the tail is the result of tidal forces acting on NGC92 have been efficient in dislocating the H i gas; in situ star formation, which produces the spectacular H i i regions and H emission observed in the tail, can also produce X-ray emitting sources (gas and/or binaries).
3.2 The hot IGM
SCG0018-4854 has a very tight configuration and optical studies already support the hypothesis that it is a truly bound system. In fact the four galaxies of the group occupy an extremely small region in space, all being located within a circle on the sky of 25 kpc. Assuming that this dimension is indicative of the true physical radius of the group, the density within the group obtained is a record one also for such tight configuration systems, at log, (see Pompei et al., 2007). Also the line of sight velocity dispersion of the group is very low, amounting to only 120 km s-1, although the number is highly uncertain due to the paucity of the velocity space sampled [but typical of these groups]. As a further indication of the high density of this system and of the high level of interaction among members, all four group members have a disturbed optical morphology, and a very peculiar H i distribution mostly dislocated with respect to the bulk of the stars (NGC 89 is in fact completely stripped of gas, Pompei et al., 2007).
With these XMM-Newton observations we have detected extended X-ray emission at the centre of the group, in a region of 35 kpc radius. We cannot study the morphology of such component in detail, due to the very limited statistics of the detection; however, we can exclude that the emission is the result of the combined emission from the individual members, and we claim it is a genuine detection of a hot IGM at a level of erg s-1.
To characterise the gas, we have assumed ionisation equilibrium and 30% cosmic abundances, and we derive a relatively low temperature of kT keV. This is the usual approximation, in spite of the fact that the system is most likely not in a stable configuration, also given the optical evidence of interactions among group members. However, with current statistics, it would be unrealistic to attempt more complex modelling of the data. This result makes this group the coolest detected so far, even among the few spiral only groups studied in the X-ray band.
In this model, assuming that the emission is distributed in a sphere with radius (33 kpc), and correcting for the area lost due to the sources excluded from the analysis, the mean density and total gas mass are n5 cm-3 and M 2 M☉ respectively, estimated from the emission measure obtained from the spectral results. At the centre, within 20 kpc, where the radial profile is consistent with a constant distribution, the gas density increases to 0.01 cm-3 with a cooling time yr.
The total amount of hot material is significantly lower than observed in more typical groups (e.g. Mulchaey, 2000), but comparable to the gas masses derived for low velocity dispersion groups by Helsdon et al. (2005, a few M☉ within comparable radii). The inferred temperature is also significantly lower than those measured in more evolved groups (1-2 keV); unfortunately at these low temperatures the L and LT relations for groups and clusters have a significant scatter, so consistency with such relation is of little significance; however, it appears that this group has a higher than expected X-ray luminosity for its measured temperature and for its value relative to the extrapolation from the cluster relation (see Helsdon et al., 2005).
Given the low velocity dispersion of the group ( km s-1 Pompei et al., 2007), the gas density calculated is not enough to explain the formation of the HI tail in N92 with ram pressure stripping. Using typical values for the cold ISM content in a galaxy and (where , , and are the mean ICM density, the velocity of the galaxy relative to the ICM, the surface density of the galaxy’s ISM, and the minimum stripping radius of the galaxy, respectively, see Trinchieri et al., 2007), the observed quantities for and vgal imply cm, kpc, well outside the galaxy boundaries. For stripping to be efficient, the transverse velocity should be an unlikely factor at least 6-7 larger than the observed velocity dispersion of the group.
3.3 SCG0018-4854 in context
Very few dynamically young, spiral dominated systems like SCG0018-4854 have been observed in X rays and even fewer have a measured IGM. No IGM was detected in the groups with a spiral fraction of in the Mulchaey et al. (2003) atlas, while only a few in the groups studied as part of the GEMS project (Osmond & Ponman, 2004) have been classified as having a group-scale diffuse emission (e.g. kpc in radius), both based on lower resolution ROSAT data. In HCG 16, one of the first such groups well studied and much discussed in the literature, gas was unambiguously detected only recently with XMM-Newton (Belsole et al., 2003), at a level of erg s-1.
HCG 16 is in many respects very similar to SCG0018-4854: it is composed of 4 luminous late type galaxies in a small area (median projected galaxy-galaxy separation of kpc h Hickson et al., 1992), with evident signs of activity in their nuclei, and a velocity dispersion of km s-1. The X-ray properties appear also very similar: all 4 galaxies are detected as individual sources (both due to the AGN and starburst activity) already by the ROSAT satellite (Saracco & Ciliegi, 1995; Ponman et al., 1996; Dos Santos & Mamon, 1999), while the diffuse emission recently characterised with XMM-Newton has a comparable luminosity but slightly higher best fit temperature ( keV, although within the uncertainties; note that the ROSAT data suggested a cooler temperature of 0.27 keV Dos Santos & Mamon, 1999) than SCG0018-4854. Only two other systems, with a spiral fraction of , have been studied with Chandra or XMM-Newton: HCG 80 (Ota et al., 2004) was not detected by Chandra, with an estimated limit to the luminosity of the diffuse component at L erg s-1, in spite of the larger velocity dispersion ( km s-1) of the system; low level diffuse emission is measured in recent XMM-Newton images of the Cartwheel, again at similar luminosities and gas temperatures (Crivellari et al., in preparation).
Our results seem to suggest that, to obtain a more significant hot IGM component, we need groups with a somewhat lower spiral fraction and/or in a more evolved stage of evolution, so that they have had time to accumulate a more significant amount of hot IGM and/or the interaction among members has already been able to heat it to higher temperatures. Some of the famous examples include HCG92-Stephan’s Quintet (Trinchieri et al., 2003, 2005); HCG 90 (White et al., 2003); and an earlier ASCA detection of diffuse emission in HCG 57 (Fukazawa et al., 2002), all characterised by a hotter IGM (kT keV), a spiral fraction of , relatively complex morphologies and somewhat higher luminosities.
4 Conclusions
The detection of diffuse emission from SCG0018-4854 indicates that this system contains a hot intergalactic gas with a mass of 1% the mass measured in galaxies. The amount and temperature of the gas are about one order of magnitude lower than in more evolved groups, where the gas is usually peaked onto the brightest (early-type) member, at temperatures of 1-2 keV, and has a significantly larger extent. The temperature is broadly consistent with what is expected from gas in equilibrium in the potential defined by the measured velocity dispersion of the group. Although at lower levels than in other systems, the evidence of such a component in this group is important because it can be used as additional evidence that a) the galaxies are physically related in a bound system, and b) the IGM can be a source of disturbance and participate in the production of distortions/tails observed in the galaxies, even though it alone cannot explain the production of e.g. the tail of NGC 92. It is worth mentioning that the characteristics of the hot gas detected in SCG0018-4854 are comparable to the values derived for our own Local Group from indirect measures (absorption features in the spectra of background sources): T K, N cm-3, and a scale of kpc (Rasmussen et al., 2003).
A larger sample of objects however still needs to be sampled at the proper sensitivity to provide the missing evidence of whether these are special cases or all spiral dominated systems have a hot, though cool and weak, IGM.
Acknowledgements.
This research has made use of SAOImage DS9, developed by Smithsonian Astrophysical Observatory and of the NASA/IPAC Extragalactic Database (NED) which is operated by the Jet Propulsion Laboratory, California Institute of Technology, under contract with the National Aeronautics and Space Administration. Both Ciao and XMM-SAS softwares have been used to reduce the data. This publication makes use of data products from the Two Micron All Sky Survey, which is a joint project of the University of Massachusetts and the Infrared Processing and Analysis Center/California Institute of Technology, funded by the National Aeronautics and Space Administration and the National Science Foundation. AI, GT and ST acknowledge partial financial support from the Agenzia Spaziale Italiana under contract ASI-INAF I/023/05/0.References
- Belsole et al. (2003) Belsole, E., Sauvageot, J.-L., Ponman, T. J., & Bourdin, H. 2003, A&A, 398, 1
- Barnes (1985) Barnes, J. 1985, MNRAS, 215, 517
- Barnes (1989) Barnes, J. E. 1989, Nature, 338, 123
- von Benda-Beckmann et al. (2007) von Benda-Beckmann, A.M. et al. 2007, astroph-0710.1297
- Bode et al. (1993) Bode, P. W., Cohn, H. N., & Lugger, P. M. 1993, ApJ, 416, 17
- Carter & Read (2007) Carter, J. A., & Read, A. M. 2007, A&A, 464, 1155
- Cash (1979) Cash, W., 1979, ApJ, 228, 939.
- Colbert et al. (2002) Colbert, E. J. M., Weaver, K. A., Krolik, J. H., Mulchaey, J. S., & Mushotzky, R. F. 2002, ApJ, 581, 182
- Coziol et al. (2000) Coziol, R., Iovino, A., & de Carvalho, R. R. 2000, AJ, 120, 47
- Coziol et al. (2004) Coziol, R., Brinks, E., & Bravo-Alfaro, H. 2004, AJ, 128, 68
- Coziol & Plauchu-Frayn (2007) Coziol, R., & Plauchu-Frayn, I. 2007, AJ, 133, 2630
- Da Rocha and Mendes de Oliveira (2005) Da Rocha, C. & Mendes de Oliveira, C. 2005, MNRAS, 364, 1069
- Dickey & Lockman (1990) Dickey, John M. & Lockman, Felix J., 1990, ARA&A 28, 215.
- Dos Santos & Mamon (1999) Dos Santos, S., & Mamon, G. A. 1999, A&A, 352, 1
- Fukazawa et al. (2002) Fukazawa, Y., Kawano, N., Ohta, A., & Mizusawa, H. 2002, PASJ, 54, 527
- Gómez-Flechoso & Domínguez-Tenreiro (2001) Gómez-Flechoso, M. A., & Domínguez-Tenreiro, R. 2001, ApJ, 549, L187
- Heckman et al. (2005) Heckman, T. M., Ptak, A., Hornschemeier, A., & Kauffmann, G. 2005, ApJ, 634, 161
- Helsdon & Ponman (2000)
- Helsdon et al. (2001) Helsdon S.F., Ponman T.J., O’Sullivan, E., Forbes, D.A, 2001, MNRAS, 325, 693
- Helsdon et al. (2005) Helsdon S.F., Ponman T.J., Mulchaey, J.S., 2005
- Hickson (1982) Hickson, P. 1982, ApJ, 255, 382
- Hickson et al. (1992) Hickson, P., Mendes de Oliveira, C., Huchra, J. P., & Palumbo, G. G. 1992, ApJ, 399, 353
- Iovino (2000) Iovino, A. 2000, IAU Colloq. 174: Small Galaxy Groups, 209, 25
- Iovino et al. (2003) Iovino, A., de Carvalho, R. R., Gal, R. R., Odewahn, S. C., Lopes, P. A. A., Mahabal, A., & Djorgovski, S. G. 2003, AJ, 125, 1660
- Jansen et al. (2001) Jansen, F., et al. 2001, A&A, 365, L1
- Jeltema et al. (2006) Jeltema, T. E., Mulchaey, J. S., Lubin, L. M., Rosati, P., Böhringer, H. 2006, ApJ, 649, 649
- Jones et al. (2003) Jones, L. R., Ponman, T. J., Horton, A., Babul, A., Ebeling, H., & Burke, D. J. 2003, MNRAS, 343, 627
- Mamon (1986) Mamon, G. A. 1986, ApJ, 307, 426
- Mendes de Oliveira and Hickson (1994) Mendes de Oliveira, C. & Hickson, P. 1994, ApJ, 427, 684
- Mulchaey (2000) Mulchaey J.S. 2000, ARAA, 38, 289
- Mulchaey et al. (2003) Mulchaey, J. S., Davis, D. S., Mushotzky, R. F., Burstein, D., 2003, ApJS, 145, 39
- Mulchaey et al. (2006) Mulchaey, J. S., Lubin, L. M., Fassnacht, C., Rosati, P., & Jeltema, T. E. 2006, ApJ, 646, 133
- Nandra et al. (2007) Nandra, K., O’Neill, P. M., George, I. M., & Reeves, J. N. 2007, MNRAS, 382, 194
- Osmond & Ponman (2004) Osmond, J.P.F. & Ponman, T.J. 2004 2004 MNRAS, 350, 1511
- Ota et al. (2004) Ota, N., Morita, U., Kitayama, T., Ohashi, T. 2004, PASJ 56, 753
- Panessa et al. (2006) Panessa, F., Bassani, L., Cappi, M., Dadina, M., Barcons, X., Carrera, F. J., Ho, L. C., & Iwasawa, K. 2006, A&A, 455, 173
- Pompei et al. (2007) Pompei, E., Dahlem, M., & Iovino, A. 2007, A&A, 473, 399
- Ponman et al. (1994) Ponman, T. J., Allen, D. J., Jones, L. R., Merrifield, M., McHardy, I. M., Lehto, H. J., & Luppino, G. A. 1994, Nature, 369, 462
- Ponman et al. (1996) Ponman, T. J., Bourner, P. D. J., Ebeling, H., & Bohringer, H. 1996, MNRAS, 283, 690
- Rasmussen et al. (2003) Rasmussen, A., Kahn, S. M., & Paerels, F. 2003, in The IGM/Galaxy Connection, ed. J. L. Rosenberg & M. E. Putman (Dordrecht: Kluwer), 109
- Revnivtsev et al. (2007) Revnivtsev, M., Churazov, E., Sazonov, S., Forman, W., Jones, C., 2007, astrp-ph 0702578
- Ribeiro et al. (1996) Ribeiro, Andre L. B., de Carvalho, Reinaldo R., Coziol, Roger; Capelato, Hugo V., Zepf, Stephen E. 1996, ApJ, 463, L5
- Rose (1977) Rose, J. A. 1977, ApJ, 211, 311
- Saracco & Ciliegi (1995) Saracco, P., & Ciliegi, P. 1995, A&A, 301, 348
- Skrutskie et al. (2006) Skrutskie, M. F., et al. 2006, AJ, 131, 1163
- Strickland et al. (2004) Strickland, D. K., Heckman, T. M., Colbert, E. J. M., Hoopes, C. G., & Weaver, K. A. 2004, ApJS, 151, 193
- Temporin et al. (2005) Temporin, S., Ciroi, S., Iovino, A., Pompei, E., Radovich, M., & Rafanelli, P. 2005, Starbursts: From 30 Doradus to Lyman Break Galaxies, Ap&SS Lib. 329, 78
- Trinchieri et al. (2003) Trinchieri, G., Sulentic, J., Breitschwerdt, D., & Pietsch, W. 2003, A&A, 401,
- Trinchieri et al. (2005) Trinchieri, G., Sulentic, J., Pietsch, W., & Breitschwerdt, D. 2005, A&A, 444, 697
- Trinchieri et al. (2007) Trinchieri, G., Breitschwerdt, D., Pietsch, W., Sulentic, J., & Wolter, A. 2007, A&A, 463, 153
- Tüllmann et al. (2006) Tüllmann, R., Pietsch, W., Rossa, J., Breitschwerdt, D., & Dettmar, R.-J. 2006, A&A, 448, 43
- Turner et al. (2001) Turner, M. J. L., et al. 2001, A&A, 365, L27
- Verdes-Montenegro et al. (1998) Verdes-Montenegro, L., Yun, M. S., Perea, J., Del Olmo, A., Ho, P. T. P. 1998, ApJ, 497, 89
- Verdes-Montenegro et al. (2001) Verdes-Montenegro, L., Yun, M. S., Williams, B. A., Huchtmeier, W. K., Del Olmo, A., Perea, J. 2001, A&A, 377, 812
- Vikhlinin et al. (1999) Vikhlinin, A., McNamara, B. R., Hornstrup, A., Quintana, H., Forman, W., Jones, C., & Way, M., 1999, ApJ, 520, L1
- White et al. (2003) White, P. M., Bothun, G., Guerrero, M. A., West, M. J., & Barkhouse, W. A. 2003, ApJ, 585, 739
- Wilms et al. (2000) Wilms, J., Allen, A., & McCray, R. 2000, ApJ, 542, 914