Signals of bimodality in the fragmentation of Au quasi-projectiles
Abstract
Signals of bimodality have been investigated in experimental data of quasi-projectile decay produced in Au+Au collisions at 35 AMeV. This same data set was already shown to provide several signals characteristic of a first order, liquid-gas-like phase transition. Different event sortings proposed in the recent literature are analyzed. A sudden change in the fragmentation pattern is revealed by the distribution of the charge of the largest fragment, compatible with a bimodal behavior.
keywords:
NUCLEAR REACTIONS Au(Au,X), E = 35 AMeV , Measured fragment charge distributions , Excited quasi-projectile decay , Reweighting procedure , Deduced bimodal behavior of largest fragment chargePACS:
05.70.FhPhase transitions: general studies , 25.70.-zLow and intermediate energy heavy-ion reactions, , , , ,
1 Introduction
The existence of different phases for infinite nuclear matter is predicted by theoretical calculations since the early 80’s [1, 2, 3, 4]. Then, the possibility of observing a nuclear liquid-gas phase transition in the laboratory has been deduced from several experimental observations associated to the multi-fragmentation of finite nuclei. These observations indicate the occurrence of a change of state in finite nuclei, which is interpreted to be the finite system counterpart of a phase transition [5].
Many of these signals are qualitative, and therefore cannot give information on the detailed path (in terms of pressure, volume, temperature, isospin) followed by the system from one phase to the other. Other signals give in principle quantitative information, but can be distorted. Indeed the products of the reactions are detected asymptotically and not at the production time, and therefore they need to be corrected for secondary decay. These corrections are, at least partially, model dependent and induce systematic errors which are difficult to estimate quantitatively [6].
To overcome these difficulties, it is important to perform a systematic study of different phase transition signals. The best would be to exploit new generation 4 apparatuses, in order to be able to investigate simultaneously several signals at the same time, with the same experimental data samples, and with a complete or quasi-complete detection. Waiting for these new apparatuses, some of the signals indicating a phase transition have been obtained with measurements performed by the Multics + Miniball multi-detectors [7]. In the last few years we have investigated in detail the properties of quasi-projectiles detected in Au + Au reactions at 35 AMeV, with a fixed source charge, and at different excitation energies [8]. The following signals have been obtained:
-
1.
the average size of the heaviest fragment (tentatively associated to the order parameter) decreases for increasing excitation energy of the nuclear system [9] with a power law distribution of exponent ;
- 2.
-
3.
critical exponents have been extracted [9], close to the values expected within the liquid-gas universality class;
-
4.
the size distribution presents a scaling ”à la Fisher” [12];
- 5.
Several of these signals are consistent with the findings of other experimental collaborations with different data sets [15, 16]. In particular, the last two signals have been confirmed in central reaction measurements [6, 17, 18, 19]. Some of these behaviors were also observed in other finite physical systems undergoing a transformation interpreted as a first order phase transition, namely in the melting of atomic clusters [20] and in the fragmentation of hydrogen clusters [21].
Recently [22], a new topological observable has been proposed to recognize first order phase transitions. When a finite system undergoes such a transition, the most probable value of the order parameter changes discontinuously, while the associated distribution is bimodal close to the transition point, i.e. it shows two separate peaks, corresponding to the two different phases [23, 24]. In the case of transitions with a finite latent heat, this behavior is in agreement with the Yang-Lee theorem for the distribution of zeroes of the canonical partition sum in the complex temperature plane [25], and equivalent to the presence of a curvature anomaly in the microcanonical entropy [3, 26].
Since many different correlated observables can act as order parameters in a finite system, the task is to choose an order parameter which can be accessible to experiments [27]. This is the case for observables related to the measured charges. The Indra collaboration [28] has proposed as order parameter the variable Z, where Z1 and Z2 are the charge of the largest and the second largest fragments detected, in each event, in the decay of an excited source. An indication of a bimodal distribution was obtained for this quantity. Signals of bimodality in different observables have been obtained in experiments with different projectile-target combinations, and in different energy ranges [15, 27, 29]. Also experimental results of Aladin group [30] show a bimodal distribution of the 3-fragments difference () = Z.
In Refs. [27, 30] it has been pointed out that the variables Zsym and Z can present a spurious bimodality in small three-dimensional percolation lattices close to the percolation threshold. This behavior is due to finite size, and makes the bimodality in asymmetry variables an ambiguous signature of the transition. On the other side, the size or charge of the largest fragment have distributions which for any lattice size are consistent with the critical percolation behavior [31, 32]. These observables were then suggested as more apt to discriminate between a first order phase transition, a critical phenomenon, and a smooth cross-over, even if some ambiguities in the interpretation of this signal still exist [33, 34].
In this paper we investigate whether signals of bimodality for the charge of the largest fragment can emerge from our data.
2 The experiment
The measurements and the analysis have been extensively described elsewhere [9]. Here we recall that the measurements were performed at the K1200-NSCL Cyclotron of the Michigan State University. The Multics and Miniball arrays [7] were coupled to measure light charged particles (Z 2) and fragments (Z 3) with a geometrical acceptance of the order of 87% of 4. The events have been recorded if at least two different modules have been fired. The selection of the quasi-projectile (QP), made in Refs. [6, 8, 9, 12, 13, 17, 18], required the velocity of the largest fragment in each event to be at least 75% of the beam velocity. After a shape analysis [35], events with a total forward detected charge larger than 70% of the Au charge were considered. The complete source was obtained by doubling the forward emitted light particles, in order to minimize the contamination of particles emitted by a possible mid-velocity source. At the end of this procedure, only events with total charge within 10% of the Au charge were considered for the analysis, in order to study the decay of a well detected constant size source, in a wide range of excitation energies.

In order to visualize the source characteristics in the selected events, the fragment (Z) charge density distribution [36] is shown in Fig. 1 as a function of the fragment velocity in the QP reference frame. The ensemble averaged charge density is defined as
where is the event-by-event distribution in the velocity for the fraction of collected charge and the sum extends over all the fragments. This observable represents the distribution of the collected charge of fragments along the direction of the QP velocity. In the left panel of Fig. 1 the continuous line (full points) represents the charge density for fragments accepted for the QP, the dashed line (open squares) for fragments backward emitted in the ellipsoid reference frame. The open circles show a filtered simulation of a QT source symmetric to the QP. The consistency between these two latter curves demonstrates that a purely binary dynamics exhausts, in first approximation, the totality of the emitted fragment charge for the set of selected events. QP and QT can be easily recognized, showing that the imposed conditions are effective in selecting events where the contamination of a mid-velocity source is negligible (for more details see Refs. [6, 9]). It also appears clearly from the left panel of Fig. 1 that the velocity distance between the two sources is large enough to insure a negligeable contamination of QT decays in the reconstructed QP source.
To have a quantitative insight on this contamination we have considered the charge density distributions in different bins of excitation energy, as in Fig. 1 of [9]. For these distributions we have calculated a quantity similar to the one used to give a measurement of the discrimination in particle identification [37], the Factor of Merit (FoM). The FoM used here is , i.e. the ratio between the distance of the QP and QT average velocities over the sum of their standard deviations (assuming a gaussian behavior). In the right panel of Fig. 1 the FoM is shown, together with the evaluated contaminations of QT into the QP source (right scale). The contamination has been calculated in the hypothesis of two distributions of equal height and standard deviation, as it would be the case of an ideal detection of QP and QT for a symmetric reaction. It appears well below a few percent.
Since, however, the apparatus efficiency is lower for QT with respect to QP heavy products the height of the distribution of the QT is much lower than the one of the QP, as it is clear from the left panel of Fig. 1. If one therefore calculates the contamination with the real QP and QT distributions in all the bins of excitation energy one obtains values well below the values shown in Fig. 1. The maximal contamination, obtained for the highest excitation energy, results of the order of 0.6%.

The characteristics of the QP events have been examined by analyzing the isotropy of the fragment angular distribution in the quasi-projectile reference frame [13, 17], and by comparing the data to predictions of a statistical multifragmentation model [2]. The general conclusion is that an important degree of equilibration appears to be reached by the excited quasi-projectile sources in the whole range of excitation energies. For more details, see Refs. [6, 8, 9, 13, 17].
One of the conditions used to characterize the QP, i.e. that the velocity of the heaviest fragment is larger than 75% of the projectile velocity, in the analysis here presented has been released, in order to minimize the correlation to the variables we want to study and to allow a better comparison to the results of Ref. [28], where this condition was not imposed. In this paper we have also restricted the condition on the total forward detected charge to 80% of the Au charge, again for consistency with the choice taken in Ref. [28]. These modifications do not affect the distribution shown in Fig. 1 nor significally change the signals of phase transition. To quantify this statement, we present in Fig. 2 the power-law behavior of the average charge of the largest fragment, as a function of the excitation energy, and the normalized partial-energy fluctuations, leading to the estimate of a negative branch for the microcanonical heat capacity [13]. The power law in the Z1 distribution and the partial energy fluctuations are very little affected by the different selection conditions.
As a final remark we should stress that only a fraction of well detected peripheral collisions can be interpreted as the independent statistical decay of two isotropic sources. For instance within the Indra apparatus it has been pointed out that for 80 AMeV Au+Au collisions, these events represent about the 20% of the total number of complete events [19], and this number depends on the selection criteria adopted [38]. In our case the statistical events represent about 30% of the measured events [9]. The difference in the percentage of statistical events could also be due to the different trigger conditions of four (respectively: two) modules fired, used in Indra and in our measurements.
3 Signals of bimodality
In the liquid-gas phase transition, the largest fragment detected in each event is a natural order parameter, because of its correlation with the particle density in the grancanonical ensemble [22, 32]. The asymmetry variable Zsym proposed in Ref. [28, 39] in turn is correlated to the largest cluster size, and should bring further information on the global fragmentation pattern. This means that it should be possible to observe a bimodal distribution for the charge of the largest fragment or the asymmetry, if one considers a system close to the transition temperature.
To perform a meaningful analysis of a possible bimodal pattern in the Zsym observable, one needs to properly treat fission events. Indeed for a quasi-gold nucleus the binary fission, recognized for and values around 40 charge units, would lead to small values of Zsym, as multifragmentation events.
Fission fragments can be recognized by looking at the product of their charges, exceeding 900, and they can be either rejected as in our analyses (see Ref.[9]) or re-clusterized (as in Ref.[28]). The main effect of both choices is to eliminate a spurious peak at (Z, ).
The global distributions of Z1 and Zsym are shown in Fig. 3, for all QP events selected as explained in section 2. Because of the impact parameter geometry, this distribution is clearly dominated by peripheral collisions at low deposited energy, leading to a heavy Z residue with a large asymmetry Z.

We can however also notice the presence of another bump, corresponding to much lighter residues and much more symmetric fragmentation patterns. For this bump to be interpreted as an indication of bimodality, we should show that:
-
•
the two different decay patterns can be obtained in the de-excitation of the same source,
-
•
they correspond to the same temperature.
These points are discussed in the next subsections.
3.1 Size of the QP source
Let us first concentrate on the first point about the source definition. As we have already stressed in the last section and shown in Fig. 2, we are considering only events with a detected charge in the forward QP hemisphere close to the original charge. This guarantees a good detection, but does not
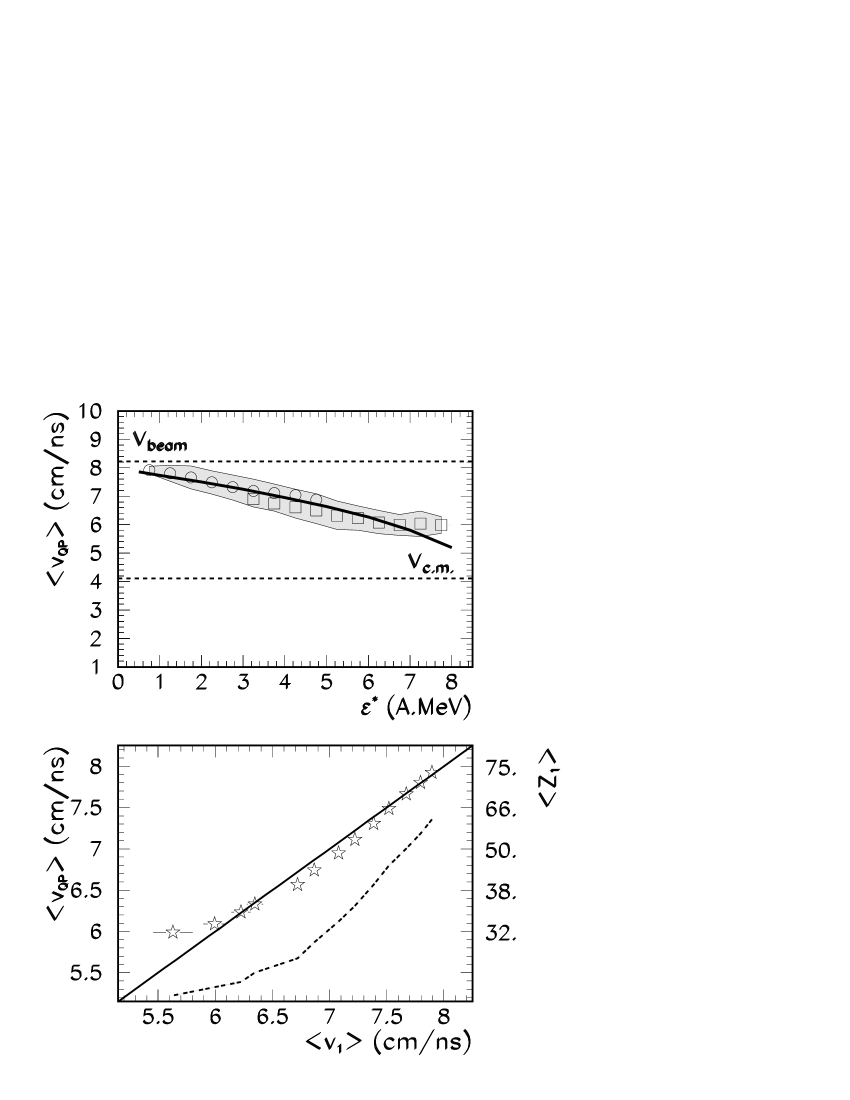
constrain the reaction mechanism or the number of sources, since the system is symmetric. Fig. 1 shows that the selected events are consistent with a purely binary kinematics. This in principle already implies that the bump at low charge shown by Fig. 3 cannot be ascribed to a reduced size of the excited source. Furthermore Fig. 1 and the calculated values in 2 show that the the contamination of the QT source is everywhere negligible, indicating that the bump at low charge in Fig. 3, corresponding to the most dissipative events, cannot be responsible of a decrease of the QP source size. To check this point, in Fig. 4 we plot the velocity in the laboratory frame of the QP source as a function of the excitation energy (grey contour). Open circles and squares correspond to cuts of Z 50 and Z 50, that is to the two bumps in the left panel of Fig. 3. The source velocity expected for a two body (QP-QT) kinematics, obtained via energy and momentum conservation in the hypothesis of an equal sharing of the excitation energy by the two equal mass collision partners, is indicated by the thick line [9]. We can see that both decay modes correspond to a source velocity compatible with a binary mechanism. In particular in the * region where the two modes are simultaneously present, their velocities are close, meaning that they can be attributed to a same source.
A further check is given in the lower part of Fig. 4, which displays the reconstructed average QP velocity as a function of the measured Z1 velocity. In this figure the dashed line gives the result of a simulation where all the forward collected fragments except Z1 are supposed to be emitted from an isotropic neck-like source located at the center of mass, with the constraints of energy and momentum conservation. We can see that even for the lowest velocities, corresponding to the highest kinetic energy loss, the measured correlation is very close to the diagonal (full line) corresponding to a perfect emission isotropy respect to Z1, while the measured kinematics is never compatible with the emission from a neck. Therefore the lower part of Fig. 4 shows that the more fragmented decay pattern is not due to the presence in the data set of a different reaction mechanism dominated by matter stopped in the center of mass.
As a conclusion we can safely consider the data of Fig. 3 as characteristic of the de-excitation of constant size source in a wide range of excitation energies.
3.2 Data sorting
Let us now come to the second central question of data sorting. The global distributions of Fig. 3 reflect the excitation energy deposit imposed by the dynamics of the entrance channel, and cannot be considered as belonging to a single statistical ensemble. If a sorting cannot be avoided, it is also clear that the shape of the distributions will depend on the sorting choice.
The two de-excitation modes visible in Fig. 3 are associated to different excitation energies (see Fig. 4). If they represent two different phases, this means that the associated phase transition should have a non zero latent heat, as is the case for standard liquid-gas. Therefore, the sorting variable should not impose a too strong constraint on the deposited energy, such that the two phases can be accessed in the same bin. In particular, in the liquid-gas phase transition, Z1 is known to be bimodal in the canonical ensemble which allows huge energy fluctuations, while no bimodality is observed in the microcanonical ensemble with fixed energy [22].
To search for a possible bimodal behavior, we should then in principle sort the data in temperature bins, i.e. in canonical ensembles. This is not possible experimentally, but we can choose a sorting variable allowing for relatively large energy fluctuations, as it is needed to explore two phases separated by a non zero latent heat. Moreover, as suggested by previous papers [28, 39], the sorting observable should better not be auto-correlated with fragments and light particles emitted by the QP source. To fulfill these requirements, in [28], the transverse energy E = of the light particles () emitted by the quasi-target source has been proposed, such particles being very efficiently detected even in the backward direction. The QT had been much larger than the QP, this sorting could be considered as a canonical one. In the present case, however, this sorting can be rather assimilated to an impact parameter sorting.
In our data the transverse energy extends up to 400 MeV, but the statistics for the higher values is poor. Therefore, after having divided the total range in nine equally spaced bins (width 45 MeV) we have considered for the analysis only the first six bins which have sufficient statistics.

The excitation energy constraint implied by this sorting is explored in Fig. 5, which shows the distribution of the calorimetric * in the six transverse energy bins. We can notice from this figure that the variables E and


* are loosely correlated, and a relatively wide distribution of * is obtained in most of the bins of transverse energy. It is well known [6] that the calorimetric measurement is not perfect, and the incomplete detection induces an uncertainty of the order 10% on *. However from Fig. 5 it is clear that this uncertainty does not affect the width of the distributions. The sorting in E bins cannot be therefore considered as a microcanonical selection, where no bimodality would be expected a priori.
The charge of the heaviest fragment Z1 is plotted in Fig. 6 for the six different transverse energy bins. We can note some indication of bimodality since the largest fragment size, peaked around 70 up to the fourth bin, shows a maximum around in the sixth bin, passing through a configuration (fifth bin) where a minimum in the probability appears to be associated to the intermediate patterns, even if admittedly the statistics should be improved. Such a behavior agrees with previous findings for peripheral Xe + Sn and Au + Au collisions [28], and with the expectations from a phase transition. We have already mentioned that the considered sorting corresponds to an impact parameter selection. Fig. 6 then shows that the two different decay patterns are associated to the same initial condition for the collision [34].
In Fig. 7 the most probable value of Z1 is shown, together with the variance and the skewness of Z1 distribution, as a function of the transverse energy. The skewness is defined as where is the third moment about the mean and is the standard deviation. The jump in the most probable value of Z1 corresponds to a maximum in the variance and a change of sign in the skewness (dashed line in Fig. 7). The detailed shape of the distributions shown in Figs. 5 and 6 obviously depends on the (largely arbitrary) width of the transverse energy bins, as well as on the choice of the sorting variable. The sudden change of the skewness of the distribution, passing through a configuration of maximal fluctuations, is however independent of these choices.
3.3 Towards a canonical sorting
The use of a transverse energy sorting has allowed us to directly compare to the previously analyses presented in the literature [28]. However, as already discussed, such a sorting cannot be interpreted as a canonical sorting. Indeed the absence of an explicit microcanonical constraint as shown in Fig. 5 does not guarantee that the energy fluctuations are large enough to allow an unbiased exploration of the two phases. To cope with this problem, it has recently been proposed in Ref. [40] to consider the whole set of experimental events reweighting them by the excitation energy distribution. This reweighting procedure produces a statistical ensemble which is intermediate between the microcanonical and the canonical ensemble. It is shown in Ref. [40] that, within simple models, the convexity of the order parameter distribution in this experimentally accessible statistical ensemble can be associated to the convexity of the underlying entropy.
This simple procedure allows to get rid of the trivial entrance channel impact parameter geometry that naturally favors the lower part of the excitation energy distribution. To produce a flat excitation energy distribution we have therefore reweighted the Z1 yields in each * bin with a factor proportional to the inverse of the bin statistics. The results are given in Fig 8, which shows the distribution of the largest cluster charge and a bi-dimensional plot of the largest cluster charge vs. the excitation energy for the reweighted distribution. A bimodal behavior of the largest charge clearly emerges. As we have already mentioned, a first order phase transition should imply a non zero latent heat, meaning that the two ”phases” observed at the same ”temperature” should be associated to different excitation energies.
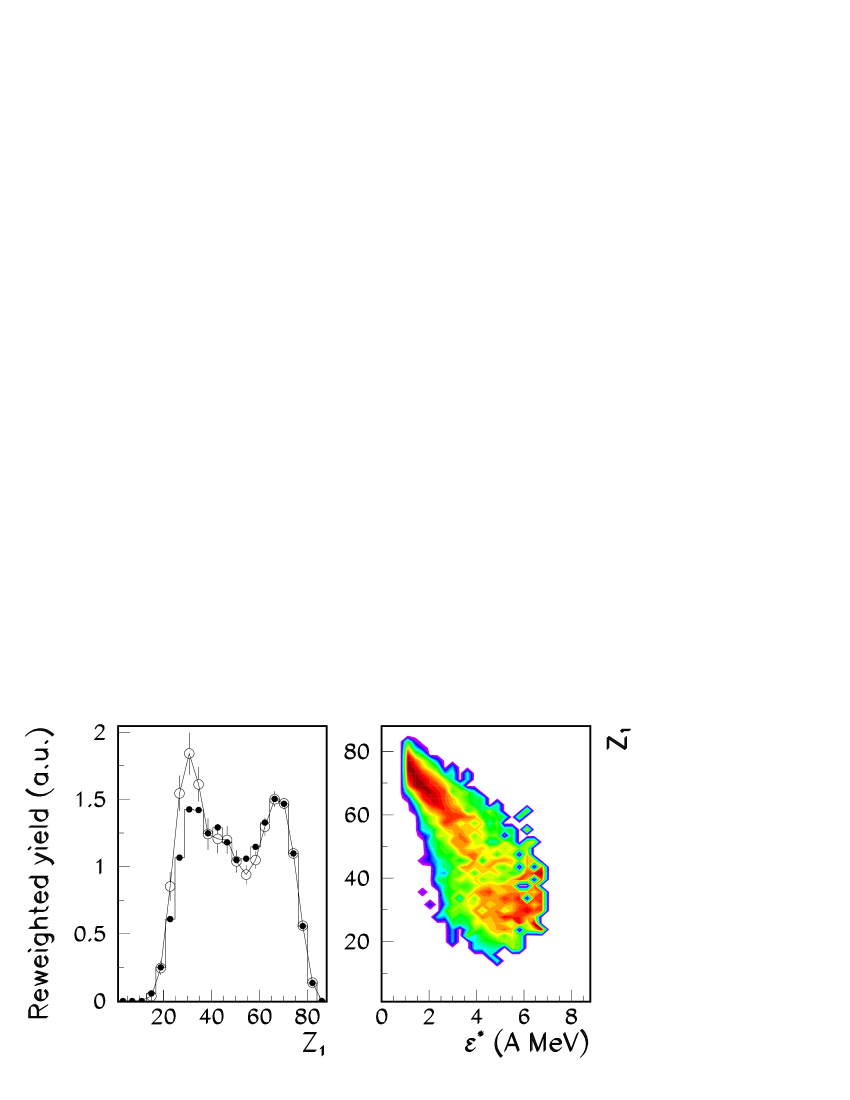
We can see in the right panel of Fig. 8 that indeed the two decay modes observed in the distribution correspond to different values of the calorimetric excitation energy: the cut 50 that roughly identifies the two bumps (see Fig. 3) succeeds in splitting the energy distributions into two separate components. The lower (higher) component roughly corresponds to a deposited energy higher (lower) than AMeV. Also shown in Fig. 8 is the effect of the condition on the velocity of the largest fragment on the bimodal distribution. Clearly this condition cuts the events on the high energy side, but does not affect at all the bimodal distribution.
If we interpret the two bumps as two coexisting phases, it would be tempting to estimate the latent heat of the transition from the energy distance between the two peaks. The ”liquid” peak points to an excitation energy * AMeV which nicely agrees with the indication of the fluctuation measurement shown in the right part of the Fig. 2. The ”vapor” contribution peaks at * AMeV, a slightly lower value compared to the location of the second divergence in the fluctuation analysis. This discrepancy may be due to the intrinsic limitations of the reweighting procedure, that does not allow sufficient energy fluctuations as compared to a physical heat bath [40]; it may also point to an incomplete exploration of the high energy phase space in our data sample, that cuts the distributions on the high energy side. From the temperature estimations obtained for this data set [12], the ”liquid” peak is associated to Tℓ = 4 0.5 MeV, while the vapor contribution corresponds to Tv = 4.7 0.5 MeV. This result is consistent with the expectations from a first order phase transition smoothed by finite size effects.
To summarize, the results of Fig. 8 suggest that the observed sudden change from evaporation to multifragmentation is the finite size precursor of a first order phase transition. Higher statistics samples obtained with collisions at higher beam energy could allow to be quantitatively more conclusive about the compatibility between fluctuations and bimodality [38]. In addition a detailed study of the convexity properties of the distributions would be very welcome [40, 41].
4 Conclusions
In this paper we have presented a new analysis of the 35 AMeV quasi-projectile Au+Au data collected with the Multics-Miniball apparatus, studying the distributions of the largest cluster charge emitted in the de-excitation of a constant size quasi-projectile source within a large range of dissipated energy. An evident transition from an evaporative to a multifragmentation pattern has been observed. Once the trivial entrance channel effect of the impact parameter has been removed by reweighting the Z1 distribution by the statistics of the excitation energy distribution, a bimodal behavior emerges. Such a behavior supports the interpretation of this ”discontinuity” of the de-excitation mode as the finite system counterpart of a first order phase transition.
As already pointed out, the bimodality signal per se cannot be considered a clear signal of first order phase transition [33, 34]. More data are needed in order to study this signal also in central collisions [28]. Nevertheless our data have shown a variety of different signals that are coherently pointing to a first order liquid-gas-like phase transition. We recall the determination of thermodynamically consistent critical exponents, both in a moment analysis [9] and in an analysis ”à la Fisher” [12], and the fluctuation peak in the partial energy distribution, with a strength of fluctuations consistent with the existence of a negative branch for the microcanonical heat capacity [6, 13].
Finally we would like to stress that, besides some small differences due to the different energy range, the trend of our data are consistent with the recent findings [28, 38] for a system of similar size at higher incident energies. More quantitatively, the value of the higher bump found in Refs.[28, 38] is fully compatible with the one of this work. Conversely, the lower peak is found in Ref.[28] at , which is a lower value than the one presented in Fig.8. This is most probably an effect of the decreasing quasi-projectile average source size with increasing dissipation, with a non negligible contribution of matter stopped close to midrapidity [28]. Indeed if in this same Indra data-set a constant source size is explicitly imposed in the data selection [38] (similarly to our analysis, see Fig.2), a higher value compatible with Fig.8 is found.
References
- [1] G.F. Bertsch and P.J. Siemens, Phys. Rev. Lett 126 (1983) 9.
- [2] J. P. Bondorf, A. S. Botvina, A. S. Iljinov, I. N. Mishustin, K. Sneppen, Phys. Rep. 257 (1995) 133.
- [3] D.H.E. Gross, Microcanonical Thermodynamics: Phase Transitions in Small Systems, Lecture Notes in Physics 66, World Scientific, Singapore (2001).
- [4] A. Bonasera, M. Bruno, C. Dorso, P.F. Mastinu, Riv. Nuovo Cim. vol.23, n.2 (2000).
- [5] Ph. Chomaz, The Nuclear Liquid Gas Phase transition and Phase Coexistence, Int. Nucl. Phys. Conference INPC 2001, AIP Proceedings Vol. No. 610, 2002.
- [6] M. D’Agostino et al., Nucl. Phys. A699 (2002)795.
- [7] I. Iori et al., Nucl. Instr. and Meth A325 (1993) 458. ; R. T. DeSouza et al., Nucl. Instr. and Meth A295 (1990) 109
- [8] M. D’Agostino et al., Nucl. Phys. A749 (2005) 55.
- [9] M. D’Agostino et al., Nucl. Phys. A650, 329 (1999); M. D’Agostino et al., Proc. of XXXVIII Int. Winter Meeting on Nuclear Physics, Bormio 2000, Ric. Sci. Univ. Perm. 116 (2000) 386 ; Proc. of Bologna 2000: Structure of the Nucleus at the Dawn of the Century, G.C. Bonsignori, M. Bruno, A. Ventura, D. Vretenar (eds.), World Sci. 2001, 215.
- [10] P. Milazzo et al., Phys. Rev. C 58, 953 (1998).
- [11] J. Pochodzalla et al., Phys. Rev. Lett. 75, 1040 (1995).
- [12] M. D’Agostino et al., Nucl. Phys. A724 (2003) 455.
- [13] M. D’Agostino et al., Phys. Lett. B473, 219(2000).
- [14] Ph. Chomaz, F. Gulminelli, Nucl. Phys. A647 (1999) 153.
- [15] Y. G. Ma et al., Phys. Rev. C71 (2005) 054606.
- [16] J. B. Natowitz et al., Phys. Rev. C 65, 034618 (2002); J. B. Elliott et al., Phys. Rev. Lett. 85, 1194 (2000); J. B. Elliott et al., Phys. Rev. C 67 (2003) 024609.
- [17] M. D’Agostino et al., Nucl. Phys. A734 (2004) 512.
- [18] M. Bruno et al. Proc. Fifth Italy-Japan Symposium, Naples, November 2004 in G. La Rana, C. Signorini, S. Shimura (Eds.), Recent Achievements and Perspectives in Nuclear Physics, W. Sci. (2005) 209.
- [19] N. Leneindre et al., Nucl. Phys. A795 (2007) 47.
- [20] M. Schmidt et al. Phys. Rev. Lett. 79, 99 (1997); M. Eryürek and M.H. Güven, Physica A 337 (2007) 514.
- [21] F. Gobet et al. Phys. Rev. Lett. 89, 183403 (2002).
- [22] Ph. Chomaz, F. Gulminelli, V. Duflot, Phys. Rev. E 64 (2001) 046114; F. Gulminelli, Ann. de Phys. 29 (2004) 1;
- [23] K. Binder and D. P. Landau, Phys. Rev. B 30, 1477 (1984).
- [24] G. Chaudhuri, S. Das Gupta, Phys. Rev. C 76 (2007) 014619.
- [25] S. Grossmann and W. Rosenhauer, Z. Phys. 207 (1967) 138; P. Borrmann et al., Phys. Rev. Lett. 84 (2000) 3511; K. C. Lee, Phys. Rev. E 53 (1996) 6558; Ph. Chomaz and F. Gulminelli, Physica A 330 (2003) 451.
- [26] M.S. Challa and J. H. Hetherington, Phys. Rev. Lett. 60 (1988) 77; Phys. Rev. A 38 (1988) 6324.
- [27] O. Lopez and M.F. Rivet, in Dynamics and Thermodynamics with Nuclear Degrees of Freedom, Eur. Phys. J. A 30 (2006) 263.
- [28] M. Pichon et al., Nucl. Phys. A 779 (2006) 267.
- [29] N. Bellaize et al., Nucl. Phys. A 709 (2002) 367.
- [30] W. Trautmann, Proc. of XLIII Int. Winter Meeting on Nuclear Physics, Bormio 2007.
- [31] X. Campi, J. Phys A 19 (1986) 917; R. Botet, M. Ploszajczak, Phys. Rev. E 62 (2000) 1825.
- [32] F. Gulminelli and Ph. Chomaz, Phys. Rev. C 71 (2005) 054607.
- [33] O. Lopez et al., Phys. Rev. Lett.95 (2005) 242701.
- [34] A. Le Fevre, J. Aichelin, Phys. Rev. Lett 100 (2008) 042701.
- [35] J. Cugnon, D. L’Hote, Nucl. Phys. A 397 (1983) 519.
- [36] J. F. Lecolley et al., Nucl. Instr. and Meth. A 441 (2000) 517.
- [37] R.A. Winyard et al., Nucl. Instr. and Meth. 95 (1971) 141.
- [38] E. Bonnet, PhD thesis, Universite’ Paris VI, 2006, http://tel.archives-ouvertes.fr/tel-00121736.
- [39] M. F. Rivet et al., nucl-ex/0205010 IWM2001 Int. Work. on Multifragmentation and Related Topics, Catania, nov. 2001; B. Borderie, J. Phys. G : Nucl. Part. Phys. 28 (2002) R217.
- [40] F. Gulminelli, Nucl. Phys. A791 (2007) 165.
- [41] E.Bonnet, B.Borderie et al., in preparation.