Hall effect of YbRh2Si2 and relatives in the light of electronic structure calculations
Abstract
We report experimental and theoretical investigations of the Hall effect in YbRh2Si2 and its reference compounds LuRh2Si2 and YbIr2Si2. Based on band-structure calculations we identify two bands dominating the Hall coefficient in all these compounds. For the case of LuRh2Si2—the non-magnetic reference compound of YbRh2Si2—the temperature dependence of the Hall coefficient is described quantitatively to arise from two hole-like bands. For YbIr2Si2 and YbRh2Si2, renormalized band calculations yield two bands of opposite character. In YbRh2Si2 these two bands almost compensate each other. We present strong indications that sample dependences of the low-temperature Hall coefficient observed for YbRh2Si2 arise from slight variations of the relative scattering rates of the two bands. Minute changes of the composition appear to be the origin. The results of our band structure calculations reveal that a transition of the 4 electrons from localized to itinerant leads to a decrease of the Hall coefficient.
pacs:
71.27.+a, 71.18.+y, 72.20.My, 73.43.NqI Introduction
The heavy-fermion compound YbRh2Si2 has emerged as a prototypical system for the investigation of quantum critical phenomena.Gegenwart et al. (2008) Pronounced non-Fermi-liquid properties arise due to the proximity to a quantum critical point (QCP).Custers et al. (2003) In its ground state, YbRh2Si2 orders antiferromagnetically below the Néel temperature, .Trovarelli et al. (2000) By applying a small magnetic field of within the basal plane, the magnetic order is suppressed to zero temperature, thus accessing the field-induced QCP.Gegenwart et al. (2002)
Hall-effect measurements turned out to be of central importance to understand the nature of the QCP as they allow to discriminate two different theoretical scenariosColeman et al. (2001) as discussed below. The Hall coefficient of YbRh2Si2 was measured as the compound was driven from the magnetically ordered state across the QCP towards the LFL regime by increasing the magnetic field.Paschen et al. (2004); Friedemann et al. (2009) Since anomalous contributionsFert and Levy (1987) are negligiblePaschen et al. (2005) at low temperatures, is directly related to the Fermi surface volume. The Hall coefficient was found to exhibit a crossover linked to the QCP which resides on top of a smooth background. Since this crossover sharpens to a discontinuous jump in the extrapolation to zero temperature these results imply an abrupt change of the Fermi surface at the QCP. Such a Fermi surface reconstruction is at variance with the predictions of the standard spin-density-wave theory.Hertz (1976); Millis (1993); Moriya and Takimoto (1995) Rather, the results suggest a new class of theoretical descriptions to be applied in YbRh2Si2, namely the Kondo-breakdown scenario in which the 4 electrons are itinerant on the high-field side of the QCP only.Coleman et al. (2001); Si et al. (2001); Senthil et al. (2004); Pepin (2007) Consequently, the Hall effect represents a key experiment to identify the unconventional nature of the quantum criticality in YbRh2Si2.
On the other hand, it was pointed out that the Hall coefficient of YbRh2Si2 is not simply proportional to the inverse charge carrier concentration since the assumption of a spherical Fermi surface with a single band at the Fermi energy is not valid in this material as shown by various band-structure calculationsWigger et al. (2007); Norman (2005) and photoemission studies.Wigger et al. (2007); Danzenbacher et al. (2007) Several calculations yield multiple bands crossing with canceling positive and negative contributions to the Hall coefficient.Jeong (2006); Norman (2005) Thus, the calculated Hall coefficient critically depends on the method used, and it remains an outstanding challenge to interpret the measured Hall coefficient quantitatively in terms of band-structure calculations.
The Hall-effect measurementsFriedemann et al. (2008) performed in a low-temperature setup with improved resolution on a number of YbRh2Si2 single crystals reproduced the results on a crystal used in Ref. Paschen et al., 2004. Other crystals of different quality, however, show strong sample dependences below . Although the critical crossover is found to be virtually independent of sample quality, it remains to be understood why the underlying background exhibits such strong sample dependences.Friedemann et al. (2009)
Here, we present experimental and theoretical progress which helps to refine our understanding of the Hall effect in YbRh2Si2. The issue of the low-temperature sample dependences as well as the characteristics of in YbRh2Si2 are addressed. Comparison with the Hall-effect data of both the non-magnetic reference compound LuRh2Si2 and the heavy-fermion compound YbIr2Si2 allows us to discriminate various contributions to the Hall coefficient. Our renormalized band-structure calculations yield excellent agreement with the experimentally determined Hall coefficient for YbIr2Si2 and LuRh2Si2. They provide a reliable basis to understand the sample dependences in YbRh2Si2. Moreover, enable us to relate the field induced crossover of the Hall coefficient to a change in the carrier concentration Paschen et al. (2004); Friedemann et al. (2009).
We present the details and the results of the electronic structure calculations in section II. This includes the calculation of the Hall coefficient in section II.5. In section III the results of the electronic transport measurements on LuRh2Si2, YbIr2Si2, and YbRh2Si2 are presented and discussed in the light of determined electronic band structures.
II band-structure calculations
II.1 Models of electronic structure
II.1.1 Local moment regime
We begin by calculating the electronic structure of YbRh2Si2 and YbIr2Si2, assuming that the Yb ions are in the 413 configuration. With this approximation we model the Fermi surface and the quasiparticle bands in the local moment regime. As there are exactly 13 4 electrons or one 4 hole per Yb site the single-particle excitations of the 4 shell involve valence transitions and which occur at high energies only. Consequently, the 4 degrees of freedom do not contribute to the low-energy excitations in the vicinity of the Fermi surface. In this energy range, the single-particle excitations are derived from the weakly correlated (non-) conduction states which form coherent Bloch states. We determine the dispersion of these bands by standard band-structure calculations. The effective potentials are generated self-consistently within the Local Density Approximation (LDA) to density functional theory. The strong Coulomb repulsion among the 4 electrons which suppresses charge fluctuations is implicitly accounted for by treating the 4 electrons as part of the ion core assuming that they do not hybridize with the conduction states. This assumption seems justified for the systems under consideration whose 4 valence deviates only weakly from the integer value. We refer to this method as -core calculation. By using the -core calculation for YbRh2Si2 to interpret the results obtained on LuRh2Si2 we rely on the facts that the lattice parameters agree within the experimental errorKohler et al. (2008) and that the results of the -core calculation are independent of the 4-occupancy.
The partially filled shell of the -configuration necessarily carries a magnetic moment in agreement with Kramers’ theorem. The presence of local magnetic moments is reflected in the Curie-Weiss behavior observed at elevated temperatures in the magnetic susceptibility of YbRh2Si2 and YbIr2Si2. The 4 moments, however, interact only weakly with the conduction states as can be inferred, e.g., from the low magnetic ordering temperature in YbRh2Si2. We neglect the potential reconstruction of the conduction electron Fermi surface that may result from the long-range antiferromagnetic order and account only for the 4 charge which contributes to the potential seen by the conduction electrons. This amounts to effectively averaging over the local magnetic degrees of freedom in determining the self-consistent potentials. When comparing with experiment the bare bands derived from the effective potentials have to be renormalized by local 4 excitations. Scattering off Crystalline Electric Field (CEF) excitations may enhance the effective masses and reduce the life-times of the conduction electrons. With these effects properly accounted for White and Fulde (1981); Fulde and Jensen (1983) the -core model should quantitatively describe the electronic properties of Yb-based heavy-fermion compounds at elevated temperatures. However, for the Hall effect of the heavy-fermion compounds one has to take anomalous contributions into account which arise from the skew scattering at the local -moments. These contributions may only be neglected at very low temperatures where, on the other hand, the -core calculation is insufficient for the description of heavy-fermion compounds. Rather, we shall use the Renormalized Band Calculation (RBC) to understand the Hall coefficient in the heavy-fermion compounds.
Treating the 4 electrons as part of the ion core can be viewed as an extreme limit of an LDA+U calculation. Therefore, we shall compare our data with recent results obtained from LDA+U (Ref. Wigger et al., 2007). The LDA+U calculation explicitly includes the magnetic moments of the 4 configuration assuming long-range ferromagnetic order. This treatment preserves the translational invariance of the underlying lattice. It removes, however, the spin degeneracy of the conduction bands as they are split by the Zeeman effect. This splitting is rather small reflecting the weak coupling between the 4 states and the conduction electrons. For this reason, we anticipate the energy bands of the LDA+U and the -core calculation to agree in the low-energy regime, i.e., in the vicinity of the Fermi surface.
II.1.2 Heavy Fermi liquid regime
The strongly renormalized heavy quasiparticle bands are determined by means of the renormalized band method Zwicknagl (1992); Fulde et al. (2006) which combines material-specific ab initio methods and phenomenological considerations in the spirit of Landau. The key idea is to construct an effective Hamiltonian for the low-energy excitations which uses the ab initio potentials for the weakly correlated conduction electron channels while introducing one parameter to account for the specific local correlations among the 4 electrons. The parameter is determined once by fitting to experiment and is kept fixed during subsequent investigations. A detailed description of the method and typical results for Ce-based compounds are given in Refs. Zwicknagl, 1993, Thalmeier and Zwicknagl, 2005. Operationally, it amounts to transforming the -states of the spin-orbit ground state multiplet at the lanthanide site into the basis of CEF eigenstates and introducing resonance-type phase shifts
| (1) |
where the resonance width accounts for the renormalized quasiparticle mass. The resonance energies refer to the centers of gravity of the -derived quasiparticle bands. Here denotes the position of the band center corresponding to the CEF ground state while are the measured CEF excitation energies. One of the remaining two parameters, , is determined by imposing the condition that the charge distribution is not altered significantly by introducing the renormalization. This makes the RBC a single-parameter scheme. The free parameter, , is adjusted in such a manner that the coefficient of the linear-in- specific heat at low temperatures is reproduced. The effective band structure Hamiltonian constructed along these lines corresponds to a hybridization model which closely parallels the one obtained from the periodic Anderson model in mean-field approximation. Alternatively, the RBC can be viewed as a parametrization scheme for the variation with energy of the real part of the local 4 electron self-energy. The parameter to be determined by experiment is the slope at the Fermi energy while the value at is fixed by retaining the charge distribution.
The method has been shown to reproduce Fermi surfaces and anisotropies in the effective masses of a great variety of Ce-based compounds. In addition, it allows to predict Fermi liquid instabilities Pulst (1993); Stockert et al. (2004); Thalmeier et al. (2005); Zwicknagl (2007); Eremin et al. (2008).
In calculating the coherent 4-derived quasiparticle bands in Yb-based heavy-fermion compounds we essentially follow the procedure for the Ce case as described above. We have to account for the fact that Yb can be considered as the hole analogue of Ce. Operationally this implies that we have to renormalize the 4 channels at the Yb sites instead of the 4 states in the Ce case. As the 4 hole count is slightly less than unity the center of gravity will lie below the Fermi energy. In addition, we have to reverse the hierarchy of the CEF scheme, i.e.,
| (2) |
II.2 Computational method
The calculations are done on the basis of the experimental lattice parameters , for YbRh2Si2 and LuRh2Si2(cf. section II.1.1) and , for YbIr2Si2 (I-type).Trovarelli et al. (2000); Hossain et al. (2005) The band structures were obtained by the fully relativistic formulation of the linear muffin-tin orbitals method Andersen (1975); Skriver (1984); Albers et al. (1986). We adopt the atomic-sphere approximation including the combined correction term which contains the leading correctionsAndersen (1975). In solving the band-structure problem, we include ----components at the Yb and the transition metal (Rh, Ir) sites and ---components at the Si sites. The spin-orbit interaction is fully taken into account by solving the Dirac equation. Although the relativistic effects hardly change the electron density distribution they nevertheless influence the actual location of the energy bands. This aspect is particularly important for the renormalized band structure since the spin-orbit splitting of the -states is rather large on the energy scales relevant for the strongly renormalized heavy quasiparticles. Exchange and correlation effects were introduced using the Barth-Hedin potential Barth and Hedin (1972). The band structure was converged for 405 k-points within the irreducible wedge, whose volume equals 1/16 of the Brillouin zone. The density of states (DOS) was evaluated by the tetrahedron method with linear interpolation for the energies. For the conduction band the DOS was calculated at () intervals. To obtain reliable values for the transport integrals the energies were calculated at 2601 -points within the irreducible wedge. Subsequently, the bands were interpolated using Mathematica VI, and the result was used to numerically evaluate the desired quantities.
II.3 Electronic structure
II.3.1 YbRh2Si2 in the local-moment regime
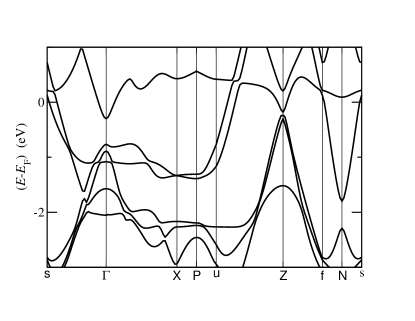
Figure 1 displays the electron bands of YbRh2Si2 in the vicinity of the Fermi energy along symmetry lines with the 4 electrons being treated as part of the ion core. Here, the band states have predominantly Rh 4 character with some admixture of Yb 5 character. The dispersion of YbRh2Si2 agrees rather well with the results of recent LDA+U calculations Wigger et al. (2007); Jeong and Pickett (2006). In addition, it is consistent with energy bands deduced from photoemission studies.Wigger et al. (2007)
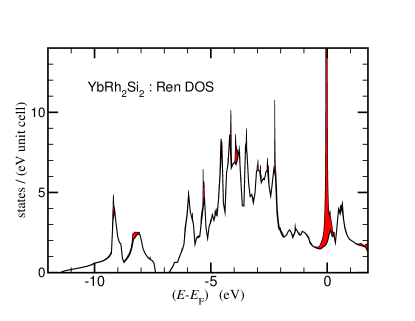
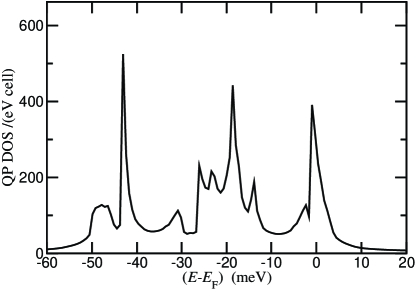
In the 4-core calculation, the broad bands intersecting the Fermi energy are exclusively formed by the non- conduction states. This is reflected in the low DOS at the Fermi energy for the -core calculation of YbRh2Si2 as shown in Fig. 2.
II.3.2 YbRh2Si2 and YbIr2Si2 in the heavy-Fermi-liquid regime
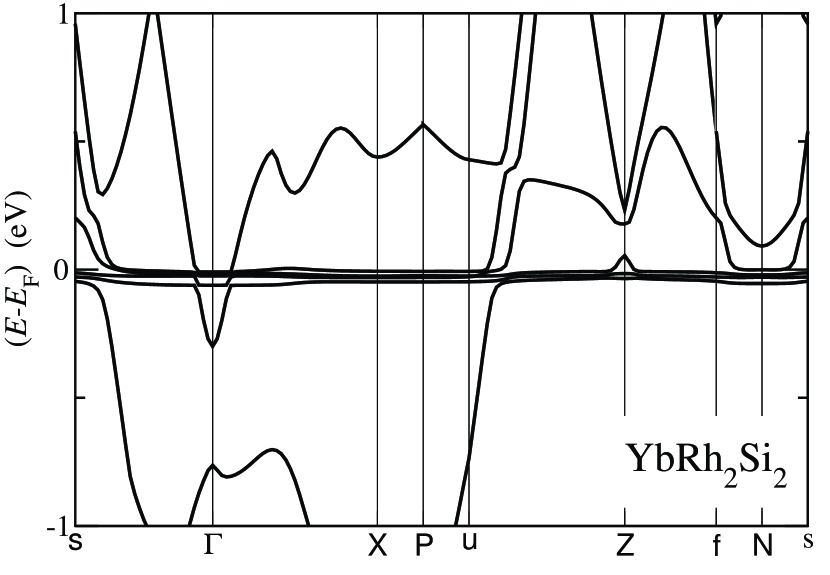
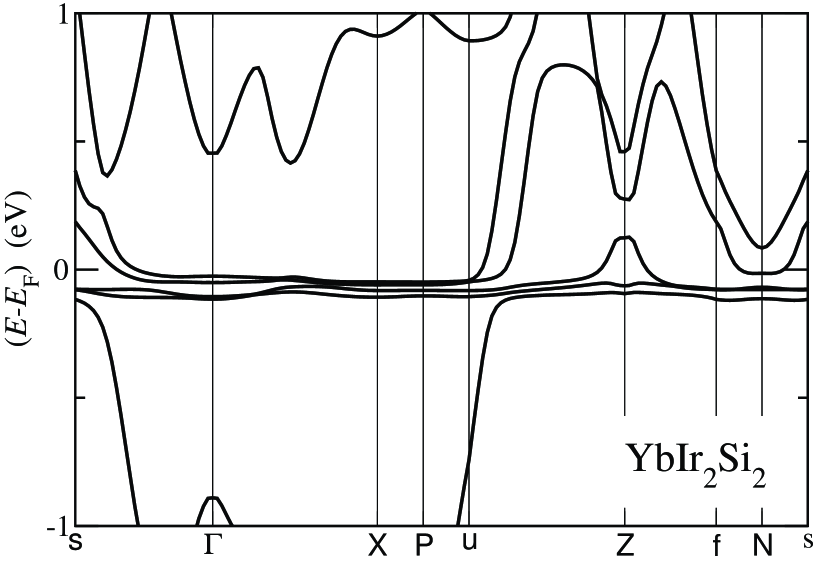
The calculations reported here adopt a CEF scheme which is consistent with susceptibility and inelastic neutron-scattering data Hiess et al. (2006); Stockert et al. (2006). The latter indicate that the 413 states in YbIr2Si2 and YbRh2Si2 are split into 4 doublets with the energies eV and eV , respectively. The low-energy properties are mainly determined by the CEF ground state which is a superposition of and and which is well separated from the excited states. The CEF parameters and the CEF eigenstates are given in Ref. Zwicknagl, 2009. Using the effective quasiparticle resonance widths of and as inferred from specific heat and thermopower measurements for the Rh (Ref. Gegenwart et al., 2006; Kohler et al., 2008) and Ir (Ref. Hossain et al., 2005) compounds yields the band structures displayed in Fig. 3. The dispersion of the renormalized bands of the Rh- and the Ir-compound are rather similar, the band widths scale with the characteristic temperatures. We shall concentrate on the results for the Rh-compound in the subsequent discussion.
The RBC yields narrow -derived quasiparticle bands in the vicinity of the Fermi energy, whereas the dispersion of the non- bands is essentially unaffected. This can be seen from Fig. 2 in which the DOS derived from the renormalized bands are compared with the -core counterpart. The expanded view of the RBC DOS in the low-energy regime as depicted in Fig. 4 shows the contributions of the CEF-split 4 states. The CEF excitations appear in the occupied part of the spectrum below the Fermi energy. The hybridization and hence the effective quasiparticle masses are rather anisotropic. The renormalized band calculations yield a DOS of at corresponding to specific heat coefficient . For YbIr2Si2 a DOS of at is calculated corresponding to a Sommerfeld coefficient of .
II.4 Fermi surface and quasiparticles
II.4.1 Local-moment regime
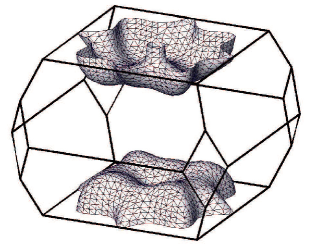
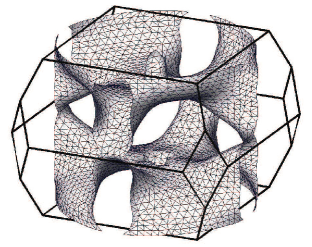
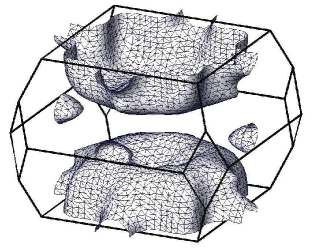
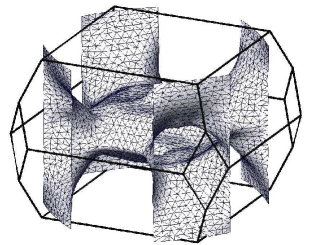
The LDA calculation for localized 4 electrons predicts three bands to cross the Fermi energy and leads to the Fermi surface which closely resembles previous results Wigger et al. (2007); Rourke et al. (2008). It consists of three separate sheets. The two main sheets form a hole surface centered around the Z point, and a complex, multi-connected surface. Following Ref. Wigger et al., 2007 we shall refer to them as ‘donut’ and ‘jungle gym’, respectively. In addition, there is a small -centered electron surface, the ‘pill box’. We shall focus on the two main sheets which are displayed in Fig. 5 as these two dominate the electronic properties.
| ‘donut’ | ‘jungle gym’ | |
| -core |
|
|
|---|---|---|
| RBC |
|
|
II.4.2 Heavy-Fermi-liquid regime
The RBC also predicts two major sheets at the Fermi surface whose topologies resemble those found by LDAJeong (2006); Knebel et al. (2006) (see Fig. 5). The major sheets of the Rh-compound and its Ir-counterpart are rather similar. The main difference occurs in the small pockets: The small -centered electron pocket of the Rh-compound is absent in the Ir-System where we find a Z-centered hole pocket instead.
From the comparison of the -core results and those of the RBC it is obvious that they represent ‘small’ and ‘large’ Fermi surfaces, respectively. The difference of the Fermi volume accounts for the additional states related to the large quasiparticle DOS at for the heavy-Fermi-liquid limit (cf. Fig. 2).
II.5 Calculation of the Hall coefficient
For the chosen experimental geometry and using the Boltzmann approximation, the Hall coefficient is given in the low-field limit by Hurd (1972)
| (3) |
where the conductivity tensor elements
| (4) |
and
| (5) |
are summed over all bands intersecting the Fermi surface. We enumerate the ‘donut’ and the ‘jungle gym’ with and , respectively. We restrict ourself to the first two bands which dominate the total conductivities and neglect small pockets. In the following, we allow for the possibility that the relaxation time may vary from one band to another but we shall neglect the variation of the relaxation time with wave vector (with components ). Here, and denote the electron charge and the vacuum speed of light, respectively. represents the volume of the Brillouin zone and the Fermi distribution function. The components of the velocity
| (6) |
and of the inverse mass tensor
| (7) |
are deduced from the energy bands .
For the discussion of Fermi-surface effects we write the longitudinal and transverse conductivity as
| (8) |
with the prefactors
| (9) |
being the Drude result for a gas of free particles with charge . The particle density corresponds to the number of occupied states per unit cell in band while the reduced transport integrals and account for the deviations of the conductivity tensor elements and the particle density from the free particle picture. The results for the systems under consideration are summarized in Table 1.
| System | Method | |||||
|---|---|---|---|---|---|---|
| YbRh2Si2 | 4 core | 1 | 1.76 | 0.197 | ||
| 2 | 1.22 | 0.384 | ||||
| YbRh2Si2 | 4 RBC | 1 | 1.37 | 0.0137 | ||
| 2 | 0.63 | 0.0747 | ||||
| YbIr2Si2 | 4 RBC | 1 | 1.42 | 0.051 | ||
| 2 | 0.58 | 0.138 |
For the -core calculations we obtain positive Hall (transverse) conductivity for both bands corresponding to hole-like character of the charge carriers. The crucial point is that for the RBC results, by contrast, the ‘jungle-gym’, is predominantly electron-like as can be inferred from the reduced transport integrals listed in Tab. 1. Moreover, we find for YbRh2Si2 that the two bands almost compensate each other. This is seen by the fact that the products of the two bands are close to each other in magnitude and of opposite sign. Their sum determines the numerator of Eq. 3. Since we allow for different relaxation rates of the individual bands, this gives rise to a weighting of these two terms in the sum of Eq. 3. Consequently, the total Hall coefficient very sensitively depends on the relative relaxation rates of the two bands. Even the sign of may change if this balance is shifted only slightly toward the electron-like band. We shall discuss later that this might relate to the sample dependences observed in YbRh2Si2.
The calculated transport integrals vary only slightly with the position of the Fermi level. This is contrary to the result of Ref. Norman, 2005 and reflects the different methods used: The LDA calculations of Ref. Norman, 2005 are not able to account for the position of the 4 level with respect to the Fermi energy. The RBC on the other hand takes the correlation effects into consideration and, thus, does not rely on a shift of the 4 level position.
III Comparison to Hall effect measurements
In this section we present the Hall-effect measurements and use the above results of the electronic structure calculations to advance our understanding of the experimental observations.
III.1 Samples
Single crystals of YbRh2Si2, YbIr2Si2 and LuRh2Si2 were synthesized applying an In flux-growth technique as described earlier.Trovarelli et al. (2000) We note that within this work we concentrate on the I-type phase of YbIr2Si2 which is isostructural to YbRh2Si2.Hossain et al. (2005)
In LuRh2Si2, also isostructural to YbRh2Si2, the Lu3+ has 14 electrons and consequently retains a fully occupied shell without magnetic moment. Therefore, it serves as a non-magnetic reference compound to YbRh2Si2. An assignment of the YbRh2Si2 -core calculations to LuRh2Si2 is justified by the fact that LuRh2Si2 has equal lattice parameters within experimental error. This allows us to model the experimentally observed temperature dependence of the Hall coefficient. The -core calculations yield a DOS (section II.3.1) which corresponds to a bare linear-in- specific heat coefficient of in good agreement with the experimental value found for LuRh2Si2 (not shown). The resistivity as displayed in the inset of Fig. 6 is approximately linear in above with . Both the specific heat and the resistivity indicate that LuRh2Si2 is a simple non-magnetic intermetallic compound.
YbRh2Si2 and YbIr2Si2 exhibit pronounced heavy-fermion behavior in various properties.Trovarelli et al. (2000); Hossain et al. (2005) In particular, the specific heat is largely enhanced (cf. section II.3.2). However, their ground states differ: YbRh2Si2 exhibits antiferromagnetic order at zero magnetic field, whereas YbIr2Si2 is paramagnetic obeying Landau Fermi liquid (LFL) behavior below .Hossain et al. (2005) Proximity of YbIr2Si2 to a QCP is indicated by a logarithmic divergence of the specific heat for temperatures above . Since YbIr2Si2 has a larger unit cell volume than YbRh2Si2 it is assumed to be located on the paramagnetic side of the QCP as unit-cell expansion weakens magnetic ordering in Yb-systems. Consequently, YbIr2Si2 serves as a reference compound with fully itinerant 4-states as accounted for in the RBC. For YbRh2Si2, in its ground state in zero magnetic field, by contrast the electrons appear to be localized as inferred from the Fermi surface reconstruction.Paschen et al. (2004)
III.2 Experimental setup
All samples were polished to thin platelets of thickness in the range . Subsequently, the samples were prescreened via resistivity measurements to ensure In-free samples. The current was driven within the crystallographic plane. The magnetic field was applied along the axis, thus, inducing the Hall voltage perpendicular to within the tetragonal plane, (see inset of Fig. 7). To measure the Hall effect the transverse voltage was monitored. In order to cancel out magnetoresistance components due to contact misalignment, the Hall resistivity was obtained from the antisymmetric component of the field-reversed transverse voltage, . The linear-response Hall coefficient was derived as the slope of linear fits to the Hall resistivity for fields . Only the low-temperature Hall resistivity of LuRh2Si2 displays a deviation from linearity as discussed in Ref. Friedemann et al., 2010. In this case, the initial-slope Hall coefficient was deduced by extrapolating the differential Hall coefficient to . Although this procedure yielded slightly larger values of , the analysis presented here is not affected by this offset.
We note that the error on the absolute value of arising from the uncertainty of the thickness of the samples is of the order of . For YbRh2Si2, the results were scaled by a single factor in the temperature range to the previously published data Paschen et al. (2004). The fact that this leads to a very precise match of in this temperature range accounts for the error arising from the thickness which enters as a factor. Consequently, the uncertainty of the sample thickness does not obstruct a detailed comparison of the different YbRh2Si2 samples.
Measurements between and were conducted in a Quantum Design Physical Property Measurements System. For measurements down to a 3He/ 4He-dilution refrigerator was utilized. In this case, the voltages were amplified by low-temperature transformers and subsequently recorded by a standard lock-in technique.
III.3 Experimental Results and Discussion
III.3.1 LuRh2Si2
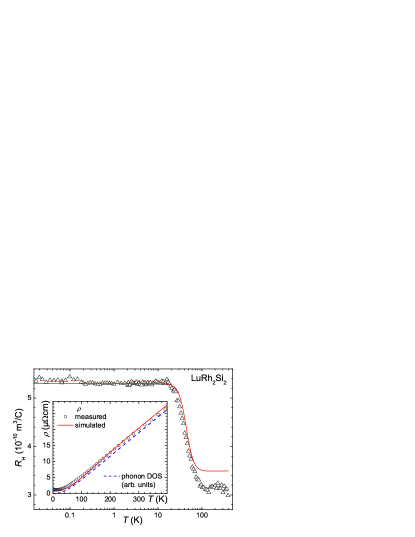
The temperature dependence of the linear-response Hall coefficient, , for LuRh2Si2 is depicted in Fig. 6 for temperatures between K and . For LuRh2Si2 the Hall coefficient is always positive indicating hole-like charge carriers in agreement with the predictions of the -core calculations on YbRh2Si2. The temperature dependence displays a constant value below at followed by a crossover to another constant value of above . We note that a very similar behavior of has been observed for the non-magnetic La analogues of the CeIn5 (=Co, Ir, Rh) family of compounds.Hundley et al. (2004)
For elemental copper a similar temperature dependence was observed. It was suggested to arise from two bands effectively contributing to the Hall coefficient, with their weights changing as a function of temperature.Hurd (1972) In the following we demonstrate that the combination of band-structure calculations and comprehensive electrical transport measurements allow to model the temperature dependence of quantitatively.
III.3.2 Application of a two-band model to LuRh2Si2
In the light of the results of our calculation (Tab. 1) it is reasonable to interpret the temperature dependence of of LuRh2Si2 within a two-band model. Here, the observed crossover may be interpreted as the transition between the limits of the respective band dominating the total Hall coefficient. This may result from a shift of the relative scattering rate of the charge carriers in the individual bands off either phonons at high temperatures or static defects at low temperatures. For a quantitative analysis, we rewrite Eq. 3 for two bands as a function of the resistivities as
| (10) |
Here, we approximated which is justified given the small Hall angle of less than . The Hall coefficient of the individual bands is introduced as
| (11) |
The total resistivity given by
| (12) |
was measured simultaneously with the Hall effect and is displayed in the inset of Fig. 6. By introducing the ratio of the resistivities of the two bands we obtain the form
| (13) |
Here, it becomes obvious that the overall Hall coefficient is only a function of the ratio but not of the absolute values of , provided the are temperature independent. For LuRh2Si2 this latter assumption is supported by the band-structure calculations which yield constant values of up to , i.e., the thermal broadening of the Fermi surface has negligible influence, a typical behavior of conventional metals due to their high Fermi temperatures. We rather assume that merely are temperature dependent. For LuRh2Si2 we model the resistivity as a sum of different contributions according to Matthiessen’s rule restricting ourself to a residual () and a phononic () term:
| (14) |
The Bloch-Grüneisen law
| (15) |
describes the phononic component very well (cf. inset of Fig. 6). This is corroborated by the agreement of the measured resistivity and the electrical resistivity calculated using a phonon DOS derived from measured inelastic neutron scattering spectra Stockert et al. (2006) (cf. Fig. 6). In Eq. 15, is a constant related to the electron-phonon scattering probability of each band, and is the Debye temperature determined from specific heatFerstl (2007). Taking Eqs. 10 to 15 together one recognizes that the total Hall coefficient is determined at low temperatures by the ratio of the residual resistivities, and at high temperatures by that of the phonon scattering rates. This is in good agreement with the experimental data: The low-temperature constant regime in is observed in the temperature range where the resistivity is almost constant. By contrast, the high-temperature regime of corresponds to a range where appears to be dominated by electron-phonon scattering as indicated by the fact that amounts to more than 10 times its residual value . Finally, the crossover is centered at where the resistivity is twice its residual value implying that both contributions and are equal at this temperature.
Equations 10 to 15 contain in total six free parameters: the Hall coefficients, the residual resistivities, and the phonon scattering rates of the two bands. In order to fit these equations to our data we proceeded as follows: Firstly, we utilized the results of our band structure calculation (Tab. 1) in Eq. 11 to obtain the contributions of the individual bands. These results are listed in the first column of Tab. 2. Secondly, these and our experimental are employed to obtain from Eq. 13. This step is performed with the value of measured at low temperatures yielding , as well as in the high-temperature limit. However, in the latter case no exact solution is possible since the solution space is limited to where for the values obtained on the basis of the calculated electronic structure. The discrepancy between the measured and the calculated Hall coefficient at high temperatures may also be corrected by a change of to . This might indicate that the assumption of an isotropic relaxation time is not fully justified. However, we rather stick to the results of the band-structure calculation as any change would be arbitrary. Thirdly, we take advantage of the fact that, at our lowest measurement temperature (), is negligible leaving only in Eq. 14. With known from the second step and the total resistivity (Eq. 12) set to the experimentally obtained value at low temperature, the individual can be calculated. In the high-temperature regime, on the other hand, the residual term in Eq. 14 is negligible and hence, the individual values of are obtained from which, in turn, is inferred. All results are summarized in Tab. 2.
| ( µ Ω\usk c m ) | ( µ Ω\usk c m ) | ||
| 1 | 21 | 2.75 | 7 |
| 2 | 4.2 | 2.11 | 1.23 |
| resistivity ratio | 1.3 | 5.7 | |
With the parameters of Tab. 2 we are now in the position to simulate the overall temperature dependence of both the Hall coefficient and the resistivity again employing Eqs. 10 to 15. The results are included in Fig. 6 as solid lines. The good quantitative and the even better qualitative agreement of the simulated and measured data justify the application of the two-band model. We wish to emphasize that the position of the crossover in and the position where deviates from its residual value are not fitted but are dictated by the Debye temperature which was determined independently.
III.3.3 YbIr2Si2 and YbRh2Si2
For the heavy-fermion compounds YbIr2Si2 and YbRh2Si2 the temperature dependence of the Hall coefficient is more complicated as can be seen from Figs. 7 and 8. At high temperatures both compounds show a minimum in in the same temperature range where the resistivity assumes a maximum (cf. insets of Figs. 7 and 8), namely at approximately for YbIr2Si2 and for YbRh2Si2. This corroborates the earlier assignment of this minimum in of YbRh2Si2 to the anomalous Hall effect arising from skew scattering which predicts such a correlation between the resistivity and the anomalous Hall contribution.Paschen et al. (2005)
Between and of YbIr2Si2 assumes a plateau at a value of / C . This indicates that the anomalous contribution, typically being of importance around the resistivity maximum only, is superposed to a normal component as expected in the theory of the anomalous Hall effect.Fert and Levy (1987)
In the temperature range between and a crossover to another plateau at a value of / C is observed in of YbIr2Si2. Two possible reasons may account for this observation: (i) The crossover might be of the same two-band nature as in LuRh2Si2. However, as the crossover in YbIr2Si2 is situated at a lower temperatures it should be accompanied by a decreased value of the Debye-temperature. Unfortunately, is not yet known. Moreover, single crystals of LuIr2Si2 are not available to look for a possible shift of the two-band crossover in this non-magnetic reference compound. (ii) Alternatively, the crossover might manifest the Fermi surface change arising from the onset of the Kondo screening effect which leads to itinerant electrons contributing to the Fermi surface at low temperatures.
Below the Hall coefficient of YbIr2Si2 exhibits a pronounced increase, peaks at and drops at lower temperatures. At , changes sign and finally saturates at the lowest temperatures at a value of / C .
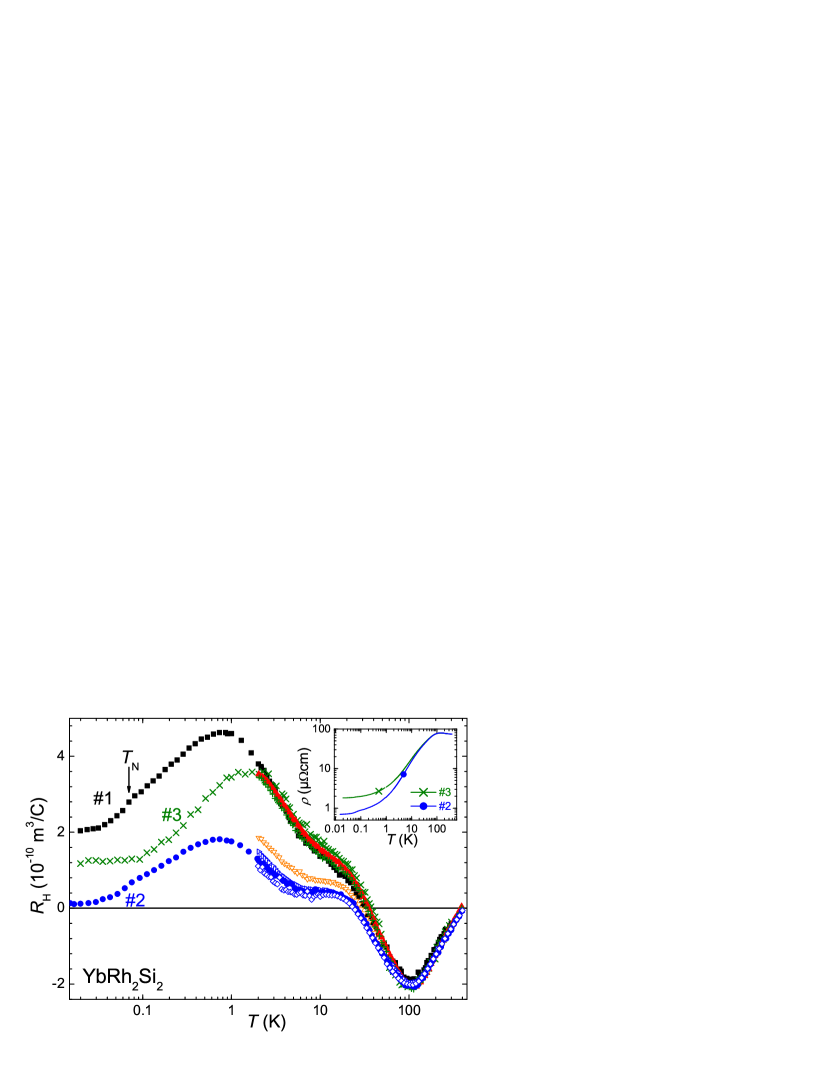
For YbRh2Si2 the minimum in at caused by the anomalous Hall effect is uniquely observed for all samples investigated. By contrast, below strong sample dependences are present. Figure 8 consists of data obtained for a large variety of samples. Three of theses samples were selected for low-temperature measurements down to and represent the full range of sample dependences. Sample 1 and 3 exhibit a shoulder in around whereas of sample 2 shows a plateau in the temperature interval . All samples exhibit a maximum in around like in YbIr2Si2, however, at different absolute values. This maximum is assigned to the quantum critical spin fluctuations operating for all samples in the same temperature regime. Such a pronounced extremum was also reported for CeIn5 where antiferromagnetic fluctuations were suggested as the microscopic origin.Hundley et al. (2004); Nakajima et al. (2006) In YbRh2Si2, NMR investigations Ishida et al. (2002) revealed antiferromagnetic fluctuations to be present in the designated temperature range. However, the temperature dependence of predicted in Ref. Nakajima et al., 2006 is not observed in YbRh2Si2 nor YbIr2Si2.
Finally, at the lowest temperatures all samples of YbRh2Si2 show a saturation of , setting in just below the Néel temperature. However, the saturation value appears to be sample dependent.
| sample | batch | |||
|---|---|---|---|---|
| #1 | 37105 | 20.7 | 3.8 | |
| 63111 | 20.7 | 1.9 | ||
| 63113 | 15.3 | 3.5 | ||
| #3 | 63114 | 15.2 | 3.4 | |
| 63114 | 16.1 | 3.7 | ||
| #2 | 63116 | 24.0 | 1.3 | |
| 63116 | 24.2 | 1.5 | ||
| 63116 | 26.5 | 1.1 |
III.3.4 Sample Dependences
A series of YbRh2Si2 samples with different residual resistivities have been investigated above . It turns out that the saturation values at lowest temperature correlate with the values at the plateau/shoulder around . The plateau is more pronounced for samples with a lower saturation value: Sample 1 obeys a comparably slight shoulder and saturates at the highest low-temperature value. Sample 2 depicts the most pronounced shoulder resembling a plateau and exhibits the lowest saturation value. Sample 3 with an intermediate saturation value obeys a more pronounced shoulder than sample 1. The correlation indicates that the maximum around is caused by a superposed contribution which itself is not affected by the sample dependences.
It is observed that samples from the same batch (cf. colors in Fig. 8) show almost identical curves. From this we infer that sample dependences arise from slight differences in crystal growth. By contrast, a correlation between sample quality and these sample dependences can not be found. This is quantitatively analyzed in Tab. 4 for the selected samples by a comparison of the low-temperature saturation value of with the residual resistivity ratio (). An equivalent conclusion is found for the larger set of samples: In the absence of measurements in the m K -range, the resistivity ratio at is used to quantify the sample quality which appears to be uncorrelated with the Hall coefficient at .
| Calculation | Experiment | ||||
|---|---|---|---|---|---|
| System | Method | Sample | |||
| YbRh2Si2 | 4 core | 5.16 | LuRh2Si2 | 17 | 5.3 |
| YbRh2Si2 | |||||
| YbRh2Si2 | 4 RBC | -0.39 | sample 1 | 70 | 2.0 |
| sample 2 | 120 | 0.1 | |||
| sample 3 | 40 | 1.2 | |||
| YbIr2Si2 | 4 RBC | -0.26 | YbIr2Si2 | 325 | -0.4 |
No sample dependences were observed for LuRh2Si2 for which three samples where investigated. In the case of YbIr2Si2 only one sample without indium enclosures could be identified. In samples with indium enclosures the rearrangement of the current distribution largely disturbs the Hall-effect measurement and therefore no statement on sample dependences can be made. However, the fact that the calculated and the measured Hall coefficient agree suggests that the measurements depict the intrinsic behavior.
III.3.5 Comparison of Theory and Experiment
Unfortunately, for YbIr2Si2 and YbRh2Si2 it is not possible to apply the two-band model as done for LuRh2Si2 because both the resistivity and the Hall coefficient contain additional (quantum critical) contributions. Thus, the number of unknown parameters would increase and could in particular not be mapped with measured quantities. For a qualitative discussion we make the simplified assumption of equal relaxation rates for the two bands which yield the Hall coefficients listed in Tab. 4.
For YbIr2Si2, the agreement between the zero-temperature Hall coefficient, , extrapolated from measurements, and the calculated value is remarkable (see Tab. 4). In the case of YbRh2Si2 our band structure calculations predict a value lower than the experimental . This might be due to deviations from equal relaxation rates as the sample dependences indicate that small changes can have large influence.
The most straight-forward interpretation of the sample dependences in YbRh2Si2 arises from the insight provided by the band-structure calculations. As shown in section II.5, the two bands dominating the Hall coefficient are of opposite character and almost compensate each other. The actual value of the total Hall coefficient, therefore, depends sensitively on the ratio of the scattering rates of the individual bands because they enter as a weighting factor in the summation of the individual contributions. Hence, it is reasonable to assign the observed sample dependences to changes of the relative scattering rates. This is in agreement with the fact that other properties like specific heat, susceptibility and even resistivity (cf. inset of Fig. 8) do not obey such strong sample dependences as none of these properties depends this sensitively on the ratio of the scattering rates. In fact, the resistivity is a sum of the two (Eq. 12).
Finally, the fact that samples of the same batch exhibit almost identical behavior in allows us to surmise that the sample dependences are related to tiny differences in the actual stoichiometry caused by different crystal growth conditions. Such sensitivity on minute changes of the composition is known, for instance, for the heavy-fermion superconductor CeCu2Si2 where it leads to even more dramatic effects, which include drastic changes in the ground state.Steglich et al. (2001)
The sample dependences in are observed to set in around . Below they are fully developed and appear to be conserved down to the lowest temperatures as an offset between different samples. Consequently, the low-temperature Hall coefficient reflects the Fermi surface with sample-dependent, but fixed, weight of the individual sheets. This indicates that the Hall crossover, monitoring the Fermi surface reconstruction at the QCP, is robust against sample dependences as indeed observed Friedemann et al. (2009).
The comparison of the calculated Hall coefficient for the limiting cases of localized (4 core) and itinerant (4 RBC) 4 electrons in Tab. 4 shows that the inclusion of the Yb 4 states into the Fermi volume leads to a decrease of the Hall coefficient. Consequently, the finding of a jump from larger at zero field towards a lower value at elevated fields in isothermal scansPaschen et al. (2004); Friedemann et al. (2009) indicates a localization of the electrons on the low field side of the QCP in YbRh2Si2.
IV Conclusion
We have calculated the electronic band structure of YbRh2Si2 and YbIr2Si2 both with and without taking the Kondo scattering into account. Two bands were found to dominate the Hall coefficient. Both these bands are hole-like in the case of the -core calculations neglecting the Kondo effect but are of opposite character for the case of the renormalized band calculation. The derived results allow for an in-depth analysis of the Hall coefficient of the non-magnetic reference compound LuRh2Si2. We are able to quantitatively understand the temperature dependence of the Hall coefficient in terms of a two-band model.
Furthermore, we present Hall effect measurement on YbIr2Si2. Here, the temperature dependence of the Hall coefficient parallels many features known for YbRh2Si2. In particular, the anomalous contribution is seen to follow the expected trend. Remarkably, the Hall coefficient derived from the renormalized band calculation is in very good agreement with the measured value at lowest temperatures.
Finally, the sample dependences of the low-temperature Hall coefficient of YbRh2Si2 are discussed in terms of the two bands predicted by the calculations and seen in LuRh2Si2. The fact that the renormalized band calculation predicts the two bands to almost compensate each other indicates that the sample dependences arise from small changes of the scattering rates for the individual bands. These changes are ascribed to minute differences in the sample composition as samples of the same batch show almost identical behavior. More importantly, despite the strong sample dependencies our comprehensive study on YbRh2Si2 confirms that the distinct change of the Hall coefficient, found in isothermal scans across the quantum critical point marks a substantial change of the Fermi surface in the same way as expected in the Kondo breakdown scenario.Friedemann et al. (2009)
Acknowledgements.
The authors would like to thank P. Gegenwart, S. Kirchner, Q. Si, R. Valentí, T. Westerkamp and G. Wigger for fruitful discussions. This work was partially supported by NSF-DMR-0710492, NSF-PHY-0551164, FP7-ERC-227378 and DFG Forschergruppe 960.References
- Gegenwart et al. (2008) P. Gegenwart, Q. Si, and F. Steglich, Nature Phys. 4, 186 (2008).
- Custers et al. (2003) J. Custers, P. Gegenwart, H. Wilhelm, K. Neumaier, Y. Tokiwa, O. Trovarelli, C. Geibel, F. Steglich, C. Pépin, and P. Coleman, Nature 424, 524 (2003).
- Trovarelli et al. (2000) O. Trovarelli, C. Geibel, S. Mederle, C. Langhammer, F. M. Grosche, P. Gegenwart, M. Lang, G. Sparn, and F. Steglich, Phys. Rev. Lett. 85, 626 (2000).
- Gegenwart et al. (2002) P. Gegenwart, J. Custers, C. Geibel, K. Neumaier, T. Tayama, K. Tenya, O. Trovarelli, and F. Steglich, Phys. Rev. Lett. 89, 056402 (2002).
- Coleman et al. (2001) P. Coleman, C. Pépin, Q. Si, and R. Ramazashvili, J. Phys.: Condens. Matter 13, R723 (2001).
- Paschen et al. (2004) S. Paschen, T. Lühmann, S. Wirth, P. Gegenwart, O. Trovarelli, C. Geibel, F. Steglich, P. Coleman, and Q. Si, Nature 432, 881 (2004).
- Friedemann et al. (2009) S. Friedemann, N. Oeschler, S. Wirth, C. Krellner, C. Geibel, F. Steglich, S. Paschen, S. Kirchner, and Q. Si, to be published (2010).
- Fert and Levy (1987) A. Fert and P. M. Levy, Phys. Rev. B 36, 1907 (1987).
- Paschen et al. (2005) S. Paschen, T. Lühmann, S. Wirth, O. Trovarelli, C. Geibel, and F. Steglich, Physica B 359-361, 44 (2005).
- Hertz (1976) J. A. Hertz, Phys. Rev. B 14, 1165 (1976).
- Millis (1993) A. J. Millis, Phys. Rev. B 48, 7183 (1993).
- Moriya and Takimoto (1995) T. Moriya and T. Takimoto, J. Phys. Soc. Jpn. 64, 960 (1995).
- Si et al. (2001) Q. Si, M. S. Rabello, K. Ingersent, and J. L. Smith, Nature 413, 804 (2001), eprint cond-mat/0011477.
- Senthil et al. (2004) T. Senthil, M. Vojta, and S. Sachdev, Phys. Rev. B 69, 035111 (2004).
- Pepin (2007) C. Pepin, Phys. Rev. Lett. 98, 206401 (2007).
- Wigger et al. (2007) G. A. Wigger, F. Baumberger, Z. X. Shen, Z. P. Yin, W. E. Pickett, S. Maquilon, and Z. Fisk, Phys. Rev. B 76, 035106 (2007).
- Norman (2005) M. R. Norman, Phys. Rev. B 71, 220405(R) (2005).
- Danzenbacher et al. (2007) S. Danzenbacher, Y. Kucherenko, D. V. Vyalikh, M. Holder, C. Laubschat, A. N. Yaresko, C. Krellner, Z. Hossain, C. Geibel, X. J. Zhou, et al., Phys. Rev. B 75, 045109 (2007).
- Jeong (2006) T. Jeong, J. Phys.: Condens. Matter 18, 10529 (2006).
- Friedemann et al. (2008) S. Friedemann, N. Oeschler, C. Krellner, C. Geibel, S. Wirth, F. Steglich, S. Paschen, S. MaQuilon, and Z. Fisk, Physica B 403, 1251 (2008).
- Kohler et al. (2008) U. Kohler, N. Oeschler, F. Steglich, S. Maquilon, and Z. Fisk, Phys. Rev. B 77, 104412 (2008).
- White and Fulde (1981) R. M. White and P. Fulde, Phys. Rev. Lett. 47, 1540 (1981).
- Fulde and Jensen (1983) P. Fulde and J. Jensen, Phys. Rev. B 27, 4085 (1983).
- Zwicknagl (1992) G. Zwicknagl, Adv. Phys. 41, 203 (1992).
- Fulde et al. (2006) P. Fulde, P. Thalmeier, and G. Zwicknagl, Solid State Physics, vol. 60 (Academic Press, New York, 2006).
- Zwicknagl (1993) G. Zwicknagl, Phys. Scripta T49A, 34 (1993).
- Thalmeier and Zwicknagl (2005) P. Thalmeier and G. Zwicknagl, Handbook on the Physics and Chemistry of Rare Earths, vol. 34 (Elsevier Science Ltd, 2005).
- Pulst (1993) U. Pulst, Ph.D. thesis, TH Darmstadt (1993).
- Stockert et al. (2004) O. Stockert, E. Faulhaber, G. Zwicknagl, N. Stüßer, H. S. Jeevan, M. Deppe, R. Borth, R. Küchler, M. Loewenhaupt, C. Geibel, et al., Phys. Rev. Lett. 92, 136401 (2004).
- Thalmeier et al. (2005) P. Thalmeier, G. Zwicknagel, O. Stockert, G. Sparn, and F. Steglich, in Frontiers in Superconducting Materials, edited by A. V. Narlikar (Springer, Berlin, Heidelberg u.a., 2005), pp. 109–182.
- Zwicknagl (2007) G. Zwicknagl, J. Low Temp. Phys. 147, 123 (2007).
- Eremin et al. (2008) I. Eremin, G. Zwicknagl, P. Thalmeier, and P. Fulde, Phys. Rev. Lett. 101, 187001 (2008).
- Hossain et al. (2005) Z. Hossain, C. Geibel, F. Weickert, T. Radu, Y. Tokiwa, H. Jeevan, P. Gegenwart, and F. Steglich, Phys. Rev. B 72, 094411 (2005).
- Andersen (1975) O. K. Andersen, Phys. Rev. B 12, 3060 (1975).
- Skriver (1984) H. Skriver, The LMTO Method, vol. 41 (Springer-Verlag, Berlin, 1984).
- Albers et al. (1986) R. C. Albers, A. M. Boring, and N. E. Christensen, Phys. Rev. B 33, 8116 (1986).
- Barth and Hedin (1972) U. v. Barth and L. Hedin, J. Phys. C 5, 1629 (1972).
- Bradley and Cracknell (1972) C. J. Bradley and A. P. Cracknell, Mathematical Theory of Symmetry in Solids (Clarendon Press, Oxford, 1972).
- Jeong and Pickett (2006) T. Jeong and W. E. Pickett, J. Phys.: Condens. Matter 18, 6289 (2006).
- Hiess et al. (2006) A. Hiess, O. Stockert, M. Koza, Z. Hossain, and C. Geibel, Physica B: Condensed Matter 378-380, 748 (2006).
- Stockert et al. (2006) O. Stockert, M. Koza, J. Ferstl, A. Murani, C. Geibel, and F. Steglich, Physica B 378-380, 157 (2006).
- Zwicknagl (2009) G. Zwicknagl, in Properties and Applications of Thermoelectric Materials, edited by V. Zlatic and A. C. Hewson (Springer, 2009), NATO Science for Peace and Security Series.
- Gegenwart et al. (2006) P. Gegenwart, Y. Tokiwa, T. Westerkamp, F. Weickert, J. Custers, J. Ferstl, C. Krellner, C. Geibel, P. Kerschl, K. H. Müller, et al., New J. Phys. 8, 171 (2006).
- Rourke et al. (2008) P. M. C. Rourke, A. McCollam, G. Lapertot, G. Knebel, J. Flouquet, and S. R. Julian, Phys. Rev. Lett. 101, 237205 (2008), eprint 0807.3970.
- Knebel et al. (2006) G. Knebel, R. Boursier, E. Hassinger, G. Lapertot, P. G. Niklowitz, A. Pourret, B. Salce, J. P. Sanchez, I. Sheikin, P. Bonville, et al., J. Phys. Soc. Jpn. 75, 114709 (2006).
- Hurd (1972) C. M. Hurd, The Hall effect in metals and alloys (Plenum Press, New York, 1972).
- Friedemann et al. (2010) S. Friedemann, N. Oeschler, S. Wirth, F. Steglich, S. MaQuilon, and Z. Fisk, physica status solidi 247, 723 (2010), eprint 0906.2649.
- Hundley et al. (2004) M. F. Hundley, A. Malinowski, P. G. Pagliuso, J. L. Sarrao, and J. D. Thompson, Phys. Rev. B 70, 035113 (2004).
- Ferstl (2007) J. Ferstl, Ph.D. thesis, Technische Universität Dresden (2007).
- Nakajima et al. (2006) Y. Nakajima, K. Izawa, Y. Matsuda, K. Behnia, H. Kontani, M. Hedo, Y. Uwatoko, T. Matsumoto, H. Shishido, R. Settai, et al., J. Phys. Soc. Jpn. 75, 023705 (2006).
- Ishida et al. (2002) K. Ishida, K. Okamoto, Y. Kawasaki, Y. Kitaoka, O. Trovarelli, C. Geibel, and F. Steglich, Phys. Rev. Lett. 89, 107202 (2002).
- Steglich et al. (2001) F. Steglich, P. Gegenwart, C. Geibel, P. Hinze, M. Lang, C. Langhammer, G. Sparn, T. Tayama, O. Trovarelli, N. Sato, et al., in More is different: Fifty years of condensed matter physics, edited by N. P. Ong and R. N. Bhatt (Princeton University Press, Princeton, 2001), pp. 191–210.