ULAS J234311.93005034.0: A gravitational lens system selected from UKIDSS and SDSS
Abstract
We report the discovery of a new gravitational lens system. This object, ULAS J234311.93005034.0, is the first to be selected by using the new UKIRT Infrared Deep Sky Survey (UKIDSS), together with the Sloan Digital Sky Survey (SDSS). The ULAS J234311.93005034.0 system contains a quasar at redshift 0.788 which is doubly imaged, with separation 14. The two quasar images have the same redshift and similar, though not identical, spectra. The lensing galaxy is detected by subtracting point-spread functions from -band images taken with the Keck telescope. The lensing galaxy can also be detected by subtracting the spectra of the A and B images, since more of the galaxy light is likely to be present in the latter. No redshift is determined from the galaxy, although the shape of its spectrum suggests a redshift of about 0.3. The object’s lens status is secure, due to the identification of two objects with the same redshift together with a lensing galaxy. Our imaging suggests that the lens is found in a cluster environment, in which candidate arc-like structures, that require confirmation, are visible in the vicinity. Further discoveries of lenses from the UKIDSS survey are likely as part of this programme, due to the depth of UKIDSS and its generally good seeing conditions.
keywords:
gravitational lensing – quasars:individual:234311.90050341 Introduction
About 150 gravitational lens systems are now known in which a background galaxy or quasar is multiply imaged by the action of a foreground galaxy. Gravitational lens systems are potentially important because they probe the matter distribution of the lensing galaxy independently of whether the matter is light emitting (e.g. Cohn et al. 2001; Rusin et al. 2002; Rusin & Kochanek 2005; Koopmans et al. 2006; Gavazzi et al. 2007). In cases where the background source is variable, as in the case of lensed quasars, time delays can also potentially be used for determination of the Hubble constant according to the method of Refsdal (1964); for recent reviews see e.g. Courbin (2003), Kochanek & Schechter (2004) and Jackson (2007). Lensed quasars can also be used for studies of quasar structure via microlensing studies (e.g. Agol & Krolik 1999; Ofek & Maoz 2003; Morgan et al. 2007).
For both statistical purposes, and to locate objects important for particular problems, larger samples are needed. Currently the largest sample of lenses is the SLACS survey (Bolton et al. 2006), which is based on the Sloan Digital Sky Survey (SDSS, York et al. 2000) and relies on selecting SDSS spectra which contain two different redshift systems at approximately the same spatial position. It is mainly sensitive to lensed extended galaxies, and has proved to be important in tackling the problem of mass distributions in lens galaxies (Koopmans et al. 2006). The other large (20 lens) samples include CLASS, a radio-selected survey (Myers et al. 2003, Browne et al. 2003) and the SDSS quasar survey (Inada et al. 2004, Inada et al. 2005, Oguri et al. 2006). Although individual lenses from these surveys do not always provide good constraints on the mass distribution in the lensing galaxy, they can be used for determination and also for statistical studies (e.g. Chae et al. 2003; Ofek, Rix & Maoz 2003; Mitchell et al. 2005; Oguri 2007; Oguri et al. 2008).
As already demonstrated, the Sloan Digital Sky Survey (SDSS, York et al. 2000) is potentially a very important resource, due to its wide-area sky coverage and consequent large number of quasars. The latest catalogue from the SDSS (Schneider et al. 2005) contains 77429 quasars. With typical lensing rates (e.g. Turner, Ostriker & Gott 1984) this might be expected to yield more than 100 gravitational lenses. Unfortunately, many of these lenses will have relatively small separations, as high-resolution searches with radio interferometers reveal a median separation of between 1″and 15, and substantial numbers with separations smaller than 1″. The combination of seeing effects (SDSS imaging has a median PSF width of 14 FWHM) and weak secondary images mean that moderate- to small-separation lenses will be difficult to detect directly. Nevertheless, 24 SDSS quasar lenses are known (Oguri et al. 2006, Inada et al. 2007) from searches at larger separation. At smaller separation attempts have been made to overcome the difficulties, including the use of colour selection to identify candidates which contain light from both quasar and lens galaxy (Ofek et al. 2007) and the use of radio catalogues together with optical information from SDSS (Jackson & Browne 2007). Here we report an alternative approach, using new large-area public infrared surveys.
The UK Infrared Telescope (UKIRT) is currently carrying out a number of large surveys in multiple (YJHK) infra-red bands, some in the areas surveyed by the SDSS, with the collective name of the UKIRT Infrared Deep Sky Survey (UKIDSS). The UKIDSS project is defined in Lawrence et al (2007). UKIDSS uses the UKIRT Wide Field Camera (WFCAM; Casali et al, 2007) and a photometric system described in Hewett et al (2006). The pipeline processing and science archive are described in Irwin et al (2008, in preparation) and Hambly et al (2008).
Of particular interest here is the Large Area Survey (LAS), which will eventually cover 4028 square degrees to a depth of =18.2 in seeing of 12 and with median seeing below 1″. This 25–50% improvement over SDSS seeing is vital for the discovery of a gravitational lens whose separation is just smaller than the SDSS point spread function. Moreover, the colour information using the combination of optical and infrared bands may also be important in prioritising candidates and deciding on their lensing nature. This paper presents the first results of an attempt to use SDSS and UKIDSS together for lens discovery, and further work will extend this to the entire SDSS quasar sample. Here we report on the selection of a joint UKIDSS-SDSS sample, resulting in discovery of a probable gravitational lens, ULAS J234311.93005034.0. In Section 2 we describe the candidate selection; in section 3 we describe follow-up observations with Keck imaging and spectroscopy of ULAS J234311.93005034.0, and briefly discuss the results in section 4.
2 Selection
We used the sample of 77429 quasars from the SDSS/Data Release 5 (DR5, Schneider et al. 2007); this data release has a footprint of approximately 8000 square degrees. Within 5′′ of each object we searched for UKIDSS sources using the -band catalogue from the UKIDSS Large Area Survey Data Release 2 (Warren et al. 2007) which has a footprint of 685 square degrees. 6707 objects are found which have cross-matches in the UKIDSS survey, which represent the vast majority of SDSS quasars within the UKIDSS DR2 area. The UKIDSS DR2 area covers approximately either side of the equator from right ascensions of approximately 0h-3h30m and 22h30m-24h, with smaller, mostly equatorial fields between 08h and 16h.
UKIDSS -band images of all of these cross-matched objects were then individually inspected by eye. Objects were selected for further investigation if they appeared to have extensions or secondary structure within approximately 2″, as this is the range within which selection using SDSS alone is likely to become incomplete. In cases of doubt, all available UKIDSS wavelength bands were scrutinised to check that secondary structure was visible in more than one colour. No distinction was made on relative colour of primary and secondary, as it is possible that the light of one of the images is dominated by light from the lensing galaxy, which is expected to be closer to the weaker image.
From the initial sample of 6707 quasars, 56 candidates were identified as possible gravitational lenses. Of these, the one known lens (J122608.0000602, Inada et al. 2008), is recovered as a candidate111The footprint of the subsequent release, DR3, of UKIDSS contains three known lenses, all of which were recovered as candidates.. Two other objects were in the list of candidates selected on the basis of SDSS colours by Oguri et al. (2007), one of which (J001342.4002413) has already been ruled out by followup observations.
3 ULAS J234311.9005034
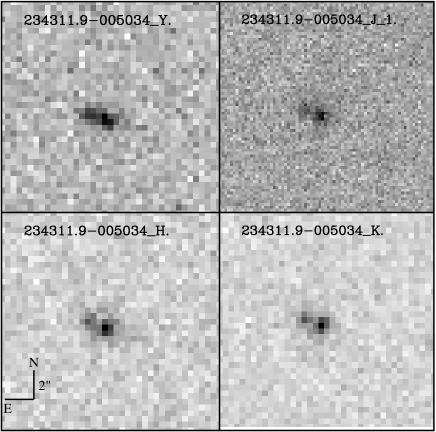
One of the promising candidates identified in the selection by eye was ULAS J234311.93005034.0, a double source with approximate separation of 14. This object has a K-band magnitude of 16.5 and an optical “best-PSF” -band magnitude of 20.3, from the UKIDSS and SDSS surveys respectively. Selected UKIDSS and SDSS (-band) images are shown together in Figure 1. The object lies in the FIRST 20-cm radio survey area (Becker et al. 1995), but no radio counterpart is detected at a level of 1 mJy (5).
 |
 |
3.1 Keck imaging
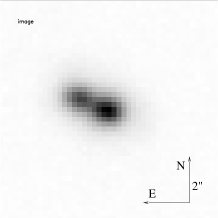
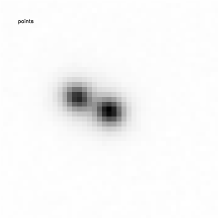
Follow-up imaging and spectroscopy was performed using the Keck-I telescope and the Low-Resolution Imaging Spectrograph – Atmospheric Dispersion Compensator (LRIS–ADC; Oke et al. 1995) on the night of 2008 January 04. Imaging exposures totalling 1140 s were obtained in the filter, and 1500 s in the filter. The seeing at the time, measured from nearby stars, was about 1″. Fig. 2 shows the Keck images in both filters. In both figures, the object is clearly visible as a double source, confirming the impression from the UKIDSS survey images.
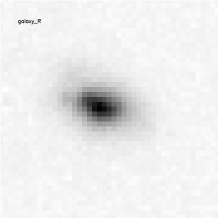
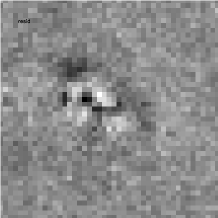
The -band image was fitted using the galfit software of Peng et al. (2002) using two point spread functions, derived from a nearby isolated and unsaturated stellar image, a Sersic profile, and a flat background to represent the sky. The positions and fluxes of the two PSF images were allowed to vary, as were the position, flux, position angle, effective radius and Sersic index of the galaxy. The resulting fits are shown in Fig. 3, and give an image separation of 14 between two point sources differing by about 20% in flux. It can be seen, by comparing the raw image and the fitted points, that additional flux is required in excess of the point sources in order to fit the sources properly. According to the fit, this can be provided by a galaxy slightly brighter than either image, whose major axis lies close to the line joining the two images. Table 1 shows the fitted parameters of the galaxy and lensed images.
 |
 |
 |
 |
A similar attempt was made to fit the -band image, but the fit fails to represent both the lensed images and the galaxy. This is likely to be because the galaxy is relatively weaker, and the fit collapses to a state in which both the galaxy and one of the images are at the same position. However, if we constrain the position of the centre of the galaxy in the -band to be the same as that for the -band, we obtain a good fit in which the fitted position angle of the galaxy agrees well with that in the -band image. Accordingly, Table 1 presents this fit to the -band image. The discrepancy between the two colour bands is likely to be due to the large errors resulting from the attempt to fit components separated from each other by distances slightly larger than the seeing FWHM.
| -band | -band | ||
| Image A | Magnitude | 20.60 | 20.35 |
|---|---|---|---|
| Position /″ | (0.0,0.0) | (0.0,0.0) | |
| Image B | Magnitude | 20.78 | 20.91 |
| Position /″ | (1.39,0.59) | (1.21,0.51) | |
| Galaxy | Magnitude | 19.94 | 21.83 |
| Position /″ | (0.40,0.20) | (0.40,0.20)∗ | |
| PA | 72 | 68 | |
| Axis ratio | 0.43 | 0.70 | |
| /″ | 094 | 154 | |
| Sersic index | 1.56 | 0.48 |
Although the quasar is included in the SDSS DR5 quasar catalogue (Schneider et al. 2007), its SDSS magnitude of , after extinction correction, is fainter than the magnitude limit of the SDSS quasar lens survey (SQLS, Inada et al. 2003, 2005, 2008; Oguri et al. 2006) and is therefore not part of the statistical SQLS sample.
3.2 Keck spectroscopy
Spectra were obtained, also using the Keck-I telescope, on the night of 2008 January 11. For the spectroscopy the 400/3400 grism on the blue arm of LRIS (central wavelength 440 nm), together with the 400/8500 grating on the red arm (central wavelength 770 nm) and a dichroic cutting at about 560 nm, were used. The total exposure time was 1400 s, and a 07 slit was used throughout. Data reduction followed standard procedures including bias subtraction with 10 coadded bias frames and flatfielding from flat-field frames made using a halogen lamp. The extracted, sky-subtracted spectra are shown in Fig. 4. The two QSO images clearly have the same redshift, which is determined to be 0.7880.001 using the narrow [Oiii] line at 500.7 nm. The spectra are, however, not identical. If we use the fit to the -band image described above to give the ratio of the fluxes of the quasar images, we can recover a spectrum of the galaxy alone; this is also shown in Fig. 4. This is obviously redder than the quasar images, but there is no obvious emission or absorption line. The general shape of the spectrum suggests an upturn due to a 4000Å break at around 5500Å, implying a redshift of about 0.3; in this case, deeper exposures would be needed to detect the Ca H/K absorption lines.

4 Discussion and conclusions
The detection of two images with the same redshift, together with clear evidence for a lensing galaxy, convinces us that ULAS J234311.93005034.0 is a lens system. Further circumstantial evidence can be obtained by considering the expected brightness of the lens galaxy from the image separation and the Faber-Jackson relation (Faber & Jackson 1976). If we use the lens separation together with the Faber-Jackson relation as calibrated for a sample of gravitational lenses by Rusin et al. (2003), and assume a lens redshift of 0.32, we obtain an expected -band magnitude of 19.7, very close to the actual value.
Nevertheless, it is obvious that the spectra (Fig. 4) are not identical, despite the very similar redshift. The continuum shape is different, but as we have seen it is plausible that this is due to different levels of contamination from the lensing galaxy. A complicating factor, however, is that there may be differential reddening between images A and B. This can be deduced from ratios of the broad emission line fluxes between image A and B, which decrease systematically with wavelength (Table 2). If this reddening takes place in the lensing galaxy, and if its redshift is about 0.3, this implies an associated of about 0.7 for a Galactic extinction law.
| Line/rest wavelength | Image A | Image B | Ratio (A/B) |
|---|---|---|---|
| Ciii] 190.9 nm (narrow) | 7.2 | 3.3 | 2.19 |
| Ciii] 190.9 nm (broad) | 26.4 | 20.0 | 1.32 |
| Mgii 279.8 nm (narrow) | 9.7 | 5.2 | 1.86 |
| Mgii 279.8 nm (broad) | 9.5 | 6.3 | 1.51 |
| H 486.1 nm | 6.4 | 9.0 | 0.72 |
| [Oiii] 500.7 nm | 4.2 | 6.2 | 0.68 |
Assuming that the reddening occurs in the lensing galaxy, it is then puzzling why the fit to the Keck images places the lensing galaxy closer to A than to B. There are precedents for this (e.g. CLASS B0218+357; Jackson, Xanthopoulos & Browne 2000, HE1104185; Wisotzki et al. 1993) but an alternative explanation is that the fitted centroid of the galaxy is in error. HST imaging would be useful to resolve this matter fully. Reddening of the quasar continuum is difficult to assess, due to contamination of both A and B spectra by light from the lensing galaxy. An additional complication is the possibility of microlensing in the lensing galaxy, which may affect both the quasar continua and, if the broad line region is small enough, the broad line fluxes. It is becoming increasingly clear (e.g. Kochanek et al. 2007, Morgan et al. 2006, Keeton et al. 2006, Gaynullina et al. 2005) that microlensing is important in understanding relative fluxes in images of lensed quasars.
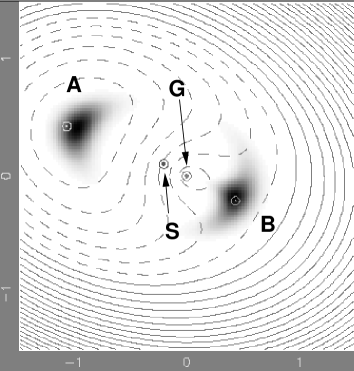
It is possible to make a lens model to describe the system, although it suffers from a lack of constraints. The available constraints are the image positions and fluxes (assuming we ignore effects of reddening or microlensing), and the galaxy position is known. We assume that positions are known to 10 mas and fluxes to 10%, and use a singular isothermal ellipsoid to represent the mass profile of the galaxy. Fixing the ellipticity at 0.5 and the position angle at the same as that of the light distribution, but varying the lens Einstein radius, gives =595/2. If in addition we allow the ellipticity to vary, we obtain =48/1 at the cost of an unlikely solution of an almost circular galaxy. If we once more fix the ellipticity at 0.5, but allow two extra free parameters to represent external shear, we remove all the degrees of freedom and therefore obtain an exact fit (Fig. 5). This fit has a very large shear magnitude (0.34) at a position angle of , and predicts a time delay of 18 days for =70 kms-1Mpc-1, with the A image varying first. Interestingly, the predicted shear direction is within a few degrees of the direction of the nearest object, a galaxy about 10″ away and slightly west of south.
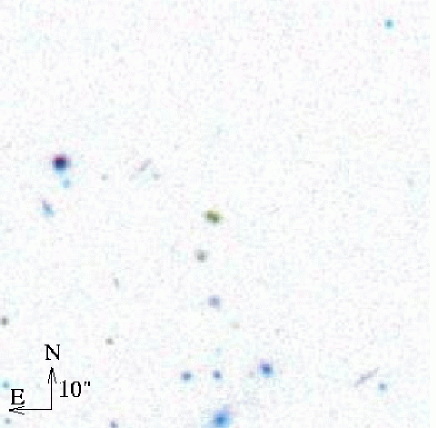
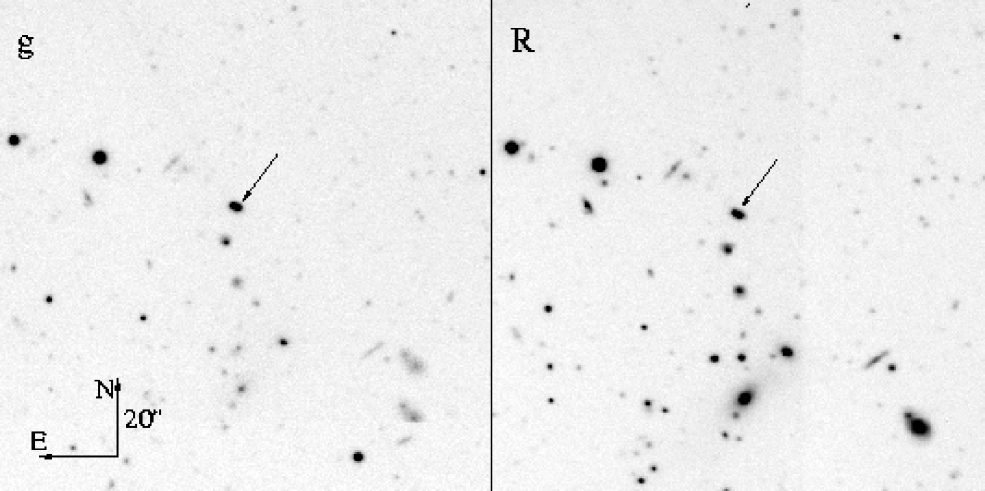
That there may be an effect of the environment on the lens model is consistent with the appearance of the Keck images. The ULAS J234311.93005034.0 system appears to lie at the northern end of a cluster of galaxies, the brightest one of which lies about 49″ South. The redshift of this bright galaxy appears in the SDSS database as 0.316, so it is at least plausible that the ULAS J234311.93005034.0 lens galaxy redshift lies at around this value. There are a a number of arc-like structures in this cluster, suggestive of weak lensing of background objects (see Fig. 2). The velocity dispersion of the cluster implied by the presence of a shear of 0.34 at the position of the gravitational lens is large (1400 km s-1 assuming an isothermal profile for the cluster) but detailed modelling with additional constraints is needed in order to make a serious estimate of the cluster mass.
The discovery of ULAS J234311.93005034.0 suggests that the use of large-area surveys with good spatial resolution is a good way to discover lenses in existing surveys of quasars such as the SDSS quasar sample. The increasing coverage of the UKIDSS survey means that ultimately between 60000-70000 high-resolution images of quasars should be available. For typical angular separation distributions of existing lens samples, this should allow the existing sample of 24 SDSS quasar lenses to be expanded by at least a factor 2, and possibly more.
References
Agol E., Krolik J., 1999, ApJ 524, 49
Becker R.H., White R.L., Helfand D.J., 1995, ApJ 450, 559
Bolton A.S., Burles S., Koopmans L.V.E., Treu T., Moustakas L.A. 2006, ApJ, 638, 703.
Browne I.W.A. et al. 2003, MNRAS, 341, 13.
Casali M., et al., 2007, A&A 467, 777.
Chae K.H. 2003, MNRAS, 346, 746.
Cohn J.D., Kochanek C.S., McLeod B.A., Keeton C.R. 2001, ApJ, 554, 1216.
Courbin F., 2003, astro-ph/0304497.
Faber S.M., Jackson R.E., 1976, ApJ, 204, 668
Gavazzi R., Treu T., Rhodes J.D., Koopmans L.V.E., Bolton A.S., Burles S., Massey R.J., Moustakas L.A. 2007, ApJ, 667, 176.
Gaynullina E.R., et al., 2005, A&A 440, 53
Hambly N., et al., 2008, MNRAS 384, 637
Hewett P.C., Warren S.J., Leggett S.K., Hodgkin S.T., 2006, MNRAS, 367, 454
Inada N., et al., 2003, Nature 426, 810
Inada N., et al. 2005, AJ, 130, 1967.
Inada N., Oguri M., Becker R.H., White R.L., Kayo I., Kochanek C.S., Hall P.B., Schneider D.P., York D.G., Richards G.T. 2007, AJ, 133, 206.
Inada N., et al. 2008, AJ 135, 496
Jackson N., Browne I.W.A. 2007, MNRAS, 374, 168.
Jackson N., Xanthopoulos E., Browne I.W.A. 2000, MNRAS, 311, 389.
Jackson N. 2007, LRR, 10, 4.
Jester S., et al., 2005, AJ, 130, 873.
Keeton C.R., Burles S., Schechter P.L., Wambsganss J., 2006, ApJ 639, 1
Kochanek C.S., Schechter P.L. 2004, Measuring and Modelling the Universe, Carnegie Obs. Centennial Symposium, ed. W. Freedman, CUP, p.117.
Kochanek C.S., Dai X., Morgan C., Morgan N., Poindexter S., in Statistical Challenges in Modern Astronomy IV, 2007, eds Babu G.J. et al., San Francisco:ASP.
Koopmans L.V.E., Treu T., Bolton A.S., Burles S., Moustakas L.A. 2006, ApJ, 649, 599.
Lawrence A., et al. 2007, MNRAS, 379, 1599.
Mitchell J.L., Keeton C.R., Frieman J.A., Sheth R.K. 2005, ApJ, 622, 81.
Morgan C.W., et al., 2007, ApJ submitted, astro-ph/0710.2552
Morgan C.W., Kochanek C.S., Morgan N.D., Falco E.E., 2006, ApJ 647, 874
Myers S.T., et al. 2003, MNRAS, 341, 1.
Oke J.B., et al., 1995, PASP 107, 375
Ofek E.O., Maoz D., 2003, ApJ 594, 101
Ofek E.O., Rix H.-W., Maoz D., 2003, MNRAS 343, 639
Ofek E.O., Oguri M., Jackson N., Inada N., Kayo I. 2007, MNRAS, 382, 412.
Oguri M., et al. 2006, AJ, 132, 999.
Oguri M. 2007, ApJ, 660, 1.
Oguri M. et al. 2008, AJ, 135, 512
Peng C.Y. Ho L.C., Impey C.D., Rix H. 2002, AJ 124, 266.
Refsdal S. 1964, MNRAS, 128, 307.
Rusin D., Kochanek C.S. 2005, ApJ, 623, 666.
Rusin D., Norbury M., Biggs A.D., Marlow D.R., Jackson N.J., Browne I.W.A., Wilkinson P.N., Myers S.T. 2002, MNRAS, 330, 205.
Rusin D., et al., 2003, ApJ, 587, 143
Schneider D.P., et al. 2007, AJ, 134, 102.
Turner E.L., Ostriker J.P., Gott J.R., 1984, ApJ, 284, 1.
Warren S.J., et al. 2007, MNRAS, 375, 213.
Wisotzki L., Koehler T., Kayser R., Reimers D., 1993, A&A, 278, L15
York D.G., et al. 2000, AJ, 120, 1579.
Acknowledgements
We would like to thank the Kavli Institute for Theoretical Physics and the organizers of the KITP workshop “Applications of Gravitational Lensing” for hospitality. This work began at this KITP workshop. We thank an anonymous referee for useful comments on the manuscript. The research was supported in part by the European Community’s Sixth framework Marie Curie Research Training Network Programme, contract no. MRTN-CT-2004-505183, by the National Science Foundation under grant no. PHY05-51164, and by the Department of Energy contract DE-AC02-76SF00515. This work is based on data obtained as part of the UKIRT Infrared Deep Sky Survey, UKIDSS (www.ukidss.org). Some of the data presented herein were obtained at the W.M. Keck Observatory, which is operated as a scientific partnership among the California Institute of Technology, the University of California and the National Aeronautics and Space Administration. The Observatory was made possible by the generous financial support of the W.M. Keck Foundation. The authors wish to recognize and acknowledge the very significant cultural role and reverence that the summit of Mauna Kea has always had within the indigenous Hawaiian community. We are most fortunate to have the opportunity to conduct observations from this mountain. Funding for the Sloan Digital Sky Survey (SDSS) and SDSS-II has been provided by the Alfred P. Sloan Foundation, the Participating Institutions, the National Science Foundation, the U.S. Department of Energy, the National Aeronautics and Space Administration, the Japanese Monbukagakusho, and the Max Planck Society, and the Higher Education Funding Council for England. The SDSS Web site is http://www.sdss.org/. The SDSS is managed by the Astrophysical Research Consortium (ARC) for the Participating Institutions. The Participating Institutions are the American Museum of Natural History, Astrophysical Institute Potsdam, University of Basel, University of Cambridge, Case Western Reserve University, The University of Chicago, Drexel University, Fermilab, the Institute for Advanced Study, the Japan Participation Group, The Johns Hopkins University, the Joint Institute for Nuclear Astrophysics, the Kavli Institute for Particle Astrophysics and Cosmology, the Korean Scientist Group, the Chinese Academy of Sciences (LAMOST), Los Alamos National Laboratory, the Max-Planck-Institute for Astronomy (MPIA), the Max-Planck-Institute for Astrophysics (MPA), New Mexico State University, Ohio State University, University of Pittsburgh, University of Portsmouth, Princeton University, the United States Naval Observatory, and the University of Washington.