Radio Observations of the Hubble Deep Field South Region IV: Optical Properties of the Faint Radio Population
Abstract
The Australia Telescope Hubble Deep Field-South (ATHDFS) survey of the Hubble Deep Field South reaches sensitivities of 10 Jy at 1.4, 2.5, 5.2 and 8.7 GHz, making the ATHDFS one of the deepest surveys ever performed with the Australia Telescope Compact Array. Here we present the optical identifications of the ATHDFS radio sources using data from the literature. We find that 66% of the radio sources have optical counterparts to mag. Deep HST imaging of the area identifies a further 12% of radio sources. We present new spectroscopic observations for 98 of the radio sources, and supplement these spectroscopic redshifts with photometric ones calculated from 5-band optical imaging. The host galaxy colors and radio-to-optical ratios indicate that low luminosity (or “radio quiet”) AGN make up a significant proportion of the sub-mJy radio population, a result which is in accordance with a number of other deep radio studies. The radio-to-optical ratios of the bright (mJy) sources is consistent with a bimodal distribution.
1 Introduction
Many massive galaxies in the local universe harbor a super-massive black hole, and this implies that most, if not all, galaxies hosted an AGN at some point in time (Kormendy & Richstone, 1995). It is now thought that star formation and AGN are linked by some mechanism collectively known as“AGN-driven feedback” (e.g. Croton et al., 2006). Radio emission can be produced by both AGN and starforming processes, and thus radio surveys provide a unique window to study the cosmic evolution of both these important processes.
Early radio surveys ( mJy) found objects with powerful radio emitting jets, which are generally termed ”radio-loud” AGN. Recent deep radio surveys have found that the Euclidean-normalised radio source counts flatten below about 1 mJy and this cannot be explained by a population of radio-loud AGN. A nonevolving population of local () low-luminosity radio galaxies (Wall et al., 1986), strongly evolving normal spirals (Condon, 1984, 1989), and starburst galaxies (Windhorst et al., 1985; Rowan-Robinson et al., 1993) have all been suggested to explain this new population. The faint radio source counts have been successfully modelled by starforming galaxies (Seymour et al., 2004; Huynh et al., 2005). However, it has also been shown that low luminosity radio quiet AGN can also contribute to the flattening of the source count at sub-mJy levels (Jarvis & Rawlings, 2004).
It is now clear that the sub-mJy population is made up of both starforming galaxies and low luminosity AGN, but surprisingly little is known about the exact mix. This is because the optical counterparts to the radio sources are faint and hence spectroscopic followup is difficult and/or requires massive amounts of telescope time. Pioneering work in the Hubble Deep Field North (HDFN) by Richards et al. (1999) found that roughly 60% of sub-mJy ( mJy) sources are associated with bright () disk galaxies, 20% are low-luminosity AGN, and the remaining 20% have no counterpart brighter than . Deep Advanced Camera for Surveys (ACS) imaging () of the Great Observatories Origins Deep Survey (GOODS) South field identified optical counterparts to 90% of the faint ( mJy) radio sources, and about 60% of the GOODS radio sources with spectroscopic information have a spectrum consistent with star formation processes (Afonso et al., 2006). Simpson et al. (2006) find that 90% of mJy radio sources are identified to in the Subaru/XMM-Newton Deep Field and show that faint and bright radio sources have similar optical colors. This suggests that many of the faint radio sources are passively evolving ellipticals. Using a highly spectroscopically complete (70%) sample of faint radio sources in the HDFN, Barger et al. (2007) confirmed that the optical hosts do not vary much with redshift or radio flux density. The optical host properties, coupled with X-Ray information, provide evidence for a significant proportion of low luminosity or obscured AGN in the faint radio source population (Simpson et al., 2006; Barger et al., 2007). Recent work using radio-based properties such as morphology, the near-IR-to-radio flux density ratio, the mid-IR-to-radio flux density ratio, and radio luminosity, has found that AGN still contribute a third of the total 1.4 GHz source counts at the faintest flux densities (50Jy) (Seymour et al. submitted).
The Hubble Deep Field South (HDF-S) is an ideal field for studying radio sources because of the wealth of publicly available data. This field has been studied in wavelengths from the radio to UV-optical, and spectroscopic and photometric redshifts are available for thousands of galaxies in the HDF-S and surrounding regions (Teplitz et al., 2001; Rudnick et al., 2001; Labbé et al., 2003).
Radio observations of the HDF-S were made between 1998 and 2001 with the Australia Telescope Compact Array (ATCA) using all four available frequency bands. Between 100 and 300 hr of observing at each band yielded images at 1.4, 2.5, 5.2, and 8.7 GHz with maximum sensitivities of 10 Jy rms. A detailed description of the observations, data reduction, and initial results was given by Norris et al. (2005) (hereafter Paper I). The full 1.4 GHz catalog and radio source counts were presented in Huynh et al. (2005) (hereafter Paper II). The 2.5, 5.2 and 8.7 GHz catalogs were presented in Huynh et al. (2007a) (hereafter Paper III).
In this paper we present the optical properties of the Australia Telescope Hubble Deep Field South (ATHDFS) radio sources. This paper is organized as follows. In Section 2 we summarise the existing radio and optical images, and present the optical counterparts to the ATHDFS radio sources. Spectroscopic observations by our team and others are presented in Section 3. In Section 4 we present the photometric redshifts derived from the optical imaging. We discuss the photometric properties of the faint radio population in Section 5.
We assume a Hubble constant of 71 km s-1 Mpc-1, and throughout this paper.
2 Imaging Data
2.1 Radio
The radio observations and data reduction are detailed in Papers I to III, but here we provide a brief summary. The observations consist of single pointings centered on R.A. = 22 33 25.96 , decl. = -60 38 09.0 (J2000.0) (1.4 and 2.5 GHz), and R.A. = 22 32 56.22, decl. = -60 33 02.7 (J2000.0) (5.2 and 8.7 GHz). The 5.2 and 8.7 GHz observations are centered on the HST WFPC field, while the 1.4 and 2.5 GHz observations were pointed halfway between the WFPC field and a bright confusing source to allow the bright source to be well cleaned from the 1.4 and 2.5 GHz images.
We used a wide variety of ATCA configurations to maximize u-v coverage. The correlator was set to continuum mode (2 x 128 MHz bandwidth), with each 128 MHz bandwidth divided into 32 x 4 MHz channels. The primary flux density calibrator is PKS B1934-638, while secondary gain and phase calibrations were taken throughout our observations using both PKS B2205-636 and PKS B2333-528.
The final images have a maximum sensitivity of 11.0, 10.4, 7.8, 11.0 Jy rms at 1.4, 2.5, 5.2 and 8.7 GHz, respectively. The size of the images vary because the primary beam of the ATCA is smaller at high frequencies. We catalogued 1.4 GHz sources to 20 arcmin distance from the image center, while for 8.7 GHz we reach 3.5 armin distance. Sources were catalogued to a local S/N ratio of 5 at 1.4,, 5.2 and 8.7 GHz, and 5.5 at 2.5 GHz. A consolidated catalogue with the radio sources matched across all four bands was presented in Paper III, comprising 473 individual sources.
2.2 CTIO Wide Field Images
Palunas et al. (2000) observed the Hubble Deep Field South (HDFS) region using the Big Throughput Camera (BTC) on the CTIO 4 m during September 1998. Images were taken in the Sloan Digital Sky Survey u, Johnson B and V, and Cousins R and I filters. The BTC has a pixel size of 0.43 arcsec and covers a total area of 34.8 34.8 arcmin. Individual exposures were dithered during the observations to fill in the gaps between the BTC CCDs. This resulted in a contiguous field of approximately 44 44 arcmin, centered on the main HDFS.
Catalogues of individual sources were compiled by Palunas et al. (2000) using SExtractor (Bertin & Arnouts, 1996). Palunas et al. (2000) fix their photometric system to the Johnson UBV and Cousins RI system (Landolt, 1992). The sensitivity of the images differ, with the 5 detection limits for point-like objects in each band range quoted as 24 u 25, 25.6 B 26.6, 25 V 26, 25 R 25.8, and 23.5 I 24.4. About 50% of the area of each image has a sensitivity limit at the bright end of the range.
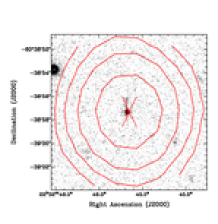
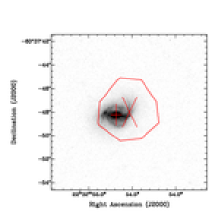
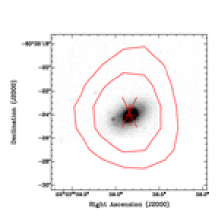
We cross-matched the combined ATHDFS catalogue (Paper III) against the CTIO wide field images. To aid in choosing a matching radius we plot the number of candidate matches and the number of chance coincidences against radio-optical offset in Figure 1. Here the number of chance coincidences is determined from the CTIO source density (70,409 catalogued sources over 0.588 deg2). Figure 1 shows that the number of chance coincidences matches the number of candidates at a radius of 1.8 arcsec. We therefore choose this distance to be our matching radius.
For the worst case scenario of SN=5 and seeing of 2 arcsec FWHM, we estimate the CTIO positional uncertainty to be 0.4” in each coordinate. This is similar in scale to the CTIO pixel size. In the ATHDFS, at 1.4 GHz, the average uncertainty is 0.36” and 0.43” in RA and Dec, respectively. We thus expect the offsets between our radio positions and the CTIO positions to have an rms value of approximately ” in each coordinate, neglecting any offsets between the coordinate frames. Figure 2 shows the offsets between the radio and optical positions, which indicates there is a possible RA offset in the ATHDFS and CTIO image coordinates of 0.5 arcsec. For probable matches closer than 2 arcsec, the mean offset in RA, , is arcsec and the rms is 0.56 arcsec, where . Similarly, the mean offset in Dec is 0.03 arcsec, with an rms of 0.60 arcsec. We correct for the coordinate shifts between the ATHDFS and CTIO images by shifting the CTIO positions by these mean offsets in RA and Dec before the final matching. The mean offset in RA and Dec after shifting the CTIO coordinates is 0.02 and 0.00 arcsec, respectively, with rms values of 0.56 and 0.64 arcsec (Figure 3). This agrees well with the above predicted rms of 0.6” in each coordinate. Our matching radius of 1.8 arcsec is equivalent to about 2.2, and so should include 97% of the true IDs.
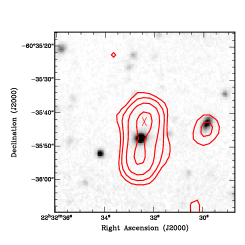
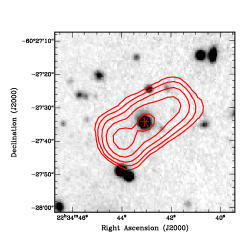
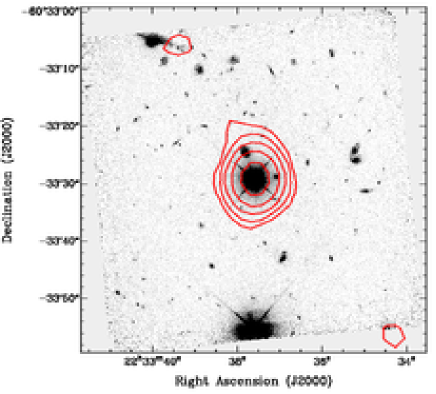
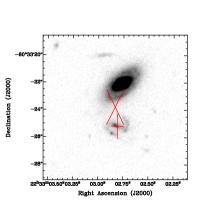
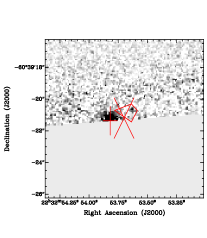
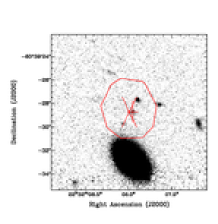
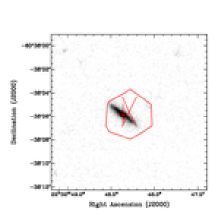
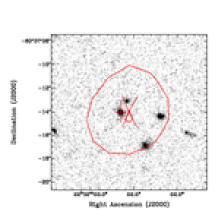
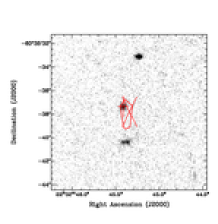
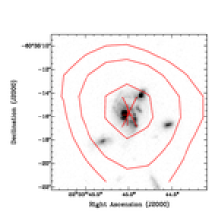
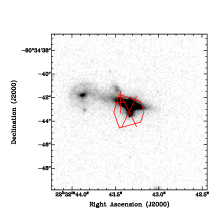
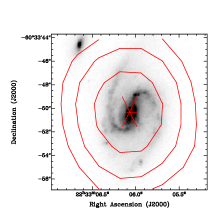
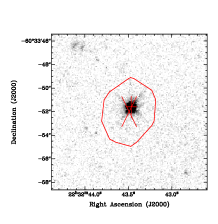
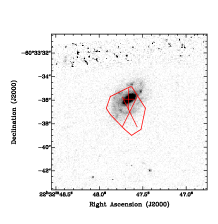
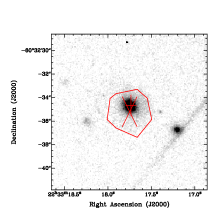
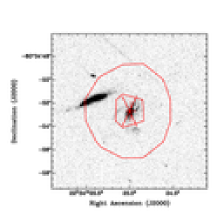
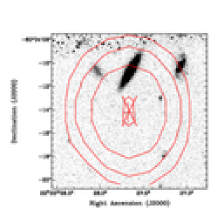
The I band CTIO image was examined at all radio positions. In 11 cases the optical counterpart is close to a bright star, so the photometry for these sources is not reliable. These instances are flagged in the catalogue. For radio sources which comprise a multiple component radio source (see Paper II) the optical counterpart maybe positioned between the two or more sources, i.e. at the radio centroid. The two cases where this occurred (multiple sources ATHDFS_J223232.4603542 and ATHDFS_J223443.9-602739) are shown in Figure 4.
The number of ATHDFS sources with a CTIO optical counterpart is 306. Eight of the radio sources lie outside of the CTIO image area, so out of a possible 465 radio sources, 66% have optical counterparts in the CTIO images. We expect 44 chance coincidences using the CTIO source density of 119,740 deg-2 and total search area of . To derive another estimate of the number of chance coincidences we shifted the radio source positions north by 0.5 arcmin and re-applied the matching program. From this method we find 55 chance coincidences, which is consistent with our first estimation. We therefore conclude that up to 50/315, or 16%, of our CTIO matches could be spurious.
The results of cross-matching the full ATHDFS catalogue against the CTIO imaging is presented in Table Radio Observations of the Hubble Deep Field South Region IV: Optical Properties of the Faint Radio Population. A description of Table Radio Observations of the Hubble Deep Field South Region IV: Optical Properties of the Faint Radio Population is as follows:
Column (1) — ATHDFS source name.
Column (2) — CTIO flag. “YES” indicates there is a CTIO counterpart within the 1.8 arcsec matching radius. “NO” means there is no CTIO counterpart within the 1.8 arcsec matching radius. “S” indicates there is a nearby bright star which may affect the photometry. OUT indicates the source lies outside of the CTIO images.
Column (3) — CTIO source ID, corresponding to the source number from the CTIO catalogue (Palunas et al. APJS, submitted).
Column (4) — U magnitude.
Column (5) — rms error in U magnitude.
Column (6) — B magnitude.
Column (7) — rms error in B magnitude.
Column (8) — V magnitude.
Column (9) — rms error in V magnitude.
Column (10) — R magnitude.
Column (11) — rms error in R magnitude.
Column (12) — I magnitude.
Column (13) — rms error in I magnitude.
Column (14) — CTIO photometric redshift.
Column (15) — CTIO photometric redshift uncertainty.
2.3 Hubble Space Telescope Images
Images of the Hubble Deep Field South were obtained by all three instruments on board the Hubble Space Telescope in 1998: the Wide Field Planetary Camera 2 (WFPC2), the Near Infrared Camera and Multi Object Spectrograph (NICMOS), and the Space Telescope Imaging Spectrometer (STIS). The HST observing strategy is described in Williams et al. (2000).
2.3.1 Main Fields
The main deep field WFPC2 observations were centered on RA = 22 32 56.22, and Dec = 60 33 02.69 (J2000). The WFPC2 observations consist of exposures in four broadband filters: F300W, F450W, F606W, and F814W, which have central wavelengths of approximately 2940, 4520, 5940, and 7920 Å, respectively. These filters are the HST analogues of the well known Johnson U, B, V and Cousins I filters. The limiting AB magnitude of the WFPC2 observations are 26.8, 27.7, 28.3 and 27.7 for the F300W, F450W, F606W, and F814W filters, respectively (Casertano et al., 2000).
The Near Infrared Camera and Multi Object Spectrograph (NICMOS) instrument was used to obtain deep near infrared images. Imaging was performed in three NICMOS filters (Williams et al. 2000): F110W, F160W and F222W. These filters correspond roughly to J (F110W), H (F160W) and K (F222W). The NICMOS field is centered at RA = 22 32 51.75, and Dec = 60 38 48.20 (J2000). The sensitivity, while not uniform over the whole image, reaches a limiting F160W (H) AB magnitude of and F222W (K) AB magnitude of (Yahata et al., 2000).
The Space Telescope Imaging Spectrometer (STIS) observations were centered on the STIS QSO (Sealey et al., 1998) at RA = 22 33 37.5883, and Dec = 60 33 29.128 (J2000). The imaging was performed mainly with the 50CCD detector in a filterless mode which provides a wide (2500 Å FWHM) bandpass centered at approximately 5800 Å. Rough color information was obtained by observations with the F28X50LP filter which is a long pass filter beginning at approximately 5500 Å. These images cover a square region totally 0.83 arcmin2 with a resolution of 0.05 per pixel. The filterless 50CCD images correspond roughly to and reach a depth of 29.4 AB magnitudes (Gardner et al., 2000).
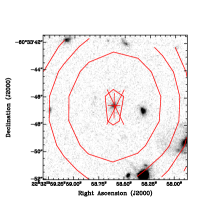
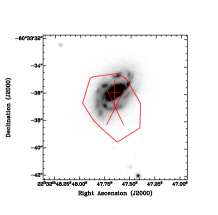
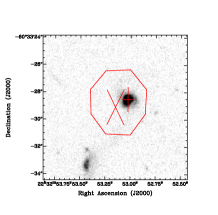
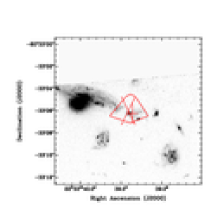
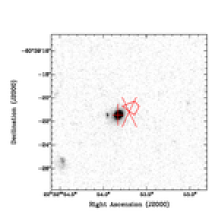
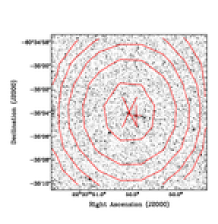
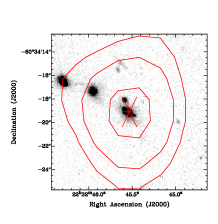
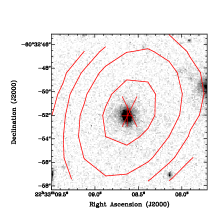
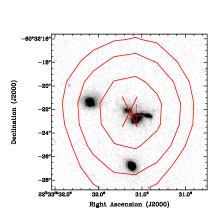
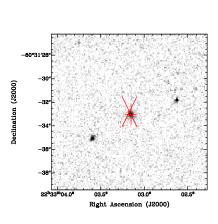
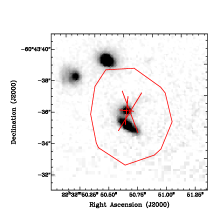
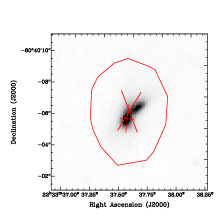
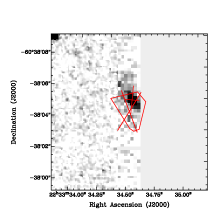
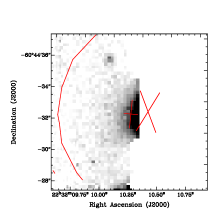
Figures 5 to 7 show the full HST deep images overlaid with ATHDFS 1.4 GHz contours. Four of the ATHDFS radio sources lie within the WFPC2 field, one is in the NICMOS field, and two lie in the STIS field (Tables 2 to 4). All four sources within WFPC have a counterpart within 1.5 arcsec, and the others have counterparts within 0.5 arcsec. Using the WFPC2 source density of 2657 objects over 5.07 arcmin2, we expect only one of these alignments, at most, is due to chance. The grey scale postage stamp images of each source are presented in Figure 8 .
2.3.2 Flanking Fields
In addition to the main deep field exposures, a series of shallower observations were carried out over 27 orbits of the HST. Nine two-orbit WFPC2 pointings were used to observe a contiguous area of sky between the deep STIS, WFPC2 and NICMOS fields, overlapping both the STIS and NICMOS deep fields (Williams et al., 2000). Each of the WFPC2 flanking field exposures has simultaneous STIS and NICMOS exposures. The WFPC2 observations were performed in the I band (F814W), while the STIS images were with the filterless 50CCD configuration and NICMOS images were in H band (F160W). While sensitivity varies slightly between the images, the average limiting AB magnitude for the flanking field images is I (F814W) = 26.02, H (F160W) = 26.32, and V + I (50CCD) = 28.24 for the WFPC2, NICMOS and STIS images, respectively (Lucas et al., 2003).
A deep nine-orbit STIS filterless 50CCD image of the main NICMOS field was also obtained as part of the flanking fields program. This was in order to obtain rough color information on NICMOS objects. The STIS image reaches a AB magnitude of V + I = 29.09 (Lucas et al., 2003). Simultaneous exposures by WFPC2 achieve V (F606W)= 27.79 and I (F814W) = 27.15, and the simultaneous NICMOS imaging depth is J (F110W) = 26.94 and H (F160W) = 26.66 (Lucas et al., 2003).
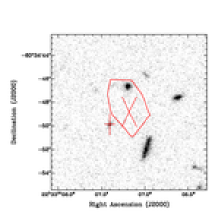
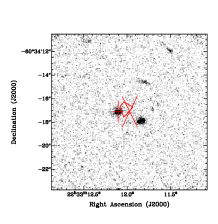
We cross-matched the positions of our ATHDFS radio sources with the full flanking field catalogues (Lucas et al., 2003). Flanking field objects were considered probable counterparts if the positional offset was less than 3 times the radio positional uncertainty. The largest offset accepted as a match is for ATHDFS_J223307.1603448, where the WFPC2 counterpart is radially offset from the radio position by 1.96”. In Table 5 we summarise the properties of the counterparts found in the STIS, NICMOS and WFPC2 flanking fields, respectively. Grey scale HST postage stamp images with overlaid radio contours for all flanking field counterparts are presented in Figures 9 to 11.
2.3.3 Analysis of HST Counterparts and Optically Faint Microjansky Sources
In Section 2.2 we found that 66% of our ATHDFS sources are detected by CTIO imaging. In the main WFPC2 field, the HST imaging achieves sensitivities 4.2 mag deeper than CTIO in the F814W (pseudo-I) band. In the flanking fields, the HST goes 2.5 mag deeper in I. Thus, we expect the HST imaging to detect more of our radio sources. The HST imaging can also be used to confirm that the CTIO imaging is sensitive to I = 23.5.
Table 6 lists the CTIO and HST I magnitudes of the ATHDFS sources which lie in the WFPC2 deep and flanking fields. There are thirty five radio sources within this region, and of these, twenty two have CTIO counterparts. Five of the thirteen sources without CTIO counterparts (i.e. I mag 23.5) are identified in the WFPC2 imaging (F814W 26.0). If the sample within the WFPC2 deep and flanking fields is representative of the full ATHDFS radio sample, then 67% of our radio sources are detected to I mag = 23.5 (CTIO limit) and 79% to I mag (WFPC2 limit). This is consistent with the HDFN and SSA13 fields, where a sub-mJy radio source identification rate of 80% was achieved for a limit of I mag = 25.0 (Richards et al., 1999).
This implies that there is a sizable proportion of sub-mJy radio sources with very faint optical counterparts (). We use the I mag limit to calculate the lower limit to the radio-to-optical ratio (see Section 5.2) of these sources. Table 7 lists the 1.4 GHz flux density and radio-to-optical ratio () limit for these eight sources. We find that all of these optically unidentified sources have relatively high radio-to-optical ratios (). Four sources have , which meets the criteria for radio-loud AGN discussed in Section 5.2. Redshifts are required before we can firmly rule out star formation processes as the source of the radio emission. However, we do note that these sources maybe similar to the optically faint microjansky sources identified in radio observations of the HDFN and SSA 13 fields (Richards et al., 1999).
Because of their faintness not much is known about optically faint microjansky sources, but Richards et al. (1999) propose several possibilities for the nature of these radio sources: (1) luminous dust-enshrouded starbursts at high redshifts of = 1 – 3, (2) extremely high redshift AGN (), or (3) luminous obscured AGN at . Submillimetre observations have shown that a significant fraction of these sources (at least 30%) are dusty starbursts at (Barger et al., 2000; Chapman et al., 2001, 2003). A large fraction ( 50%) of the population also has detectable X-ray emission (Alexander et al., 2001), and the majority of these X-ray detected sources have obscured AGN activity. A stacking analysis performed on the optically faint microjansky sources not detected by current X-ray observations found that their average X-ray properties are consistent with an object like Arp220 lying at (Alexander et al., 2001). Recent high resolution radio images suggest optically faint microjansky sources are examples of dusty high redshift starbursts, and some of these seem to be composite sources with an embedded AGN (Muxlow et al., 2005).
3 Spectroscopic Data
3.1 Spectroscopy in Literature
The AAO undertook a public domain redshift survey of the Hubble Deep Field South using the upgraded Low Dispersion Survey Spectrograph (LDSS++). The HDFS LDSS++ targets were selected from deep AAT Prime Focus Imaging to R 24 of a 9 3 arcmin field covering the main WFPC2 and STIS HST fields (Glazebrook et al., 2006). A total of 225 targets were observed simultaneously. The spectra obtained have 8Å spectral resolution and cover the wavelength range from 5300Å to 10700Å. Four radio sources have high quality (2 or more lines) LDSS++ spectra, and we summarise the LDSS++ counterparts in Table 8. The spectra were examined and typed using the same criteria and nomenclature as the 2dF spectroscopy.
Spectroscopy was also obtained at the Very Large Telescope (VLT) using the FORS2 spectrograph in multi-object spectroscopy (MOS) mode. A total of 194 galaxies in the main HDFS and Flanking Fields were targeted during 2000 and 2002. Reliable redshifts, determined from multiple spectral features or the [OII] 3727Å doublet, were obtained for 97 targets (Sawicki & Mallén-Ornelas, 2003). Approximately half of all galaxies brighter than F814W(AB) = 24 in the HDFS proper were observed, and redshifts obtained for 76%. We cross-matched the ATHDFS radio sources against the Sawicki & Mallén-Ornelas (2003) redshift catalogue. A total of five counterparts were found and Table 9 summarises the results.
3.2 2dF Optical Spectroscopy
The public domain spectroscopic followup of galaxies in the HDFS and the surrounding region has yielded about 400 redshifts (Vanzella et al. 2002, Sawicki & Mallén-Ornelas 2003, Glazebrook et al. 2006). Only 6 of our radio sources have spectroscopic redshifts from the literature, however. The main factor limiting the spectroscopic completeness is that these redshift surveys were concentrated on the central WFPC2 field and the surrounding HST flanking fields, whereas our radio sources are from a region 40 arcmin in diameter. Hence we undertook wide field spectroscopic observations.
We obtained spectra of the ATHDFS radio sources over two service nights in July 2001 and October 2003 using the multi-fibre 2dF instrument of the Anglo-Australian Telescope (AAT). The 2dF allows the simultaneous acquisition of up to 400 spectra over a 2 degree diameter region of sky. We employed the 2dFGRS (Colless et al., 2001) observing strategy, which is to use a 300 lines/mm grating at a central wavelength of 5800Å. This yielded low resolution (9Å) spectra over the wavelength range 3800Å to 8000Å. Our data consisted of six consecutive 20-minute exposures, giving a total of 2 hours on source.
The spectra were reduced using the 2dfdr reduction package, developed by the AAO specifically for 2dF spectra data. We were unable to place a fibre on all targets due to crowding, so higher priority was given to our radio sources with bright (B 23) counterparts. A total of 268 sources from the 1.4 GHz ATHDFS catalogue were targeted. Redshifts were determined by visually inspecting the spectra. Each spectrum was assigned an index, Q, that signifies the quality of the redshift determination. A value of Q = 3 indicates three or more lines were identified, so the redshift is very well determined. Two, one or no lines identified are indicated by Q = 2, 1 or 0, respectively. Redshifts were obtained for 98 out of the 268 targeted sources. In Figure 12 we plot B magnitude against 1.4 GHz flux density for the ATHDFS radio sources. From this we can see that the 2dF success rate is almost 100% for all targeted sources brighter than about B = 22. Redshifts are much harder to obtain for the fainter sources. In the B 23 cases, the spectra is low SN and the redshift determination only possible by the detection of bright emission lines.
The spectra were also used to classify our radio sources. We divided the
spectra into five broad classes:
i) galaxies with absorption line spectra (22, 22%),
ii) starforming galaxies (36,37%),
iii) Seyfert galaxies (6, 6%),
iv) broadline AGN (7, 7%),
v) unclassified objects (27, 28%).
The unclassified objects have at least one identifiable line in their spectrum,
but insufficient SN or not enough observed lines to make a classification
possible.
The Seyferts were determined by [O III] 5007/H and [N II]6583/H diagnostic line ratios. Although the 2dF spectrograph is fibre fed, these line pairs are close in wavelength and thus poor flux calibration will not affect these line ratios significantly. The line ratios of all our starforming and Seyfert objects are plotted in Figure 13 along with the Kewley et al. (2001) classification line. The six Seyferts lie above and to the right of the maximum starburst line.
In Table 10 Summary of 2dF spectral properties for ATHDFS sources with 2dF redshifts. we present a summary of the 2dF spectroscopy of the ATHDFS sources. Information is provided for the sources with 2dF redshifts. A description of Table 10 Summary of 2dF spectral properties for ATHDFS sources with 2dF redshifts. is as follows.
Column (1) — ATHDFS source name.
Column (2) — 2dF spectroscopic redshift.
Column (3) — quality of 2dF spectroscopy, as described above.
Column (4) — spectral classification, as described above. ‘abs’ are galaxies with absorption lines, ‘sf’ are starforming galaxies, ‘sy’ indicates Seyferts, ‘BL’ marks broadline AGN, and ‘unc’ means unclassified.
Column (5) — H line flux, in CCD counts
Column (6) — OIII[5007] line flux, in CCD counts
Column (7) — H line flux, in CCD counts
Column (8) — NII[6584] line flux, in CCD counts
Column (9) — comments on spectra, including what lines are observed
4 Photometric Redshifts
The majority of our radio sources do not have spectral data, but CTIO imaging provides up to five-band photometry of 67% of the radio sources with which to calculate photometric redshifts. Photometric redshifts were determined using the galaxy template technique by two independent groups: Teplitz et al. (2001) and ourselves. Teplitz et al. (2001) used a template set which consisted of Coleman et al. (1980) spectra augmented with a single bluer synthetic starburst (Bruzual A. & Charlot, 1993). They calculated photometric redshifts for objects with a clear detection () in BVR and either u or I. We adopted the template set of Coleman et al. (1980) spectra plus two starburst galaxy spectra. The two new starburst galaxy spectra were formed by adopting starbursts SB1 and SB2 of Kinney et al. (1996), which have different intrinsic color excess, and extrapolating to ultraviolet and near infrared wavelengths using the recipe from Fernández-Soto et al. (1999).
Teplitz et al. (2001) performed a Monte Carlo simulation to estimate the accuracy of their photometric redshifts. Model galaxy spectra (Bruzual A. & Charlot, 1993) of varying metallicity and age were redshifted and random photometric error added. The redshift error from applying the photometric redshift method to the simulated spectra is typically 15 — 20% for (Teplitz et al., 2001). For galaxies with the typical residuals in the redshift error are . Also, the failures () for simulated galaxies are less than 10%, compared with greater than 40% for objects. The failures in the Teplitz et al. (2001) photometric redshift catalogue are likely to be more numerous, since real data contain a larger variety of galaxies, such as AGN. Nevertheless one can conclude that their photometric redshifts are quite reliable to . The reason for the failure at is the limitations of the CTIO filter set. The most obvious spectral features for template fitting are the 4000 Å and 912 Å breaks, which fall out of the uBVRI passbands. The 4000 Å is shifted to near infrared for , while the 912 Å is out of the u passband until . The CTIO photometric redshifts are listed in Table 11 Photometric redshifts of ATHDFS radio sources..
We expect our photometric redshifts to have similar accuracy, since similar data and techniques are used. A photometric redshift was estimated for the 307 1.4 GHz radio sources with a CTIO counterpart from the CTIO imaging. The photometric redshifts are restricted to , as this is the redshift space effectively probed by the uBVRI filter set. Photometric redshifts of and were rejected since the photometric redshift code obviously did not find a fit within the desired range. This occurred for 43 of the sources, so in total we derive 264 photometric redshifts. We list these in Table 11 Photometric redshifts of ATHDFS radio sources..
To investigate the accuracy of our photometric redshifts we compared them with the spectroscopic ones obtained on 2dF. Of the 98 objects with 2dF redshifts, 85 have photometric redshifts. We show a comparison of the 2dF spectroscopic versus photometric redshifts in the left panel of Figure 14. We find that only six ATHDFS sources have estimated photometric redshifts which are failures (), indicating a high photometric redshift success rate of 79/85 (93%). Four of these sources are broadline emitting quasars which are not well represented by our galaxy templates. The 79 successful photometric redshifts have a median residual of 0.064. In comparison, there are photometric redshifts from Teplitz et al. (2001) for 87 of the sources with 2dF redshifts. A comparison of Teplitz et al. (2001) and 2dF redshifts is shown in the right panel of Figure 14. The success rate () of the Teplitz et al. (2001) photometric redshifts is 72/87 (83%). We note that there are eight sources with a spectroscopic redshift which are erroneously given photometric redshifts by Teplitz et al. (2001). Also, even though Teplitz et al. (2001) allow photometric redshifts greater than , they successfully estimate the redshift of only 1/6 of the broadline emitting objects at . We therefore deem our photometric redshifts to be more reliable than Teplitz et al. (2001) and use only our photometric redshifts in further analysis.
The photometric redshifts are accurate for the 2dF sample. However, is this likely to be true for the full ATHDFS sample ? The sources with 2dF redshifts are the optically brightest of our sources (see Figure 12), so the previous comparison between photometric and spectroscopic redshifts is not from a random selection of the full ATHDFS sample. To estimate the contamination in the photometric redshifts we can combine the results from Teplitz et al. (2001) with ours. Figure 15 shows the comparison of the 209 sources which also have photometric redshifts from Teplitz et al. (2001). In the cases where Teplitz et al. (2001) , which is 185/209 (89%), there is good agreement. and the median ) is . The two photometric redshift samples are independent fits, yet they agree () for 87% of the sources with Teplitz et al. (2001) redshifts. By design, our photometric redshifts will be wrong for sources that actually lie at , but from Figure 15 we see that sources which are possibly at (from Teplitz et al. 2001) have a flat distribution in our photometric redshifts, and hence are not biased to a particular redshift. It is not clear whether the Teplitz et al. (2001) redshifts are overestimated or our redshifts underestimated for the discordant cases. However, it is likely that our results are correct for a significant portion of these discordant cases since the Teplitz et al. (2001) results have a 40% failure rate for .
The photometric redshifts of our ATHDFS radio sources are listed in Table 11 Photometric redshifts of ATHDFS radio sources.. A description of the table is as follows:
Column (1) — ATHDFS source name.
Column (2) — Teplitz et al. (2001) photometric redshift.
Column (3) — photometric redshift from this work.
Column (4) — best fit spectral template, as described above.
5 Discussion
5.1 Optical Properties of the Sub-mJy Sample
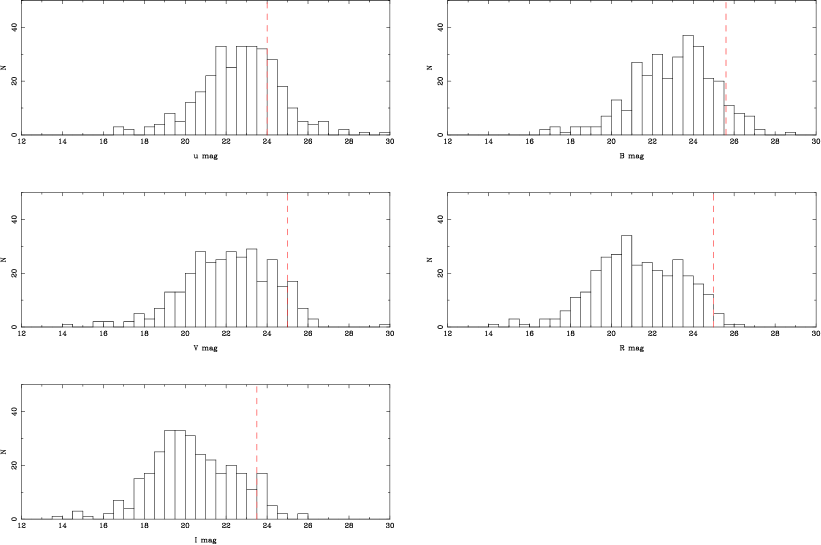
The magnitude distributions of our matched radio sources, at all five CTIO optical bands, are shown in Figure 16. The R magnitude distribution shows that the number of sources declines between R = 22 and R = 24, and there are similar decreases in the other passbands. We argue that this is a property of the CTIO identified ATHDFS radio sources, rather than being caused by incompleteness in the optical imaging, since the drop off in number occurs well above the limiting magnitude of the optical data. The mean magnitude of the optical counterparts to our radio sources is 22.7, 23.0, 22.2, 21.3, 20.4 for the U,B,V,R and I bands, respectively, whereas the limiting magnitude of the CTIO images are 24.0, 25.6, 25.0, 25.0, 23.5 for the same passbands.
In Figure 17 we plot the I band magnitude of the sample against 1.4 GHz flux density. The lower flux density sources seem to have fewer bright (I mag 19) optical counterparts. The median I magnitude for sources with mJy is 0.8 magnitudes brighter than the median I magnitude of the faintest radio sources ( mJy). This trend of fainter radio sources having fainter optical hosts was also observed by Afonso et al. 2006 (but see Barger et al. 2007).
We plot the absolute I magnitude versus redshift in Figure 18 for the 266 radio sources with redshift information. The magnitudes are k-corrected using the best fit spectral type from the photometric redshift analysis. For six radio sources there was a 2dF spectroscopic redshift but no photometric type. The k-correction in these cases were determined from a starburst template for the 2dF emission line galaxies (2 total), and an E/S0 template for the 2dF absorption line galaxies (2 total). A further two cases were high redshift () 2dF broadline emitting quasars, which we k-corrected with a QSO composite template from Francis et al. (1991). The approximate I magnitude limit of 23.5 is shown by the solid line in Figure 18. The host galaxies span a small range in absolute magnitude across the redshift range . We find the median absolute I magnitude for sources is 21.7, while the median absolute I magnitude for sources at is 22.3. So there maybe a trend towards these radio sources having brighter host galaxies at , but this trend is very weak.
We show absolute I magnitude versus 1.4 GHz radio power for all radio sources with redshift information in Figure 19. The majority of the radio sources (80%) lie in the magnitude range 20 to 24. This corresponds to 1.6 dex in luminosity. In comparison, the radio powers have a wider range of luminosities (about 2 dex encompasses 80% of the sources). The higher redshift sources must have higher radio powers, but the median absolute I magnitude does not change noticeably with redshift (Figure 18). So the optical properties of the host galaxies are not changing as fast as the radio power of the host galaxies (c.f. Barger et al. 2007).
In Figure 20 we plot the restframe B - I colors of the optically identified radio sources in our sample against 1.4 GHz flux density and redshift. The solid, dotted and dashed lines in Figure 20 show the restframe colors of a Coleman et al. 1980 E/S0, Sbc and Irr galaxy, respectively. The host galaxies have colors that span the range between E/S0 to Irr, but have a median color that is Sbc-like. We find little variation in the median color of the host galaxies with either flux density or redshift. This supports the suggestion that the host galaxies of faint radio sources are drawn from the same population as that of bright radio sources (c.f. Barger et al. 2007).
5.2 Radio-to-Optical Ratios
The radio-to-optical ratio of a radio source can give clues to the nature of the radio emission and it has traditionally been used to determine the “radio-loudness” of radio sources (Kellermann et al., 1989). While optically selected samples of quasars have been found to have a wide range of radio flux densities, and thus radio-to-optical ratios (Sramek & Weedman, 1980; Condon et al., 1981), it has been suggested that the distribution of this ratio is bimodal (e.g. Kellermann et al., 1989; Stocke et al., 1992). These authors find a dip in the distribution of 5 GHz to B band flux density ratios at , and formally classify radio sources as radio-loud if they have .
The bimodality of radio-loudness is still controversial, though, with White et al. (2000) claiming no bimodality is seen for a radio-selected sample of optically bright quasars from the FIRST Bright Quasar Survey. However, Ivezić et al. (2002) combined the FIRST survey with deeper SDSS data and found evidence for a bimodality with a minimum in the radio-to-optical ratio between 1 and 10. Ivezić et al. (2002) claim that the FIRST Bright Quasar Survey was biased to radio-intermediate sources with ratios between 1 and 10 because of the brighter limit, and hence no bimodality was observed. Moreover, a study of the nuclear region of local Seyferts have found that 60% of them meet the radio-loud criterion, suggesting that, after removing the effects of the diluting host galaxy, most Seyferts are not radio-quiet (Ho & Peng, 2001).
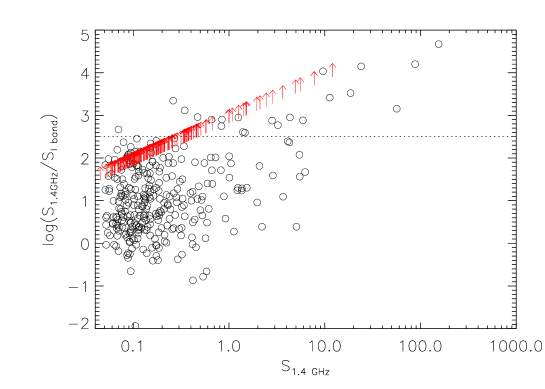
We plot the observed radio-to-I-band flux density ratio against redshift in Figure 21. The I band was selected as it is the reddest filter and hence covers the rest-frame optical regime to the highest redshift. Marked on Figure 21 are ratios from the radio-loud and radio-quiet QSOs from Elvis et al. (1994). We also overplot tracks from local starbursts Arp220 and M82, which have star formation rates of several hundred and tens of M⊙ yr-1, respectively. The radio-to-optical ratio tracks for the starbursts cover the intermediate range of 1–10. We find that the majority of the optically detected radio sources have radio-to-optical ratios in the range 1–100, with a median of .
Care must be taken when interpreting the radio-to-optical ratio. At high redshifts we are observing objects at a different cosmological epoch, so they may have broadband SED properties which differ from local objects. For instance, there is evidence that high redshift starbursts and ultraluminous infra-red galaxies (ULIRGs) have SEDs that differ from local analogs (Pope et al., 2006; Huynh et al., 2007b). Also, sources at earlier epochs maybe more dust obscured, which would increase the radio-to-optical ratio. The tracks in Figure 21 are therefore a rough guide only. A further complicating factor is that AGN have variable luminosities. The luminosity of an AGN can change on timescales of minutes (X-ray) to months (radio/optical/infrared) (e.g. Hawkins, 2002). The effect of variability in the radio should be reduced since the radio observations were taken over a period of 3 years and any variability is therefore diluted. The optical data, however, was obtained over a period of only three days.
Because of these caveats we choose a conservative approach to using the radio-to-optical ratio as a radio-loudness parameter. We class sources as radio-loud AGN if they have . A source exceeding this ratio always lies above the radio-loud QSO track for redshifts 0 to 5 (Figure 21). Using this criterion, we identify 44 sources as radio-loud AGN, including the sources with only limits in I magnitude. These sources are listed in Table 12.
One interesting source classified as radio-loud is ATHDFS_J223343.7-603651 which has a 1.4 GHz flux density of 0.070 mJy. This faint source is at the detection limit of the CTIO images, and we have no redshift information for it. In Paper III we quote a radio spectral index of for this source, and identified it as an ultra-steep spectrum radio source. The radio-loud classification of this source is consistent with it being a high redshift radio galaxy.
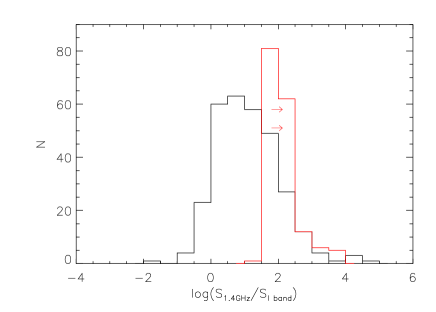
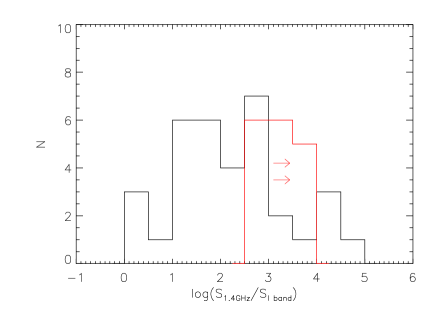
The distribution of the radio-to-optical ratio of the I band identified sources is shown in Figure 22. The distribution of sources brighter than 1 mJy shows signs of bimodality, in accordance with Ivezić et al. (2002). Although the small number of sources makes it difficult to accurately determine the shape of the radio-to-optical ratio distribution, we find the number of radio bright sources peaks at and has a dip at . If we then assume that most of the optically selected AGN in the HDFS are not detected in the radio, then these undetected optical AGN have and the unobserved part of the distribution must rise for . This is inconsistent with (White et al., 2000), but this previous work only had shallow imaging (I th mag compared to our I = 23.5 limit). Our sample is radio selected, however, so a complete radio survey of a sample of optically selected AGN is needed to confirm the radio-loud/radio-quiet bimodality of AGN. Sixty percent (31/51) of these radio bright sources have ratios greater than , meeting our conservative radio-loud criterion.
For the full sample, the radio-to-optical ratio shows no sign of bimodality and has a roughly Gaussian distribution with a peak at = 0.5 – 1 (Figure 22). However, we only have band detections for 66% of the sources, and deeper optical imaging is needed to determine the distribution at . The faint radio sources are more radio quiet than bright radio sources (as expected). The distribution for the fainter radio sources also shows an extended tail at high ratios, which means we can not rule out low luminosity AGN in this population. We posit that there maybe a lack of sources with ratios in the region at higher radio flux densities, but starbursts and radio-intermediate AGN increase in number as fainter radio flux densities are probed, so the gap in the distribution between 0 and 1 is filled (see Figure 23). We also note that there is a subsample of radio sources undetected in the band with high radio-to-optical ratios (), which are the optically faint microjansky sources discussed in Section 2.3.3. Their ratios imply that they are radio-loud AGN or starbursts with large dust obscuration.
5.3 Radio Power and Redshift Distribution
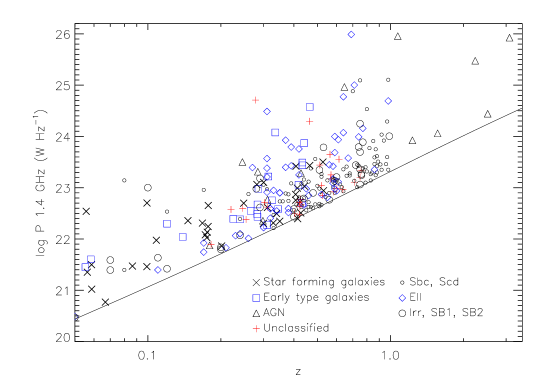
Radio luminosities for the ATHDFS sources are calculated with the redshifts presented in this paper. In Figure 24 we plot the 1.4 GHz radio luminosity of the ATHDFS radio sources against redshift for the spectroscopic and photometric redshift samples. The galaxies classed as starforming from 2dF spectra have luminosities in the range 20.5 – 23.5 W Hz-1. The early type galaxies have larger radio powers of 21.5 – 24.5 W Hz-1. This is expected as the radio emission from early type galaxies is driven by a weak AGN, which is more radio powerful than star formation processes. Also as expected, the broadline AGN are the most powerful radio sources ( 23 – 26 W Hz-1). There is significant overlap in the radio powers of the starforming and early galaxy types, and even broadline AGN can have similar radio powers to the most powerful starbursts. This means that radio power alone cannot be used as a discriminator of source types.
The redshift distribution of our sources with spectroscopic redshifts is shown in Figure 25. The median redshift of the whole spectroscopic sample is 0.34. The starforming galaxies are at similar redshifts to the early type galaxies, with median redshifts of 0.28 and 0.31 for the starforming and early type samples, respectively. We note that there is a lack of both spectroscopic starforming and early type galaxies at because of our survey sensitivity limit. The solid line in Figure 24, which marks the radio power sensitivity of our survey, shows how our radio survey becomes increasingly insensitive to sources with starforming and early type radio powers as higher redshifts are probed. The broadline AGN are detected at both low and moderate redshifts, but only the most powerful () are detected at . The highest redshift source is a broadline AGN estimated to be at . Finally we note that the unclassified sources are at greater redshifts than the starforming or early type galaxies, with a median redshift of 0.46. The greater distance to these sources make them on average fainter in the optical, and thus the spectroscopy of these sources is of lower quality, as expected.
In Figure 26 we show the photometric redshift distribution of our sources, sorted into best fit template types. The late type galaxies, Sbc and Scd, show a Gaussian like distribution with a peak at and an extended tail. The distribution of the early type galaxies is similar, with a peak also at . Again we argue that the decline in the number of sources in these two samples for is probably because of our survey sensitivity. The starbursts and irregulars appear to have a more uniform distribution than the early or late type samples.
6 Summary
We have cross-matched the ATHDFS radio sources with optical imaging from CTIO. We find 306/465 (66%) of the radio sources which lie within the region covered by the CTIO imaging have counterparts to .
The HST imaging was also used to search for optical counterparts to our radio sources. The HST imaging reaches a sensitivity approximately 2.5 mag deeper than the CTIO imaging. This idenitifes a further 12 percent of sources in the HST region. Thus, the identification rate of sub-mJy radio sources to I = 26.0 is estimated to be 79%. A sizable proportion ( 20%) are fainter than this and remain optically unidentified. These optically faint microjansky sources, also found in other radio surveys, are thought to be a mix of starbursts at and high redshift obscured AGN.
We have presented spectroscopic redshifts derived from 2dF spectra for 98 of the radio sources. Where the spectra is of sufficient quality, the sources have been classified as early type, starforming, Seyfert or broadline AGN. The spectroscopic sample consists of 22% early type, 37% late type, and 13% Seyferts or broadline AGN. The median redshift of the sample is and a broadline AGN at has been discovered. Photometric redshifts from 5 band CTIO photometry have also been calculated for 264 ATHDFS sources. A total of 56% (266/473) of the radio sources have redshift information.
Using the available optical information, our main results are as follows.
-
•
The observed I band magnitude of mJy radio sources is 0.8 magnitudes brighter than the faintest radio sources ( mJy).
-
•
The median restframe color of the optical hosts is consistent with that of a Sbc galaxy.
-
•
There is little variation in the restframe optical colours of the host galaxies with redshift (to ) or 1.4 GHz flux density. This suggests that faint and bright radio sources have similar host galaxies and that the host galaxies do not evolve much with redshift. It is also further evidence that there is a significant fraction of low luminosity or radio quiet AGN in the sub-mJy radio population.
-
•
Using a conservative radio-to-optical flux density ratio, we conclude 44 of the sources are radio-loud and most likely powered by an AGN. We find that 61% (31/51) of bright radio sources ( mJy) have a radio-to-optical ratio that fits the radio-loud criterion.
-
•
The distribution of the radio-to-optical ratios of the bright () radio sources is consistent with a radio-loud/radio-quiet bimodality. However, complete radio observations of an optically selected sample of AGN are required to confirm the dichotomy. We find no evidence for the radio-loud/radio-quiet bimodality in the full ATHDFS sample, which we believe is due to radio-intermediate starbursts and low luminosity AGN becoming more numerous at sub-mJy flux density levels.
The mid-infrared wavelengths can be good discriminators of star formation versus AGN emission (Lacy et al., 2004; Stern et al., 2005). The HDF-S has been observed in the infrared by the Spitzer Space Telescope. Future papers in this series will present the Spitzer identifications of the ATHDFS radio sources to further investigate the nature of faint radio sources.
References
- Afonso et al. (2006) Afonso, J., Mobasher, B., Koekemoer, A., Norris, R. P., & Cram, L. 2006, AJ, 131, 1216
- Alexander et al. (2001) Alexander, D. M., Brandt, W. N., Hornschemeier, A. E., Garmire, G. P., Schneider, D. P., Bauer, F. E., & Griffiths, R. E. 2001, AJ, 122, 2156
- Barger et al. (2000) Barger, A. J., Cowie, L. L., & Richards, E. A. 2000, AJ, 119, 2092
- Barger et al. (2007) Barger, A. J., Cowie, L. L., & Wang, W.-H. 2007, ApJ, 654, 764
- Bertin & Arnouts (1996) Bertin, E., & Arnouts, S. 1996, A&AS, 117, 393
- Bruzual A. & Charlot (1993) Bruzual A., G., & Charlot, S. 1993, ApJ, 405, 538
- Casertano et al. (2000) Casertano, S., et al. 2000, AJ, 120, 2747
- Chapman et al. (2003) Chapman, S. C., et al. 2003, ApJ, 585, 57
- Chapman et al. (2001) Chapman, S. C., Richards, E. A., Lewis, G. F., Wilson, G., & Barger, A. J. 2001, ApJ, 548, L147
- Coleman et al. (1980) Coleman, G. D., Wu, C.-C., & Weedman, D. W. 1980, ApJS, 43, 393
- Colless et al. (2001) Colless, M., et al. 2001, MNRAS, 328, 1039
- Condon (1984) Condon, J. J. 1984, ApJ, 287, 461
- Condon (1989) Condon, J. J. 1989, ApJ, 338, 13
- Condon et al. (1981) Condon, J. J., Odell, S. L., Puschell, J. J., & Stein, W. A. 1981, ApJ, 246, 624
- Croton et al. (2006) Croton, D. J., et al. 2006, MNRAS, 365, 11
- Elvis et al. (1994) Elvis, M., et al. 1994, ApJS, 95, 1
- Fernández-Soto et al. (1999) Fernández-Soto, A., Lanzetta, K. M., & Yahil, A. 1999, ApJ, 513, 34
- Francis et al. (1991) Francis, P. J., Hewett, P. C., Foltz, C. B., Chaffee, F. H., Weymann, R. J., & Morris, S. L. 1991, ApJ, 373, 465
- Gardner et al. (2000) Gardner, J. P., et al. 2000, AJ, 119, 486
- Glazebrook et al. (2006) Glazebrook, K., Verma, A., Boyle, B., Oliver, S., Mann, R. G., & Monbleau, D. 2006, AJ, 131, 2383
- Hawkins (2002) Hawkins, M. R. S. 2002, MNRAS, 329, 76
- Ho & Peng (2001) Ho, L. C., & Peng, C. Y. 2001, ApJ, 555, 650
- Huynh et al. (2007a) Huynh, M. T., Jackson, C. A., & Norris, R. P. 2007a, AJ, 133, 1331
- Huynh et al. (2007b) Huynh, M. T., Pope, A., Frayer, D. T., & Scott, D. 2007b, ApJ, 659, 305
- Huynh et al. (2005) Huynh, M. T., Jackson, C. A., Norris, R. P., & Prandoni, I. 2005, AJ, 130, 1373
- Ivezić et al. (2002) Ivezić, Ž., et al. 2002, AJ, 124, 2364
- Jarvis & Rawlings (2004) Jarvis, M. J., & Rawlings, S. 2004, New Astronomy Review, 48, 1173
- Kellermann et al. (1989) Kellermann, K. I., Sramek, R., Schmidt, M., Shaffer, D. B., & Green, R. 1989, AJ, 98, 1195
- Kewley et al. (2001) Kewley, L. J., Heisler, C. A., Dopita, M. A., & Lumsden, S. 2001, ApJS, 132, 37
- Kinney et al. (1996) Kinney, A. L., Calzetti, D., Bohlin, R. C., McQuade, K., Storchi-Bergmann, T., & Schmitt, H. R. 1996, ApJ, 467, 38
- Kormendy & Richstone (1995) Kormendy, J., & Richstone, D. 1995, ARA&A, 33, 581
- Labbé et al. (2003) Labbé, I., et al. 2003, AJ, 125, 1107
- Lacy et al. (2004) Lacy, M., et al. 2004, ApJS, 154, 166
- Landolt (1992) Landolt, A. U. 1992, AJ, 104, 340
- Lucas et al. (2003) Lucas, R. A., et al. 2003, AJ, 125, 398
- Muxlow et al. (2005) Muxlow, T. W. B., et al. 2005, MNRAS, 358, 1159
- Norris et al. (2005) Norris, R. P., et al. 2005, AJ, 130, 1358
- Palunas et al. (2000) Palunas, P., et al. 2000, ApJ, 541, 61
- Pope et al. (2006) Pope, A., et al. 2006, MNRAS, 370, 1185
- Richards et al. (1999) Richards, E. A., Fomalont, E. B., Kellermann, K. I., Windhorst, R. A., Partridge, R. B., Cowie, L. L., & Barger, A. J. 1999, ApJ, 526, L73
- Rowan-Robinson et al. (1993) Rowan-Robinson, M., Benn, C. R., Lawrence, A., McMahon, R. G., & Broadhurst, T. J. 1993, MNRAS, 263, 123
- Rudnick et al. (2001) Rudnick, G., et al. 2001, AJ, 122, 2205
- Sawicki & Mallén-Ornelas (2003) Sawicki, M., & Mallén-Ornelas, G. 2003, AJ, 126, 1208
- Sealey et al. (1998) Sealey, K. M., Drinkwater, M. J., & Webb, J. K. 1998, ApJ, 499, L135
- Seymour et al. (2004) Seymour, N., McHardy, I. M., & Gunn, K. F. 2004, MNRAS, 352, 131
- Simpson et al. (2006) Simpson, C., et al. 2006, MNRAS, 372, 741
- Sramek & Weedman (1980) Sramek, R. A., & Weedman, D. W. 1980, ApJ, 238, 435
- Stern et al. (2005) Stern, D., et al. 2005, ApJ, 631, 163
- Stocke et al. (1992) Stocke, J. T., Morris, S. L., Weymann, R. J., & Foltz, C. B. 1992, ApJ, 396, 487
- Teplitz et al. (2001) Teplitz, H. I., Hill, R. S., Malumuth, E. M., Collins, N. R., Gardner, J. P., Palunas, P., & Woodgate, B. E. 2001, ApJ, 548, 127
- Vanzella et al. (2002) Vanzella, E., et al. 2002, A&A, 396, 847
- Wall et al. (1986) Wall, J. V., Benn, C. R., Grueff, G., & Vigotti, M. 1986, Highlights in Astronomy, 7, 345
- White et al. (2000) White, R. L., et al. 2000, ApJS, 126, 133
- Williams et al. (2000) Williams, R. E., et al. 2000, AJ, 120, 2735
- Windhorst et al. (1985) Windhorst, R. A., Miley, G. K., Owen, F. N., Kron, R. G., & Koo, D. C. 1985, ApJ, 289, 494
- Yahata et al. (2000) Yahata, N., Lanzetta, K. M., Chen, H., Fernández-Soto, A., Pascarelle, S. M., Yahil, A., & Puetter, R. C. 2000, ApJ, 538, 493


WFPC2 814W
| ATHDFS_J223258.5-603346 | ATHDFS_J223247.6-603337 | ATHDFS_J223253.1-603329 |
ATHDFS_J223302.8-603323
NICMOS F160W
ATHDFS_J223253.7-603921
STIS 50CCD
ATHDFS_J223337.5-603329 ATHDFS_J223339.4-603306
WFPC2 814W
| ATHDFS_J223207.9-603928 | ATHDFS_J223253.7-603921 | ATHDFS_J223245.6-603857 |
| ATHDFS_J223248.2-603805 | ATHDFS_J223254.5-603748 | ATHDFS_J223202.5-603714 |
| ATHDFS_J223253.0-603539 | ATHDFS_J223245.3-603537 | ATHDFS_J223338.8-603523 |
| ATHDFS_J223344.9-603515 | ATHDFS_J223350.5-603503 | ATHDFS_J223307.1-603448 |
WFPC2 814W
| ATHDFS_J223243.3-603443 | ATHDFS_J223245.5-603419 | ATHDFS_J223311.9-603417 |
| ATHDFS_J223306.0-603350 | ATHDFS_J223243.4-603352 | ATHDFS_J223247.6-603337 |
| ATHDFS_J223337.5-603329 | ATHDFS_J223339.4-603306 | ATHDFS_J223308.6-603251 |
| ATHDFS_J223317.7-603235 | ATHDFS_J223331.6-603222 | ATHDFS_J223303.1-603132 |
NICMOS F160W
| ATHDFS_J223250.6-604336 | ATHDFS_J223337.5-604006 | ATHDFS_J223334.4-603804 |
ATHDFS_J223210.3-604433
STIS 50CCD
| ATHDFS_J223425.0-603452 | ATHDFS_J223327.6-603414 |


| ATHDFS name | CTIO | CTIO ID | U mag | U rms | B mag | B rms | V mag | V rms | R mag | R rms | I mag | I rms | CTIO phot z | CTIO phot z |
|---|---|---|---|---|---|---|---|---|---|---|---|---|---|---|
| flag | error | error | error | error | error | uncertainty | ||||||||
| ATHDFS_J223303.6-605751 | OUT | |||||||||||||
| ATHDFS_J223325.8-605729 | OUT | |||||||||||||
| ATHDFS_J223255.6-605656 | OUT | |||||||||||||
| ATHDFS_J223246.3-605654 | OUT | |||||||||||||
| ATHDFS_J223403.4-605640 | OUT | |||||||||||||
| ATHDFS_J223243.8-605608A | OUT | |||||||||||||
| ATHDFS_J223243.8-605608B | OUT | |||||||||||||
| ATHDFS_J223410.5-605545A | OUT | |||||||||||||
| ATHDFS_J223410.5-605545B | OUT | |||||||||||||
| ATHDFS_J223308.5-605544 | NO | |||||||||||||
| ATHDFS_J223314.6-605543 | YES | 2689 | 18.11 | 0.01 | 18.05 | 0.00 | 17.42 | 0.00 | 16.98 | 0.00 | 16.52 | 0.01 | 0.01 | 0.05 |
| ATHDFS_J223316.9-605533 | YES | 3290 | 17.13 | 0.01 | 16.88 | 0.00 | 15.96 | 0.00 | 15.37 | 0.00 | 14.72 | 0.00 | 0.17 | 0.11 |
| ATHDFS_J223353.9-605452 | YES | 1648 | 22.99 | 0.16 | 24.05 | 0.18 | 23.00 | 0.15 | 22.41 | 0.12 | 21.23 | 0.19 | 0.98 | 0.25 |
| ATHDFS_J223334.6-605455 | NO | |||||||||||||
| ATHDFS_J223214.8-605430 | YES | 2073 | 23.10 | 0.16 | 23.74 | 0.12 | 22.67 | 0.08 | 22.28 | 0.09 | 21.58 | 0.22 | 0.27 | 0.18 |
| ATHDFS_J223448.4-605417 | YES | 2430 | 23.48 | 0.50 | 24.58 | 0.61 | 24.31 | 0.82 | 22.89 | 0.42 | 22.11 | 0.94 | 0.71 | 0.35 |
| ATHDFS_J223317.5-605416A | NO | |||||||||||||
| ATHDFS_J223317.5-605416B | NO | |||||||||||||
| ATHDFS_J223156.0-605417 | NO | |||||||||||||
| ATHDFS_J223204.8-605414 | YES | 2735 | 20.14 | 0.02 | 20.52 | 0.01 | 19.50 | 0.01 | 18.94 | 0.01 | 18.28 | 0.02 | 0.21 | 0.15 |
| ATHDFS_J223228.8-605406 | NO | |||||||||||||
| ATHDFS_J223430.9-605357 | NO | |||||||||||||
| ATHDFS_J223230.3-605352 | YES | 3044 | 22.84 | 0.15 | 23.89 | 0.17 | 22.82 | 0.13 | 21.76 | 0.07 | 20.48 | 0.10 | 0.82 | 0.18 |
| ATHDFS_J223151.1-605328 | YES | 4228 | 21.05 | 0.07 | 20.83 | 0.02 | 19.40 | 0.01 | 18.41 | 0.01 | 17.66 | 0.02 | 0.32 | 0.03 |
| ATHDFS_J223145.4-605311 | YES | 4739 | 21.19 | 0.11 | 20.96 | 0.04 | 19.53 | 0.02 | 18.53 | 0.01 | 17.74 | 0.03 | 0.32 | 0.04 |
| ATHDFS_J223453.4-605259 | YES | 4223 | 23.81 | 0.44 | 25.07 | 0.59 | 22.92 | 0.15 | 21.48 | 0.07 | 20.08 | 0.08 | 0.74 | 0.19 |
| ATHDFS_J223141.5-605302 | NO | |||||||||||||
| ATHDFS_J223150.6-605258 | NO | |||||||||||||
| ATHDFS_J223203.0-605242A | YES | 4335 | 24.00 | 0.69 | 24.63 | 0.54 | 24.10 | 0.54 | 23.11 | 0.42 | 21.59 | 0.45 | 0.00 | 0.00 |
| ATHDFS_J223203.0-605242B | YES | 5262 | 22.06 | 0.18 | 22.18 | 0.09 | 20.81 | 0.05 | 19.74 | 0.03 | 18.97 | 0.07 | 0.34 | 0.04 |
| ATHDFS_J223301.5-605250A | NO | |||||||||||||
| ATHDFS_J223301.5-605250B | NO | |||||||||||||
| ATHDFS_J223458.6-605225 | YES | 5184 | 23.25 | 0.38 | 23.95 | 0.35 | 22.10 | 0.11 | 20.69 | 0.06 | 19.30 | 0.07 | 0.71 | 0.21 |
| ATHDFS_J223345.4-605227 | YES | 5052 | 21.29 | 0.04 | 21.69 | 0.03 | 21.25 | 0.03 | 20.59 | 0.03 | 19.80 | 0.06 | 1.44 | 0.11 |
| ATHDFS_J223454.9-605211 | YES | 7441 | 16.73 | 0.00 | 17.03 | 0.00 | 16.28 | 0.00 | 15.78 | 0.00 | 15.16 | 0.00 | 1.70 | 0.06 |
| ATHDFS_J223352.5-605210 | NO | |||||||||||||
| ATHDFS_J223241.8-605209 | YES | 6536 | 19.67 | 0.03 | 19.55 | 0.01 | 18.28 | 0.01 | 17.59 | 0.01 | 16.88 | 0.01 | 0.10 | 0.10 |
| ATHDFS_J223242.9-605155 | NO | |||||||||||||
| ATHDFS_J223223.3-605137 | YES | 6147 | 23.25 | 0.36 | 23.50 | 0.23 | 21.99 | 0.10 | 20.77 | 0.07 | 19.69 | 0.10 | 0.51 | 0.06 |
| ATHDFS_J223323.8-605141 | YES | 5841 | 23.66 | 0.27 | 24.84 | 0.30 | 23.77 | 0.21 | 23.08 | 0.15 | 22.52 | 0.43 | 0.51 | 0.20 |
| ATHDFS_J223420.1-605138 | YES | 5963 | 23.58 | 0.46 | 24.95 | 0.58 | 24.17 | 0.58 | 22.81 | 0.24 | 21.70 | 0.40 | 0.82 | 0.18 |
| ATHDFS_J223427.0-605132 | YES | 6206 | 21.34 | 0.08 | 21.78 | 0.04 | 20.92 | 0.04 | 20.20 | 0.03 | 19.60 | 0.08 | 0.51 | 0.06 |
| ATHDFS_J223238.8-605113 | YES | 6412 | 25.27 | 0.86 | 25.88 | 0.45 | 25.22 | 0.53 | 24.62 | 0.45 | 23.69 | 0.70 | 0.78 | 0.09 |
| ATHDFS_J223403.1-605101 | NO | |||||||||||||
| ATHDFS_J223139.6-605039 | YES | 7850 | 21.35 | 0.10 | 21.13 | 0.03 | 19.69 | 0.02 | 18.82 | 0.01 | 18.13 | 0.03 | 0.25 | 0.05 |
| ATHDFS_J223257.0-605039 | NO | |||||||||||||
| ATHDFS_J223226.9-605029 | NO | |||||||||||||
| ATHDFS_J223142.8-605024 | YES | 7623 | 24.26 | 1.11 | 23.63 | 0.23 | 22.21 | 0.13 | 21.11 | 0.07 | 20.01 | 0.12 | 0.51 | 0.09 |
| ATHDFS_J223238.5-605018 | YES | 8002 | 23.53 | 0.65 | 23.58 | 0.27 | 21.93 | 0.12 | 20.62 | 0.06 | 19.43 | 0.09 | 0.57 | 0.04 |
| ATHDFS_J223306.7-605014 | NO | |||||||||||||
| ATHDFS_J223411.6-604931 | YES | 9586 | 19.18 | 0.02 | 19.19 | 0.01 | 18.16 | 0.00 | 17.57 | 0.00 | 16.92 | 0.01 | 0.02 | 0.04 |
| ATHDFS_J223329.3-604931 | NO | |||||||||||||
| ATHDFS_J223221.3-604929 | YES | 8703 | 25.91 | 0.75 | 24.41 | 0.34 | 22.68 | 0.11 | 21.69 | 0.17 | 0.51 | 0.14 | ||
| ATHDFS_J223223.6-604923 | YES | 9407 | 22.54 | 0.17 | 22.86 | 0.11 | 21.51 | 0.05 | 20.44 | 0.04 | 19.66 | 0.07 | 0.34 | 0.05 |
| ATHDFS_J223301.3-604926 | YES | 8800 | 24.33 | 0.83 | 23.90 | 0.20 | 23.01 | 0.18 | 21.69 | 0.08 | 20.79 | 0.15 | 0.42 | 0.09 |
| ATHDFS_J223414.3-604923 | YES | 8925 | 24.16 | 0.89 | 24.56 | 0.47 | 22.75 | 0.18 | 21.63 | 0.10 | 20.70 | 0.19 | 0.42 | 0.06 |
| ATHDFS_J223524.8-604918A | YES | 9212 | 22.24 | 0.18 | 22.59 | 0.10 | 21.59 | 0.08 | 20.64 | 0.06 | 19.48 | 0.09 | 0.78 | 0.13 |
| ATHDFS_J223524.8-604918B | YES | 10742 | 21.14 | 0.24 | 20.98 | 0.08 | 20.40 | 0.09 | 19.34 | 0.06 | 18.09 | 0.08 | 0.00 | 0.00 |
| ATHDFS_J223430.0-604922 | NO | |||||||||||||
| ATHDFS_J223454.0-604904 | NO | |||||||||||||
| ATHDFS_J223413.1-604909 | YES | 9829 | 19.31 | 0.02 | 19.68 | 0.01 | 18.68 | 0.01 | 18.13 | 0.01 | 17.51 | 0.02 | 0.19 | 0.11 |
| ATHDFS_J223502.1-604858 | NO | |||||||||||||
| ATHDFS_J223107.4-604855 | YES | 9250 | 26.25 | 8.03 | 25.67 | 1.84 | 24.14 | 0.90 | 23.18 | 0.60 | 21.86 | 0.86 | 0.00 | 0.00 |
| ATHDFS_J223400.5-604903A | YES | 9201 | 22.77 | 0.23 | 24.21 | 0.32 | 23.72 | 0.42 | 23.50 | 0.53 | 22.82 | 1.30 | 0.00 | 0.00 |
| ATHDFS_J223400.5-604903B | YES | 62540 | 24.33 | 0.66 | 25.22 | 0.52 | 24.75 | 0.72 | 24.02 | 0.54 | 23.31 | 1.20 | 0.00 | 0.00 |
| ATHDFS_J223359.4-604901 | YES | 62540 | 24.33 | 0.66 | 25.22 | 0.52 | 24.75 | 0.72 | 24.02 | 0.54 | 23.31 | 1.20 | 0.00 | 0.00 |
| ATHDFS_J223417.0-604857 | NO | |||||||||||||
| ATHDFS_J223543.9-604838 | YES | 10095 | 22.38 | 0.24 | 22.18 | 0.08 | 20.69 | 0.04 | 19.41 | 0.02 | 18.50 | 0.04 | 0.45 | 0.02 |
| ATHDFS_J223407.5-604847 | NO | |||||||||||||
| ATHDFS_J223235.6-604844 | YES | 9555 | 25.18 | 0.76 | 26.00 | 0.54 | 24.70 | 0.36 | 23.47 | 0.16 | 22.19 | 0.16 | 0.00 | 0.00 |
| ATHDFS_J223447.4-604843 | NO | |||||||||||||
| ATHDFS_J223452.0-604834 | YES | 10103 | 22.10 | 0.10 | 22.05 | 0.04 | 20.91 | 0.03 | 20.24 | 0.02 | 19.47 | 0.05 | 0.48 | 0.20 |
| ATHDFS_J223337.8-604833 | YES | 10186 | 22.42 | 0.16 | 22.27 | 0.07 | 21.25 | 0.05 | 20.18 | 0.03 | 19.31 | 0.06 | 0.67 | 0.08 |
| ATHDFS_J223146.9-604827 | NO | |||||||||||||
| ATHDFS_J223255.7-604823 | YES | 10223 | 22.86 | 0.22 | 23.47 | 0.14 | 22.53 | 0.12 | 21.44 | 0.06 | 20.36 | 0.10 | 0.78 | 0.09 |
| ATHDFS_J223250.5-604814 | YES | 10508 | 21.79 | 0.12 | 22.05 | 0.06 | 21.46 | 0.06 | 20.52 | 0.04 | 19.61 | 0.08 | 0.74 | 0.37 |
| ATHDFS_J223109.5-604810 | YES | 62785 | 23.36 | 0.44 | 24.21 | 0.36 | 24.03 | 0.60 | 24.19 | 1.06 | 22.68 | 1.24 | 0.00 | 0.00 |
| ATHDFS_J223359.7-604806 | NO | |||||||||||||
| ATHDFS_J223243.0-604758 | YES | 10708 | 21.50 | 0.06 | 21.93 | 0.03 | 21.34 | 0.03 | 20.58 | 0.02 | 19.95 | 0.06 | 0.60 | 0.19 |
| ATHDFS_J223414.7-604753 | YES | 11505 | 19.54 | 0.02 | 19.62 | 0.01 | 18.55 | 0.01 | 17.95 | 0.01 | 17.27 | 0.01 | 0.03 | 0.05 |
| ATHDFS_J223217.6-604751 | YES | 10719 | 22.52 | 0.10 | 23.03 | 0.06 | 22.70 | 0.08 | 22.21 | 0.08 | 21.51 | 0.16 | 1.24 | 0.09 |
| ATHDFS_J223417.5-604749 | YES | 11211 | 19.80 | 0.02 | 20.11 | 0.01 | 19.33 | 0.01 | 18.92 | 0.01 | 18.38 | 0.03 | 0.04 | 0.05 |
| ATHDFS_J223226.8-604745 | YES | 10922 | 24.23 | 0.43 | 24.55 | 0.24 | 23.46 | 0.16 | 22.26 | 0.09 | 21.32 | 0.14 | 0.71 | 0.12 |
| ATHDFS_J223254.0-604736 | NO | |||||||||||||
| ATHDFS_J223340.2-604730 | NO | |||||||||||||
| ATHDFS_J223141.7-604725 | NO | |||||||||||||
| ATHDFS_J223353.3-604723 | YES | 11347 | 22.93 | 0.19 | 23.83 | 0.18 | 23.39 | 0.26 | 22.79 | 0.22 | 21.57 | 0.29 | 2.05 | 0.01 |
| ATHDFS_J223527.5-604714 | NO | |||||||||||||
| ATHDFS_J223444.0-604710 | NO | |||||||||||||
| ATHDFS_J223108.1-604706 | NO | |||||||||||||
| ATHDFS_J223315.8-604707 | YES | 11750 | 24.30 | 0.60 | 26.17 | 1.16 | 23.76 | 0.24 | 22.50 | 0.11 | 21.50 | 0.19 | 0.00 | 0.00 |
| ATHDFS_J223420.4-604658 | NO | |||||||||||||
| ATHDFS_J223527.8-604639A | YES | 63579 | 21.69 | 0.18 | 21.43 | 0.06 | 20.08 | 0.03 | 18.93 | 0.02 | 18.01 | 0.04 | 0.00 | 0.00 |
| ATHDFS_J223527.8-604639B | NO | |||||||||||||
| ATHDFS_J223231.6-604654 | YES | 11995 | 22.78 | 0.15 | 23.44 | 0.10 | 22.60 | 0.10 | 21.63 | 0.06 | 20.46 | 0.07 | 0.86 | 0.07 |
| ATHDFS_J223254.0-604650 | YES | 77236 | 23.08 | 0.31 | 23.18 | 0.12 | 22.21 | 0.10 | 21.29 | 0.06 | 20.28 | 0.11 | 0.00 | 0.00 |
| ATHDFS_J223147.2-604647 | NO | |||||||||||||
| ATHDFS_J223305.3-604647 | YES | 12766 | 21.82 | 0.14 | 21.20 | 0.03 | 19.73 | 0.02 | 18.72 | 0.01 | 17.92 | 0.03 | 0.34 | 0.04 |
| ATHDFS_J223118.9-604644 | YES | 12102 | 22.92 | 0.18 | 23.53 | 0.10 | 23.03 | 0.14 | 22.26 | 0.09 | 21.10 | 0.15 | 1.15 | 0.06 |
| ATHDFS_J223333.2-604642 | YES | 12681 | 21.46 | 0.06 | 21.10 | 0.02 | 19.82 | 0.01 | 19.03 | 0.01 | 18.26 | 0.02 | 0.23 | 0.14 |
| ATHDFS_J223300.3-604640 | YES | 12226 | 23.46 | 0.27 | 24.29 | 0.21 | 24.36 | 0.47 | 24.31 | 0.60 | 0.00 | 0.00 | ||
| ATHDFS_J223228.5-604642 | YES | 12390 | 22.18 | 0.10 | 22.43 | 0.06 | 21.67 | 0.06 | 20.64 | 0.04 | 19.69 | 0.06 | 0.74 | 0.05 |
| ATHDFS_J223536.8-604632 | YES | 14668 | 19.07 | 0.02 | 19.19 | 0.01 | 18.16 | 0.01 | 17.57 | 0.01 | 16.86 | 0.01 | 0.03 | 0.05 |
| ATHDFS_J223312.3-604630 | NO | |||||||||||||
| ATHDFS_J223330.4-604624 | YES | 13047 | 23.75 | 0.64 | 22.74 | 0.14 | 21.21 | 0.06 | 20.03 | 0.04 | 19.09 | 0.07 | 0.45 | 0.05 |
| ATHDFS_J223434.7-604603 | YES | 13093 | 23.94 | 0.76 | 24.51 | 0.63 | 23.37 | 0.41 | 22.99 | 0.53 | 21.42 | 0.53 | 0.00 | 0.00 |
| ATHDFS_J223310.2-604601 | YES | 13062 | 26.01 | 1.29 | 26.26 | 0.61 | 25.21 | 0.51 | 24.36 | 0.30 | 23.44 | 0.45 | 0.00 | 0.00 |
| ATHDFS_J223258.6-604548 | NO | |||||||||||||
| ATHDFS_J223329.6-604537 | NO | |||||||||||||
| ATHDFS_J223408.1-604534 | NO | |||||||||||||
| ATHDFS_J223342.9-604524 | YES | 15763 | 20.42 | 0.03 | 20.41 | 0.02 | 19.06 | 0.01 | 18.33 | 0.01 | 17.61 | 0.02 | 0.16 | 0.11 |
| ATHDFS_J223324.0-604516 | YES | 14909 | 22.95 | 0.25 | 23.12 | 0.16 | 21.82 | 0.08 | 20.64 | 0.06 | 19.72 | 0.09 | 0.42 | 0.07 |
| ATHDFS_J223320.1-604457 | YES | 14865 | 26.04 | 0.81 | 27.05 | 0.78 | 25.75 | 0.40 | 25.25 | 0.40 | 24.90 | 0.89 | 0.00 | 0.00 |
| ATHDFS_J223443.3-604452 | YES | 15446 | 19.21 | 0.01 | 19.77 | 0.01 | 19.37 | 0.01 | 19.15 | 0.01 | 18.74 | 0.02 | 1.70 | 0.46 |
| ATHDFS_J223121.4-604448 | NO | |||||||||||||
| ATHDFS_J223311.5-604449 | YES | 15226 | 23.40 | 0.22 | 23.90 | 0.14 | 23.49 | 0.19 | 23.02 | 0.19 | 22.11 | 0.31 | 1.06 | 0.09 |
| ATHDFS_J223319.1-604428 | YES | 16000 | 19.26 | 0.01 | 19.67 | 0.01 | 19.39 | 0.01 | 18.92 | 0.01 | 18.14 | 0.01 | 1.24 | 0.07 |
| ATHDFS_J223210.3-604433 | YES | 15892 | 23.11 | 0.29 | 23.55 | 0.24 | 22.27 | 0.12 | 20.85 | 0.07 | 19.46 | 0.07 | 0.71 | 0.36 |
| ATHDFS_J223439.0-604435 | YES | 15617 | 24.15 | 0.41 | 24.14 | 0.19 | 23.17 | 0.13 | 21.87 | 0.07 | 20.86 | 0.11 | 0.48 | 0.10 |
| ATHDFS_J223356.9-604438 | NO | |||||||||||||
| ATHDFS_J223244.1-604437 | YES | 15346 | 23.56 | 0.24 | 24.92 | 0.33 | 24.12 | 0.26 | 23.82 | 0.36 | 23.66 | 1.16 | 0.32 | 0.16 |
| ATHDFS_J223147.2-604415 | YES | 16415 | 23.89 | 0.64 | 23.18 | 0.17 | 21.49 | 0.06 | 20.11 | 0.04 | 19.14 | 0.06 | 0.48 | 0.02 |
| ATHDFS_J223326.3-604416 | YES | 15866 | 27.61 | 4.92 | 26.91 | 1.08 | 25.48 | 0.49 | 24.78 | 0.40 | 23.79 | 0.54 | 0.00 | 0.00 |
| ATHDFS_J223255.2-604415 | NO | |||||||||||||
| ATHDFS_J223422.4-604412 | YES | 16135 | 23.26 | 0.30 | 23.65 | 0.19 | 22.86 | 0.16 | 22.02 | 0.13 | 20.79 | 0.16 | 0.89 | 0.08 |
| ATHDFS_J223226.8-604408 | YES | 16159 | 24.62 | 0.64 | 24.48 | 0.26 | 23.65 | 0.20 | 22.70 | 0.15 | 21.37 | 0.16 | 0.86 | 0.17 |
| ATHDFS_J223313.9-604359 | YES | 17040 | 19.46 | 0.01 | 19.67 | 0.01 | 18.79 | 0.01 | 18.30 | 0.01 | 17.71 | 0.02 | 1.99 | 0.30 |
| ATHDFS_J223255.6-604400 | NO | |||||||||||||
| ATHDFS_J223101.3-604351 | YES | 16350 | 26.99 | 5.97 | 24.49 | 0.25 | 24.05 | 0.30 | 23.69 | 0.35 | 22.73 | 0.60 | 1.49 | 2.04 |
| ATHDFS_J223319.1-604348 | YES | 64451 | 25.10 | 0.39 | 25.82 | 0.29 | 25.61 | 0.41 | 25.93 | 0.88 | 0.00 | 0.00 | ||
| ATHDFS_J223147.4-604338 | YES | 17120 | 20.60 | 0.03 | 21.08 | 0.02 | 20.65 | 0.03 | 20.04 | 0.03 | 19.41 | 0.07 | 0.60 | 0.11 |
| ATHDFS_J223126.2-604337 | YES | 17692 | 18.28 | 0.01 | 18.40 | 0.00 | 17.89 | 0.00 | 17.53 | 0.00 | 17.11 | 0.01 | 0.01 | 0.07 |
| ATHDFS_J223439.7-604337 | NO | |||||||||||||
| ATHDFS_J223534.3-604328 | YES | 16988 | 24.22 | 0.27 | 25.11 | 0.22 | 24.66 | 0.29 | 24.14 | 0.25 | 23.66 | 0.56 | 0.64 | 0.14 |
| ATHDFS_J223250.6-604336 | YES | 16978 | 23.93 | 0.34 | 24.05 | 0.16 | 23.37 | 0.17 | 22.62 | 0.13 | 21.55 | 0.18 | 1.11 | 0.18 |
| ATHDFS_J223522.2-604326 | YES | 18162 | 19.34 | 0.01 | 19.57 | 0.01 | 18.72 | 0.01 | 18.25 | 0.01 | 17.62 | 0.02 | 1.87 | 0.32 |
| ATHDFS_J223330.4-604332 | NO | |||||||||||||
| ATHDFS_J223355.6-604315 | YES | 64709 | 24.40 | 0.46 | 23.85 | 0.45 | 23.17 | 0.50 | 22.15 | 0.72 | 0.00 | 0.00 | ||
| ATHDFS_J223440.4-604309 | YES | 18005 | 20.50 | 0.02 | 20.84 | 0.02 | 19.77 | 0.01 | 19.12 | 0.01 | 18.47 | 0.02 | 0.34 | 0.17 |
| ATHDFS_J223430.8-604310 | YES | 18194 | 21.05 | 0.05 | 21.41 | 0.03 | 20.33 | 0.02 | 19.68 | 0.02 | 19.04 | 0.05 | 0.34 | 0.17 |
| ATHDFS_J223240.2-604306 | YES | 18233 | 20.22 | 0.02 | 20.74 | 0.01 | 19.90 | 0.01 | 19.27 | 0.01 | 18.63 | 0.02 | 0.51 | 0.14 |
| ATHDFS_J223207.9-604305 | YES | 17752 | 22.56 | 0.11 | 22.92 | 0.07 | 22.12 | 0.06 | 21.23 | 0.04 | 20.28 | 0.07 | 0.74 | 0.13 |
| ATHDFS_J223427.3-604258 | NO | |||||||||||||
| ATHDFS_J223130.4-604232 | YES | 18511 | 28.96 | 16.49 | 25.55 | 1.28 | 23.58 | 0.35 | 22.60 | 0.55 | 0.00 | 0.00 | ||
| ATHDFS_J223425.8-604232 | NO | |||||||||||||
| ATHDFS_J223239.0-604230 | YES | 18609 | 25.31 | 1.12 | 24.40 | 0.22 | 23.45 | 0.16 | 22.69 | 0.13 | 22.14 | 0.29 | 0.03 | 0.04 |
| ATHDFS_J223312.4-604227 | YES | 18851 | 22.69 | 0.13 | 22.88 | 0.07 | 21.86 | 0.05 | 20.97 | 0.04 | 20.26 | 0.07 | 0.57 | 0.07 |
| ATHDFS_J223437.2-604214 | YES | 19594 | 22.44 | 0.21 | 22.43 | 0.11 | 20.99 | 0.05 | 19.67 | 0.03 | 18.78 | 0.05 | 0.45 | 0.03 |
| ATHDFS_J223508.5-604217 | NO | |||||||||||||
| ATHDFS_J223338.8-604216 | YES | 20683 | 19.62 | 0.03 | 20.13 | 0.02 | 19.34 | 0.02 | 18.91 | 0.03 | 18.15 | 0.05 | 1.65 | 0.18 |
| ATHDFS_J223523.6-604207 | YES | 19238 | 24.90 | 0.73 | 25.19 | 0.42 | 23.60 | 0.17 | 22.34 | 0.09 | 21.34 | 0.13 | 0.48 | 0.04 |
| ATHDFS_J223135.8-604207 | YES | 19624 | 23.06 | 0.32 | 22.89 | 0.12 | 21.29 | 0.05 | 20.12 | 0.03 | 19.26 | 0.06 | 0.40 | 0.03 |
| ATHDFS_J223359.8-604155 | YES | 22915 | 16.70 | 0.00 | 16.56 | 0.00 | 15.79 | 0.00 | 15.26 | 0.00 | 14.67 | 0.00 | 0.10 | 0.06 |
| ATHDFS_J223255.4-604151 | YES | 19803 | 20.27 | 0.02 | 21.03 | 0.01 | 20.45 | 0.01 | 20.13 | 0.01 | 19.85 | 0.04 | 0.16 | 0.15 |
| ATHDFS_J223158.4-604142 | YES | 19985 | 23.23 | 0.20 | 23.62 | 0.15 | 22.74 | 0.10 | 21.69 | 0.07 | 20.56 | 0.09 | 0.82 | 0.09 |
| ATHDFS_J223339.5-604131 | YES | 20376 | 21.86 | 0.06 | 21.82 | 0.03 | 20.56 | 0.01 | 19.88 | 0.01 | 19.16 | 0.02 | 0.00 | 0.00 |
| ATHDFS_J223224.5-604113 | YES | 20664 | 23.84 | 0.40 | 24.93 | 0.47 | 23.13 | 0.17 | 21.62 | 0.07 | 20.40 | 0.08 | 0.60 | 0.07 |
| ATHDFS_J223206.5-604102 | NO | |||||||||||||
| ATHDFS_J223448.3-604042 | YES | 21863 | 20.14 | 0.02 | 20.20 | 0.01 | 19.38 | 0.01 | 18.88 | 0.01 | 18.24 | 0.02 | 0.11 | 0.09 |
| ATHDFS_J223430.1-604043 | YES | 21416 | 21.82 | 0.10 | 22.13 | 0.05 | 21.27 | 0.05 | 20.25 | 0.03 | 19.52 | 0.06 | 0.60 | 0.06 |
| ATHDFS_J223251.1-604042 | NO | |||||||||||||
| ATHDFS_J223514.4-604024 | NO | |||||||||||||
| ATHDFS_J223348.2-604026 | NO | |||||||||||||
| ATHDFS_J223429.8-604020 | NO | |||||||||||||
| ATHDFS_J223417.8-604009 | NO | |||||||||||||
| ATHDFS_J223337.5-604006 | YES | 22318 | 21.27 | 0.05 | 21.80 | 0.04 | 20.84 | 0.03 | 20.21 | 0.03 | 19.71 | 0.06 | 0.40 | 0.05 |
| ATHDFS_J223412.2-603957 | YES | 22415 | 24.04 | 1.21 | 23.85 | 0.39 | 23.48 | 0.56 | 22.35 | 0.32 | 21.20 | 0.52 | 0.00 | 0.00 |
| ATHDFS_J223438.0-603951 | YES | 22360 | 24.86 | 1.14 | 24.95 | 0.47 | 23.16 | 0.18 | 21.80 | 0.07 | 21.03 | 0.16 | 0.42 | 0.05 |
| ATHDFS_J223343.9-603953 | NO | |||||||||||||
| ATHDFS_J223047.9-603933 | YES | 22586 | 22.88 | 0.21 | 23.11 | 0.09 | 21.90 | 0.06 | 21.01 | 0.04 | 20.24 | 0.09 | 0.57 | 0.05 |
| ATHDFS_J223324.7-603934 | NO | |||||||||||||
| ATHDFS_J223220.6-603931 | YES | 23537 | 21.07 | 0.08 | 20.73 | 0.03 | 19.20 | 0.01 | 18.28 | 0.01 | 17.52 | 0.02 | 0.30 | 0.03 |
| ATHDFS_J223529.2-603927 | YES | 23056 | 24.10 | 0.39 | 22.45 | 0.17 | 21.00 | 0.07 | 19.84 | 0.11 | 0.54 | 0.25 | ||
| ATHDFS_J223400.2-603930 | YES | 23076 | 21.83 | 0.12 | 22.42 | 0.08 | 21.71 | 0.09 | 20.91 | 0.07 | 19.91 | 0.12 | 0.71 | 0.13 |
| ATHDFS_J223207.9-603928 | NO | |||||||||||||
| ATHDFS_J223222.7-603924 | YES | 23175 | 20.75 | 0.03 | 21.26 | 0.02 | 20.32 | 0.02 | 19.56 | 0.02 | 18.96 | 0.03 | 0.54 | 0.06 |
| ATHDFS_J223253.7-603921 | YES | 22985 | 23.51 | 0.41 | 24.16 | 0.26 | 22.93 | 0.18 | 21.85 | 0.09 | 20.68 | 0.13 | 0.54 | 0.14 |
| ATHDFS_J223331.3-603914 | YES | 23177 | 24.95 | 0.75 | 24.83 | 0.27 | 23.58 | 0.17 | 22.31 | 0.08 | 21.28 | 0.12 | 0.48 | 0.07 |
| ATHDFS_J223123.1-603903 | YES | 23227 | 26.93 | 5.15 | 24.53 | 0.19 | 24.15 | 0.27 | 23.34 | 0.17 | 22.87 | 0.48 | 0.16 | 0.34 |
| ATHDFS_J223258.7-603903 | NO | |||||||||||||
| ATHDFS_J223245.6-603857 | YES | 23411 | 24.43 | 0.46 | 25.50 | 0.41 | 25.45 | 0.77 | 24.60 | 0.46 | 23.39 | 0.64 | 0.00 | 0.00 |
| ATHDFS_J223205.9-603857 | NO | |||||||||||||
| ATHDFS_J223144.4-603858 | YES | 23788 | 21.83 | 0.13 | 21.52 | 0.04 | 20.02 | 0.02 | 19.01 | 0.01 | 18.29 | 0.03 | 0.32 | 0.02 |
| ATHDFS_J223153.7-603853 | YES | 23604 | 21.44 | 0.07 | 21.98 | 0.04 | 21.53 | 0.05 | 20.82 | 0.04 | 20.08 | 0.10 | 0.89 | 0.22 |
| ATHDFS_J223450.4-603844 | YES | 25648 | 21.66 | 0.15 | 21.32 | 0.05 | 19.86 | 0.03 | 18.61 | 0.02 | 17.75 | 0.03 | 0.42 | 0.02 |
| ATHDFS_J223307.1-603846 | YES | 23987 | 22.82 | 0.25 | 22.86 | 0.10 | 21.97 | 0.09 | 20.88 | 0.05 | 20.12 | 0.11 | 0.64 | 0.05 |
| ATHDFS_J223457.3-603840 | YES | 24550 | 20.84 | 0.05 | 21.12 | 0.03 | 20.22 | 0.02 | 19.24 | 0.02 | 18.43 | 0.03 | 0.64 | 0.05 |
| ATHDFS_J223232.3-603842 | YES | 66389 | 24.52 | 1.26 | 24.34 | 0.48 | 22.92 | 0.26 | 22.20 | 0.23 | 20.85 | 0.25 | 0.00 | 0.00 |
| ATHDFS_J223335.9-603828 | YES | 66607 | 21.90 | 0.09 | 21.78 | 0.04 | 20.77 | 0.03 | 19.90 | 0.02 | 19.10 | 0.04 | 0.00 | 0.00 |
| ATHDFS_J223505.5-603825 | NO | |||||||||||||
| ATHDFS_J223304.6-603835 | YES | 24126 | 22.97 | 0.31 | 22.91 | 0.11 | 21.82 | 0.08 | 20.75 | 0.05 | 19.77 | 0.08 | 0.71 | 0.11 |
| ATHDFS_J223608.1-603823 | NO | |||||||||||||
| ATHDFS_J223432.1-603815 | YES | 24325 | 26.58 | 2.35 | 25.38 | 0.25 | 25.13 | 0.37 | 24.69 | 0.32 | 23.52 | 0.43 | 0.00 | 0.00 |
| ATHDFS_J223138.7-603818 | YES | 24269 | 23.74 | 0.49 | 24.02 | 0.23 | 23.03 | 0.18 | 21.83 | 0.09 | 20.96 | 0.18 | 0.00 | 0.00 |
| ATHDFS_J223418.6-603808 | NO | |||||||||||||
| ATHDFS_J223442.7-603802 | NO | |||||||||||||
| ATHDFS_J223248.2-603805 | YES | 24623 | 22.96 | 0.24 | 23.24 | 0.11 | 22.07 | 0.08 | 21.24 | 0.05 | 20.49 | 0.11 | 0.54 | 0.06 |
| ATHDFS_J223334.4-603804 | YES | 24536 | 24.49 | 0.41 | 25.76 | 0.50 | 25.09 | 0.55 | 24.27 | 0.37 | 23.83 | 0.95 | 0.54 | 0.21 |
| ATHDFS_J223436.9-603754 | YES | 24869 | 24.16 | 0.74 | 24.13 | 0.26 | 24.63 | 0.80 | 22.79 | 0.22 | 21.30 | 0.25 | 1.29 | 0.67 |
| ATHDFS_J223346.9-603753 | NO | |||||||||||||
| ATHDFS_J223254.5-603748 | YES | 25724 | 20.00 | 0.03 | 20.17 | 0.01 | 19.11 | 0.01 | 18.56 | 0.01 | 17.91 | 0.02 | 0.21 | 0.12 |
| ATHDFS_J223350.0-603741 | YES | 25301 | 24.33 | 1.08 | 24.57 | 0.68 | 22.69 | 0.24 | 21.00 | 0.09 | 19.87 | 0.13 | 0.00 | 0.00 |
| ATHDFS_J223441.6-603740 | NO | |||||||||||||
| ATHDFS_J223232.8-603737 | YES | 25211 | 25.37 | 0.60 | 24.38 | 0.54 | 23.05 | 0.22 | 21.46 | 0.19 | 0.00 | 0.00 | ||
| ATHDFS_J223142.5-603737 | NO | |||||||||||||
| ATHDFS_J223404.8-603732 | YES | 25233 | 23.83 | 0.35 | 25.17 | 0.40 | 24.28 | 0.35 | 23.53 | 0.24 | 21.60 | 0.18 | 0.00 | 0.00 |
| ATHDFS_J223503.2-603729 | YES | 66867 | 25.04 | 1.16 | 25.21 | 0.55 | 24.94 | 0.86 | 23.64 | 0.40 | 22.78 | 0.67 | 0.00 | 0.00 |
| ATHDFS_J223437.7-603726 | YES | 25557 | 21.10 | 0.04 | 21.48 | 0.02 | 20.67 | 0.02 | 19.98 | 0.02 | 19.41 | 0.04 | 0.48 | 0.08 |
| ATHDFS_J223417.1-603724 | YES | 26355 | 20.04 | 0.03 | 20.22 | 0.01 | 19.04 | 0.01 | 18.37 | 0.01 | 17.70 | 0.02 | 0.07 | 0.08 |
| ATHDFS_J223341.2-603724 | YES | 25664 | 22.52 | 0.15 | 22.99 | 0.11 | 22.63 | 0.14 | 21.80 | 0.11 | 20.87 | 0.20 | 0.82 | 0.10 |
| ATHDFS_J223225.6-603717 | YES | 25818 | 21.92 | 0.08 | 22.24 | 0.04 | 21.55 | 0.05 | 20.70 | 0.03 | 20.12 | 0.07 | 0.54 | 0.06 |
| ATHDFS_J223202.5-603714 | YES | 25570 | 25.90 | 1.08 | 26.45 | 0.65 | 25.87 | 0.72 | 24.97 | 0.39 | 23.60 | 0.41 | 0.00 | 0.00 |
| ATHDFS_J223326.0-603716 | NO | |||||||||||||
| ATHDFS_J223506.5-603700 | YES | 26042 | 23.57 | 0.59 | 23.86 | 0.37 | 23.44 | 0.47 | 22.97 | 0.56 | 23.75 | 4.46 | 0.34 | 0.29 |
| ATHDFS_J223236.6-603657 | YES | 26333 | 22.84 | 0.25 | 22.75 | 0.10 | 21.47 | 0.06 | 20.25 | 0.03 | 19.33 | 0.05 | 0.42 | 0.06 |
| ATHDFS_J223400.2-603653 | YES | 27413 | 18.09 | 0.01 | 18.06 | 0.00 | 17.26 | 0.00 | 16.68 | 0.00 | 16.06 | 0.01 | 0.12 | 0.09 |
| ATHDFS_J223525.8-603652 | YES | 26231 | 23.45 | 0.29 | 24.12 | 0.18 | 23.20 | 0.16 | 22.18 | 0.09 | 20.82 | 0.11 | 0.86 | 0.18 |
| ATHDFS_J223343.7-603651 | YES | 78036 | 24.61 | 0.36 | 26.82 | 0.97 | 26.10 | 1.01 | 26.11 | 1.42 | 25.51 | 3.05 | 0.00 | 0.00 |
| ATHDFS_J223404.3-603638 | YES | 26898 | 24.40 | 1.30 | 23.78 | 0.28 | 23.25 | 0.35 | 21.55 | 0.11 | 20.58 | 0.22 | 0.48 | 0.13 |
| ATHDFS_J223158.1-603636 | NO | |||||||||||||
| ATHDFS_J223605.7-603631 | NO | |||||||||||||
| ATHDFS_J223406.7-603637 | YES | 27011 | 19.35 | 0.01 | 19.45 | 0.01 | 18.80 | 0.01 | 18.34 | 0.01 | 17.83 | 0.02 | 0.01 | 0.05 |
| ATHDFS_J223054.4-603631 | NO | |||||||||||||
| ATHDFS_J223439.9-603629 | NO | |||||||||||||
| ATHDFS_J223341.9-603634 | YES | 67204 | 27.65 | 8.70 | 25.35 | 0.47 | 24.79 | 0.56 | 25.10 | 1.12 | 23.86 | 1.42 | 0.00 | 0.00 |
| ATHDFS_J223451.7-603632 | YES | 26969 | 20.81 | 0.04 | 21.15 | 0.02 | 19.96 | 0.02 | 19.33 | 0.01 | 18.73 | 0.03 | 0.32 | 0.09 |
| ATHDFS_J223429.9-603629 | NO | |||||||||||||
| ATHDFS_J223316.5-603627 | YES | 26828 | 21.67 | 0.07 | 22.20 | 0.04 | 21.75 | 0.06 | 21.24 | 0.05 | 20.68 | 0.14 | 0.60 | 0.13 |
| ATHDFS_J223526.2-603617 | YES | 27151 | 22.06 | 0.14 | 22.42 | 0.07 | 21.16 | 0.05 | 20.41 | 0.04 | 19.65 | 0.09 | 0.51 | 0.10 |
| ATHDFS_J223518.7-603619 | YES | 26781 | 24.75 | 0.49 | 25.20 | 0.25 | 24.65 | 0.36 | 25.04 | 0.66 | 23.83 | 0.81 | 0.00 | 0.00 |
| ATHDFS_J223456.2-603619 | NO | |||||||||||||
| ATHDFS_J223158.5-603614 | YES | 27308 | 21.20 | 0.04 | 21.61 | 0.03 | 20.65 | 0.03 | 19.85 | 0.02 | 19.23 | 0.05 | 0.51 | 0.09 |
| ATHDFS_J223410.3-603613 | NO | |||||||||||||
| ATHDFS_J223421.8-603603 | YES | 27512 | 20.77 | 0.04 | 21.23 | 0.02 | 20.35 | 0.02 | 19.86 | 0.02 | 19.31 | 0.05 | 2.05 | 0.08 |
| ATHDFS_J223232.4-603542A | YES | 27891 | 23.48 | 0.30 | 23.06 | 0.10 | 21.52 | 0.04 | 20.24 | 0.02 | 19.38 | 0.04 | 0.42 | 0.01 |
| ATHDFS_J223232.4-603542B | YES | 27891 | 23.48 | 0.30 | 23.06 | 0.10 | 21.52 | 0.04 | 20.24 | 0.02 | 19.38 | 0.04 | 0.42 | 0.01 |
| ATHDFS_J223104.8-603549 | YES | 27508 | 22.78 | 0.13 | 23.44 | 0.11 | 22.65 | 0.09 | 21.60 | 0.06 | 20.71 | 0.12 | 0.71 | 0.06 |
| ATHDFS_J223525.7-603544 | YES | 28923 | 18.36 | 0.01 | 18.27 | 0.00 | 17.73 | 0.00 | 17.33 | 0.00 | 16.85 | 0.01 | 0.04 | 0.05 |
| ATHDFS_J223229.8-603544 | NO | |||||||||||||
| ATHDFS_J223422.0-603544 | YES | 27716 | 24.33 | 0.38 | 24.64 | 0.18 | 24.09 | 0.20 | 23.88 | 0.23 | 23.77 | 0.94 | 2.17 | 0.31 |
| ATHDFS_J223224.0-603537 | YES | 27764 | 26.70 | 1.60 | 25.77 | 1.15 | 24.95 | 0.90 | 0.00 | 0.00 | ||||
| ATHDFS_J223253.0-603539 | YES | 27740 | 25.28 | 0.70 | 25.91 | 0.48 | 24.99 | 0.42 | 24.15 | 0.27 | 23.19 | 0.51 | 0.74 | 0.16 |
| ATHDFS_J223459.4-603535 | NO | |||||||||||||
| ATHDFS_J223245.3-603537 | YES | 27774 | 25.87 | 1.23 | 26.02 | 0.55 | 25.47 | 0.63 | 24.62 | 0.45 | 23.77 | 0.92 | 0.00 | 0.00 |
| ATHDFS_J223046.1-603525 | YES | 28396 | 21.21 | 0.05 | 21.33 | 0.03 | 20.29 | 0.02 | 19.38 | 0.02 | 18.64 | 0.03 | 0.57 | 0.06 |
| ATHDFS_J223435.5-603532 | YES | 27950 | 24.87 | 0.47 | 25.15 | 1.00 | 23.83 | 0.54 | 22.13 | 0.48 | 0.00 | 0.00 | ||
| ATHDFS_J223338.8-603523 | YES | 28580 | 21.65 | 0.06 | 21.41 | 0.02 | 20.04 | 0.01 | 19.29 | 0.01 | 18.61 | 0.02 | 0.16 | 0.10 |
| ATHDFS_J223208.3-603519 | YES | 29715 | 20.23 | 0.03 | 20.26 | 0.02 | 18.91 | 0.01 | 18.17 | 0.01 | 17.49 | 0.02 | 0.45 | 0.08 |
| ATHDFS_J223223.7-603520 | NO | |||||||||||||
| ATHDFS_J223344.9-603515 | YES | 29000 | 20.28 | 0.02 | 20.71 | 0.02 | 19.97 | 0.02 | 19.25 | 0.02 | 18.69 | 0.04 | 0.51 | 0.12 |
| ATHDFS_J223524.8-603509 | YES | 78160 | 23.03 | 0.21 | 23.21 | 0.09 | 22.36 | 0.07 | 21.45 | 0.05 | 20.55 | 0.10 | 0.00 | 0.00 |
| ATHDFS_J223536.3-603506 | YES | 28872 | 22.81 | 0.25 | 23.83 | 0.26 | 22.81 | 0.20 | 21.96 | 0.15 | 20.68 | 0.21 | 0.89 | 0.15 |
| ATHDFS_J223410.1-603510 | NO | |||||||||||||
| ATHDFS_J223549.5-603502 | YES | 28888 | 23.07 | 0.25 | 23.55 | 0.15 | 22.34 | 0.10 | 21.34 | 0.06 | 20.61 | 0.14 | 0.57 | 0.04 |
| ATHDFS_J223350.5-603503 | YES | 28687 | 26.73 | 4.97 | 26.86 | 2.62 | 26.25 | 2.53 | 24.59 | 0.97 | 23.08 | 0.90 | 0.00 | 0.00 |
| ATHDFS_J223229.2-603459A | NO | |||||||||||||
| ATHDFS_J223229.2-603459B | NO | |||||||||||||
| ATHDFS_J223541.5-603454 | YES | 29243 | 21.54 | 0.08 | 21.72 | 0.04 | 20.85 | 0.03 | 19.83 | 0.02 | 19.02 | 0.04 | 0.64 | 0.05 |
| ATHDFS_J223438.6-603450 | YES | 30870 | 20.45 | 0.04 | 20.21 | 0.02 | 18.96 | 0.01 | 17.99 | 0.01 | 17.27 | 0.02 | 0.30 | 0.06 |
| ATHDFS_J223103.2-603453 | YES | 29001 | 23.97 | 0.34 | 23.29 | 0.08 | 21.79 | 0.04 | 20.65 | 0.02 | 19.43 | 0.03 | 0.57 | 0.08 |
| ATHDFS_J223116.4-603452 | YES | 67850 | 24.84 | 0.59 | 25.40 | 0.40 | 25.49 | 0.81 | 24.21 | 0.39 | 22.56 | 0.34 | 0.00 | 0.00 |
| ATHDFS_J223431.8-603454 | YES | 28929 | 25.73 | 2.84 | 24.99 | 0.55 | 24.90 | 0.97 | 23.99 | 0.67 | 23.12 | 1.25 | 0.00 | 0.00 |
| ATHDFS_J223425.0-603452 | YES | 67937 | 22.08 | 0.09 | 22.97 | 0.07 | 22.46 | 0.09 | 22.00 | 0.09 | 21.25 | 0.18 | 0.00 | 0.00 |
| ATHDFS_J223212.3-603448 | YES | 29588 | 21.77 | 0.07 | 21.91 | 0.04 | 21.06 | 0.03 | 20.65 | 0.04 | 20.18 | 0.09 | 0.08 | 0.03 |
| ATHDFS_J223307.1-603448 | NO | |||||||||||||
| ATHDFS_J223207.4-603445 | YES | 29564 | 23.83 | 0.44 | 23.36 | 0.14 | 22.00 | 0.07 | 20.87 | 0.05 | 20.04 | 0.08 | 0.37 | 0.04 |
| ATHDFS_J223243.3-603443 | YES | 29735 | 21.37 | 0.06 | 21.67 | 0.04 | 20.55 | 0.02 | 19.60 | 0.02 | 18.87 | 0.05 | 0.57 | 0.02 |
| ATHDFS_J223410.6-603437 | NO | |||||||||||||
| ATHDFS_J223442.8-603433 | YES | 29755 | 21.99 | 0.09 | 22.02 | 0.05 | 21.27 | 0.04 | 20.61 | 0.04 | 19.91 | 0.08 | 0.57 | 0.20 |
| ATHDFS_J223216.6-603434 | YES | 29597 | 22.90 | 0.19 | 23.71 | 0.19 | 23.09 | 0.18 | 22.34 | 0.17 | 21.28 | 0.24 | 1.15 | 0.14 |
| ATHDFS_J223539.3-603424 | YES | 78212 | 23.03 | 0.26 | 23.77 | 0.20 | 22.80 | 0.17 | 21.78 | 0.10 | 20.37 | 0.12 | 0.00 | 0.00 |
| ATHDFS_J223153.2-603422 | YES | 29880 | 24.50 | 0.63 | 24.89 | 0.42 | 23.61 | 0.22 | 22.30 | 0.12 | 21.43 | 0.23 | 0.42 | 0.06 |
| ATHDFS_J223401.0-603424 | YES | 68104 | 21.87 | 0.05 | 21.90 | 0.02 | 20.56 | 0.01 | 19.83 | 0.01 | 19.14 | 0.02 | 0.00 | 0.00 |
| ATHDFS_J223245.5-603419 | YES | 30363 | 23.22 | 0.29 | 23.07 | 0.12 | 21.95 | 0.08 | 21.10 | 0.06 | 20.33 | 0.14 | 0.54 | 0.10 |
| ATHDFS_J223231.6-603423 | NO | |||||||||||||
| ATHDFS_J223055.9-603412 | NO | |||||||||||||
| ATHDFS_J223327.6-603414 | NO | |||||||||||||
| ATHDFS_J223311.9-603417 | YES | 29938 | 24.89 | 0.65 | 27.12 | 2.08 | 25.34 | 0.82 | 23.72 | 0.27 | 23.09 | 0.70 | 0.42 | 0.17 |
| ATHDFS_J223434.1-603410 | YES | 30150 | 24.19 | 0.55 | 25.20 | 0.51 | 25.38 | 0.99 | 24.14 | 0.57 | 23.62 | 1.45 | 0.00 | 0.00 |
| ATHDFS_J223053.2-603402 | YES | 30207 | 23.87 | 0.30 | 24.43 | 0.21 | 24.35 | 0.36 | 23.27 | 0.21 | 22.23 | 0.34 | 1.15 | 0.25 |
| ATHDFS_J223415.0-603408 | YES | 30652 | 21.90 | 0.10 | 22.24 | 0.05 | 21.35 | 0.04 | 20.41 | 0.03 | 19.74 | 0.07 | 0.57 | 0.10 |
| ATHDFS_J223529.7-603359 | NO | |||||||||||||
| ATHDFS_J223406.6-603401 | NO | |||||||||||||
| ATHDFS_J223409.7-603402 | YES | 30553 | 22.58 | 0.17 | 22.99 | 0.10 | 22.45 | 0.11 | 21.73 | 0.09 | 20.76 | 0.16 | 0.78 | 0.09 |
| ATHDFS_J223512.7-603353 | YES | 31037 | 23.58 | 0.51 | 23.66 | 0.31 | 22.15 | 0.12 | 20.83 | 0.08 | 19.65 | 0.10 | 0.57 | 0.05 |
| ATHDFS_J223306.0-603350 | YES | 32354 | 18.62 | 0.01 | 18.73 | 0.01 | 17.77 | 0.00 | 17.23 | 0.00 | 16.58 | 0.01 | 0.17 | 0.09 |
| ATHDFS_J223329.7-603352 | YES | 30616 | 24.60 | 0.49 | 25.80 | 0.64 | 24.67 | 0.39 | 25.12 | 0.96 | 23.85 | 1.08 | 0.00 | 0.00 |
| ATHDFS_J223258.5-603346 | NO | |||||||||||||
| ATHDFS_J223243.4-603352 | YES | 30896 | 19.86 | 0.01 | 20.31 | 0.01 | 20.28 | 0.01 | 19.88 | 0.01 | 19.45 | 0.03 | 1.24 | 0.22 |
| ATHDFS_J223545.7-603342 | NO | |||||||||||||
| ATHDFS_J223138.5-603344 | YES | 30791 | 29.55 | 49.64 | 26.22 | 0.96 | 24.49 | 0.36 | 23.59 | 0.25 | 22.94 | 0.58 | 0.00 | 0.00 |
| ATHDFS_J223420.9-603336 | YES | 31164 | 22.37 | 0.18 | 22.96 | 0.13 | 22.62 | 0.17 | 22.36 | 0.24 | 21.74 | 0.56 | 1.11 | 0.22 |
| ATHDFS_J223225.0-603338 | YES | 31841 | 20.69 | 0.03 | 21.10 | 0.02 | 20.01 | 0.02 | 19.40 | 0.02 | 18.75 | 0.04 | 0.27 | 0.16 |
| ATHDFS_J223513.7-603333 | YES | 31824 | 21.15 | 0.05 | 21.45 | 0.03 | 20.39 | 0.02 | 19.61 | 0.02 | 18.92 | 0.04 | 0.51 | 0.15 |
| ATHDFS_J223247.6-603337 | YES | 31450 | 21.71 | 0.07 | 22.02 | 0.04 | 21.05 | 0.03 | 20.00 | 0.02 | 19.16 | 0.04 | 0.67 | 0.03 |
| ATHDFS_J223337.5-603329 | YES | 32168 | 16.90 | 0.00 | 17.39 | 0.00 | 17.16 | 0.00 | 16.93 | 0.00 | 16.51 | 0.00 | 1.34 | 0.06 |
| ATHDFS_J223253.1-603329 | YES | 31266 | 24.55 | 0.41 | 24.76 | 0.20 | 24.09 | 0.22 | 23.30 | 0.15 | 22.29 | 0.24 | 1.15 | 0.24 |
| ATHDFS_J223302.8-603323 | YES | 68484 | 23.48 | 0.39 | 23.50 | 0.19 | 23.28 | 0.30 | 22.62 | 0.28 | 22.31 | 0.87 | 0.00 | 0.00 |
| ATHDFS_J223509.5-603257 | NO | |||||||||||||
| ATHDFS_J223327.9-603304A | NO | |||||||||||||
| ATHDFS_J223327.9-603304B | NO | |||||||||||||
| ATHDFS_J223306.2-603307 | NO | |||||||||||||
| ATHDFS_J223339.4-603306 | NO | |||||||||||||
| ATHDFS_J223121.6-603301 | YES | 31880 | 24.19 | 0.36 | 24.45 | 0.19 | 23.79 | 0.19 | 23.12 | 0.16 | 21.69 | 0.18 | 1.02 | 0.15 |
| ATHDFS_J223242.6-603258 | NO | |||||||||||||
| ATHDFS_J223234.2-603257 | YES | 32062 | 26.55 | 1.70 | 25.72 | 0.32 | 26.04 | 0.74 | 24.94 | 0.41 | 24.63 | 1.03 | 0.00 | 0.00 |
| ATHDFS_J223308.6-603251 | YES | 32373 | 24.24 | 0.53 | 24.56 | 0.32 | 23.07 | 0.16 | 21.77 | 0.08 | 20.45 | 0.09 | 0.64 | 0.09 |
| ATHDFS_J223456.8-603251 | YES | 68728 | 23.35 | 0.28 | 23.81 | 0.21 | 23.51 | 0.27 | 23.08 | 0.34 | 22.17 | 0.54 | 0.00 | 0.00 |
| ATHDFS_J223323.2-603249 | NO | |||||||||||||
| ATHDFS_J223209.7-603253 | NO | |||||||||||||
| ATHDFS_J223212.9-603234A | YES | 32725 | 23.60 | 0.20 | 24.36 | 0.18 | 23.63 | 0.16 | 22.99 | 0.14 | 22.02 | 0.21 | 0.74 | 0.09 |
| ATHDFS_J223212.9-603234B | YES | 32725 | 23.60 | 0.20 | 24.36 | 0.18 | 23.63 | 0.16 | 22.99 | 0.14 | 22.02 | 0.21 | 0.74 | 0.09 |
| ATHDFS_J223229.5-603243 | YES | 68773 | 22.61 | 0.13 | 23.34 | 0.12 | 23.10 | 0.16 | 22.49 | 0.16 | 21.38 | 0.21 | 0.00 | 0.00 |
| ATHDFS_J223509.4-603235 | YES | 34751 | 17.36 | 0.00 | 17.07 | 0.00 | 16.02 | 0.00 | 15.49 | 0.00 | 14.89 | 0.00 | 3.06 | 0.11 |
| ATHDFS_J223142.5-603238 | YES | 68852 | 21.32 | 0.06 | 21.47 | 0.03 | 20.28 | 0.02 | 19.44 | 0.02 | 18.62 | 0.03 | 0.00 | 0.00 |
| ATHDFS_J223521.1-603235 | NO | |||||||||||||
| ATHDFS_J223317.7-603235 | YES | 68832 | 23.52 | 0.31 | 23.47 | 0.14 | 22.14 | 0.07 | 20.83 | 0.04 | 19.57 | 0.05 | 0.00 | 0.00 |
| ATHDFS_J223335.3-603234 | NO | |||||||||||||
| ATHDFS_J223429.9-603226 | YES | 32955 | 28.98 | 31.29 | 26.66 | 1.29 | 24.69 | 0.41 | 24.08 | 0.34 | 23.07 | 0.53 | 0.00 | 0.00 |
| ATHDFS_J223331.6-603222 | YES | 33347 | 21.51 | 0.05 | 22.04 | 0.04 | 21.24 | 0.03 | 20.55 | 0.03 | 19.90 | 0.06 | 0.57 | 0.10 |
| ATHDFS_J223504.4-603221 | YES | 33873 | 22.64 | 0.19 | 22.68 | 0.11 | 21.44 | 0.06 | 20.48 | 0.05 | 19.79 | 0.10 | 0.54 | 0.05 |
| ATHDFS_J223343.5-603211 | YES | 33790 | 21.89 | 0.08 | 22.16 | 0.05 | 21.10 | 0.03 | 20.01 | 0.02 | 19.29 | 0.05 | 0.60 | 0.04 |
| ATHDFS_J223302.1-603213 | NO | |||||||||||||
| ATHDFS_J223519.4-603157A | YES | 33973 | 21.71 | 0.09 | 21.84 | 0.04 | 20.70 | 0.03 | 19.87 | 0.02 | 19.21 | 0.04 | 0.51 | 0.06 |
| ATHDFS_J223519.4-603157B | YES | 34076 | 21.71 | 0.10 | 21.93 | 0.04 | 20.96 | 0.03 | 20.23 | 0.03 | 19.64 | 0.06 | 0.51 | 0.08 |
| ATHDFS_J223351.1-603153 | YES | 33888 | 21.56 | 0.06 | 22.00 | 0.04 | 21.26 | 0.04 | 20.36 | 0.03 | 19.72 | 0.05 | 0.57 | 0.05 |
| ATHDFS_J223113.5-603147 | YES | 33669 | 24.50 | 0.60 | 25.27 | 0.41 | 25.47 | 0.95 | 24.56 | 0.60 | 23.02 | 0.61 | 0.00 | 0.00 |
| ATHDFS_J223433.9-603150 | YES | 33726 | 24.00 | 0.37 | 25.14 | 0.32 | 25.19 | 0.59 | 24.27 | 0.39 | 23.04 | 0.45 | 0.00 | 0.00 |
| ATHDFS_J223449.7-603137 | YES | 34051 | 23.05 | 0.17 | 23.99 | 0.14 | 22.85 | 0.07 | 21.61 | 0.04 | 20.24 | 0.04 | 0.67 | 0.36 |
| ATHDFS_J223303.1-603132 | NO | |||||||||||||
| ATHDFS_J223254.4-603131 | NO | |||||||||||||
| ATHDFS_J223316.0-603127 | YES | 34392 | 23.14 | 0.26 | 23.32 | 0.11 | 22.10 | 0.06 | 21.03 | 0.04 | 20.24 | 0.09 | 0.60 | 0.08 |
| ATHDFS_J223548.9-603113 | YES | 34854 | 22.11 | 0.22 | 22.47 | 0.11 | 21.06 | 0.06 | 19.73 | 0.03 | 18.71 | 0.06 | 0.51 | 0.05 |
| ATHDFS_J223201.4-603118 | YES | 34558 | 21.58 | 0.07 | 21.40 | 0.03 | 20.06 | 0.02 | 19.01 | 0.01 | 17.73 | 0.01 | 0.60 | 0.14 |
| ATHDFS_J223351.7-603117 | YES | 34765 | 22.83 | 0.19 | 23.01 | 0.09 | 22.33 | 0.11 | 21.47 | 0.07 | 20.61 | 0.13 | 0.67 | 0.12 |
| ATHDFS_J223504.6-603109 | YES | 35154 | 18.73 | 0.01 | 18.62 | 0.00 | 17.87 | 0.00 | 17.35 | 0.00 | 16.82 | 0.01 | 0.08 | 0.04 |
| ATHDFS_J223415.5-603108 | YES | 34566 | 24.14 | 0.47 | 24.17 | 0.16 | 24.30 | 0.35 | 24.22 | 0.44 | 23.29 | 0.83 | 1.20 | 0.60 |
| ATHDFS_J223256.4-603058 | NO | |||||||||||||
| ATHDFS_J223550.9-603050 | NO | |||||||||||||
| ATHDFS_J223447.4-603050 | YES | 35065 | 22.93 | 0.20 | 23.42 | 0.11 | 23.14 | 0.16 | 22.34 | 0.11 | 21.46 | 0.20 | 0.89 | 0.11 |
| ATHDFS_J223146.0-603046 | NO | |||||||||||||
| ATHDFS_J223345.0-603041 | NO | |||||||||||||
| ATHDFS_J223404.0-603037A | YES | 35214 | 24.73 | 1.30 | 24.16 | 0.27 | 24.21 | 0.59 | 23.25 | 0.35 | 22.18 | 0.61 | 1.29 | 0.30 |
| ATHDFS_J223404.0-603037B | YES | 35546 | 23.47 | 0.24 | 22.66 | 0.24 | 21.76 | 0.16 | 20.92 | 0.37 | 0.48 | 0.33 | ||
| ATHDFS_J223445.6-603032 | YES | 35422 | 22.19 | 0.13 | 22.59 | 0.07 | 22.07 | 0.08 | 21.47 | 0.07 | 20.51 | 0.12 | 1.34 | 0.02 |
| ATHDFS_J223304.8-603031 | YES | 35585 | 21.12 | 0.05 | 21.44 | 0.03 | 20.58 | 0.02 | 19.84 | 0.02 | 19.20 | 0.04 | 0.54 | 0.07 |
| ATHDFS_J223120.1-603025 | YES | 35603 | 20.72 | 0.05 | 21.15 | 0.03 | 20.11 | 0.02 | 19.27 | 0.01 | 18.61 | 0.04 | 0.51 | 0.11 |
| ATHDFS_J223537.7-603013 | NO | |||||||||||||
| ATHDFS_J223241.4-603025 | YES | 35743 | 20.61 | 0.03 | 21.01 | 0.02 | 20.06 | 0.01 | 19.29 | 0.01 | 18.64 | 0.03 | 0.54 | 0.09 |
| ATHDFS_J223414.6-603024 | NO | |||||||||||||
| ATHDFS_J223440.4-603017 | YES | 36010 | 21.81 | 0.10 | 21.63 | 0.03 | 20.17 | 0.02 | 19.34 | 0.01 | 18.60 | 0.02 | 0.27 | 0.05 |
| ATHDFS_J223216.6-603016 | YES | 36058 | 21.71 | 0.07 | 21.54 | 0.03 | 20.53 | 0.02 | 19.74 | 0.02 | 19.07 | 0.04 | 0.48 | 0.15 |
| ATHDFS_J223453.7-603008 | YES | 36027 | 23.71 | 0.63 | 23.82 | 0.26 | 22.68 | 0.18 | 21.42 | 0.09 | 20.42 | 0.15 | 0.45 | 0.08 |
| ATHDFS_J223303.9-603013 | NO | |||||||||||||
| ATHDFS_J223203.6-603007 | NO | |||||||||||||
| ATHDFS_J223331.1-603007 | NO | |||||||||||||
| ATHDFS_J223430.1-602959 | YES | 36102 | 22.86 | 0.35 | 23.21 | 0.17 | 22.54 | 0.19 | 22.04 | 0.19 | 21.59 | 0.59 | 0.01 | 0.04 |
| ATHDFS_J223236.5-603000 | NO | |||||||||||||
| ATHDFS_J223224.7-603005 | YES | 35779 | 24.83 | 0.35 | 25.13 | 0.18 | 24.98 | 0.30 | 24.33 | 0.24 | 24.04 | 0.64 | 1.44 | 0.44 |
| ATHDFS_J223516.8-602959 | NO | |||||||||||||
| ATHDFS_J223355.5-602956 | NO | |||||||||||||
| ATHDFS_J223058.4-602952 | YES | 36196 | 22.14 | 0.16 | 22.88 | 0.12 | 22.01 | 0.11 | 20.89 | 0.06 | 19.77 | 0.10 | 0.82 | 0.10 |
| ATHDFS_J223544.3-602950 | NO | |||||||||||||
| ATHDFS_J223530.9-602951 | YES | 36090 | 24.72 | 0.81 | 24.43 | 0.20 | 23.99 | 0.26 | 23.85 | 0.31 | 22.75 | 0.49 | 1.20 | 0.57 |
| ATHDFS_J223534.2-602948 | YES | 36657 | 21.27 | 0.06 | 21.12 | 0.02 | 20.14 | 0.02 | 19.55 | 0.01 | 18.87 | 0.03 | 0.23 | 0.19 |
| ATHDFS_J223108.1-602946 | YES | 69671 | 23.02 | 0.30 | 23.11 | 0.12 | 21.71 | 0.07 | 20.57 | 0.04 | 19.57 | 0.07 | 0.00 | 0.00 |
| ATHDFS_J223410.0-602949 | NO | |||||||||||||
| ATHDFS_J223253.7-602946 | NO | |||||||||||||
| ATHDFS_J223316.8-602934 | YES | 36602 | 23.15 | 0.45 | 23.48 | 0.24 | 22.53 | 0.20 | 22.66 | 0.37 | 21.05 | 0.41 | 0.89 | 1.71 |
| ATHDFS_J223329.1-602933 | YES | 69747 | 24.19 | 0.76 | 24.49 | 0.42 | 29.62 | 23.91 | 0.78 | 25.77 | 18.10 | 0.00 | 0.00 | |
| ATHDFS_J223513.7-602930 | YES | 36658 | 25.44 | 1.73 | 24.45 | 0.22 | 23.98 | 0.30 | 23.19 | 0.20 | 22.43 | 0.39 | 1.44 | 1.10 |
| ATHDFS_J223140.6-602924 | NO | |||||||||||||
| ATHDFS_J223454.1-602926 | YES | 37519 | 22.04 | 0.27 | 22.22 | 0.13 | 20.83 | 0.07 | 19.46 | 0.03 | 18.29 | 0.05 | 0.57 | 0.05 |
| ATHDFS_J223303.0-602927A | NO | |||||||||||||
| ATHDFS_J223303.0-602927B | NO | |||||||||||||
| ATHDFS_J223415.3-602925 | YES | 37444 | 18.54 | 0.01 | 18.55 | 0.00 | 17.54 | 0.00 | 16.97 | 0.00 | 16.35 | 0.01 | 0.21 | 0.12 |
| ATHDFS_J223149.1-602924 | YES | 36667 | 23.78 | 0.41 | 24.34 | 0.23 | 24.43 | 0.49 | 23.82 | 0.39 | 22.92 | 0.75 | 1.24 | 0.19 |
| ATHDFS_J223157.5-602919 | YES | 37122 | 23.89 | 0.81 | 23.88 | 0.33 | 22.74 | 0.23 | 22.01 | 0.19 | 21.02 | 0.36 | 0.67 | 0.24 |
| ATHDFS_J223447.1-602915 | YES | 37087 | 25.89 | 3.81 | 23.85 | 0.21 | 23.02 | 0.18 | 21.85 | 0.09 | 20.92 | 0.16 | 0.42 | 0.12 |
| ATHDFS_J223407.4-602913 | YES | 37021 | 24.40 | 0.90 | 24.15 | 0.24 | 24.33 | 0.57 | 23.88 | 0.53 | 24.49 | 4.19 | 0.00 | 0.00 |
| ATHDFS_J223317.7-602916 | YES | 37003 | 23.73 | 0.25 | 23.74 | 0.09 | 23.46 | 0.13 | 23.23 | 0.15 | 22.64 | 0.38 | 1.54 | 0.25 |
| ATHDFS_J223117.4-602850 | NO | |||||||||||||
| ATHDFS_J223515.2-602856 | YES | 37927 | 21.59 | 0.10 | 21.68 | 0.04 | 20.66 | 0.03 | 19.68 | 0.02 | 18.94 | 0.04 | 0.60 | 0.03 |
| ATHDFS_J223420.1-602901 | YES | 37309 | 25.21 | 1.04 | 25.68 | 0.51 | 24.81 | 0.45 | 23.76 | 0.23 | 22.49 | 0.30 | 0.00 | 0.00 |
| ATHDFS_J223445.3-602855 | YES | 37492 | 24.49 | 0.82 | 23.68 | 0.14 | 23.73 | 0.27 | 23.06 | 0.21 | 22.91 | 0.75 | 1.54 | 0.86 |
| ATHDFS_J223431.7-602859 | YES | 37577 | 21.78 | 0.10 | 22.05 | 0.04 | 21.07 | 0.03 | 20.34 | 0.02 | 19.74 | 0.06 | 0.51 | 0.08 |
| ATHDFS_J223212.1-602858 | YES | 37782 | 21.81 | 0.07 | 22.03 | 0.04 | 21.08 | 0.03 | 20.16 | 0.02 | 19.43 | 0.05 | 0.57 | 0.08 |
| ATHDFS_J223505.0-602853 | YES | 37540 | 25.95 | 0.87 | 24.40 | 0.41 | 22.70 | 0.12 | 21.97 | 0.25 | 0.48 | 0.13 | ||
| ATHDFS_J223236.2-602855 | YES | 37478 | 23.62 | 0.31 | 24.27 | 0.22 | 23.71 | 0.29 | 23.09 | 0.24 | 24.17 | 2.39 | 0.34 | 0.27 |
| ATHDFS_J223108.3-602851 | NO | |||||||||||||
| ATHDFS_J223307.7-602853 | YES | 37500 | 25.21 | 1.62 | 24.11 | 0.21 | 25.48 | 1.52 | 22.72 | 0.17 | 24.35 | 3.40 | 1.44 | 2.50 |
| ATHDFS_J223127.7-602849 | NO | |||||||||||||
| ATHDFS_J223326.9-602850 | YES | 37843 | 20.62 | 0.02 | 20.44 | 0.01 | 19.98 | 0.01 | 19.62 | 0.01 | 19.16 | 0.03 | 0.02 | 0.04 |
| ATHDFS_J223330.5-602849 | YES | 37778 | 20.78 | 0.03 | 21.40 | 0.02 | 20.78 | 0.02 | 20.41 | 0.02 | 20.18 | 0.06 | 0.21 | 0.06 |
| ATHDFS_J223103.5-602830 | NO | |||||||||||||
| ATHDFS_J223138.5-602834 | YES | 37839 | 23.42 | 0.31 | 24.02 | 0.19 | 24.22 | 0.47 | 23.18 | 0.25 | 22.29 | 0.50 | 0.00 | 0.00 |
| ATHDFS_J223307.0-602827 | YES | 38077 | 24.31 | 1.06 | 24.52 | 0.49 | 22.73 | 0.19 | 23.14 | 0.42 | 0.00 | 0.00 | ||
| ATHDFS_J223436.2-602821 | YES | 70137 | 22.55 | 0.35 | 23.03 | 0.20 | 22.75 | 0.30 | 21.83 | 0.21 | 20.73 | 0.37 | 0.00 | 0.00 |
| ATHDFS_J223329.4-602811 | YES | 70238 | 20.74 | 0.03 | 21.30 | 0.02 | 21.09 | 0.04 | 20.50 | 0.03 | 19.87 | 0.07 | 0.00 | 0.00 |
| ATHDFS_J223255.9-602810 | NO | |||||||||||||
| ATHDFS_J223413.3-602808 | YES | 38524 | 23.78 | 0.29 | 26.62 | 1.27 | 24.34 | 0.30 | 23.62 | 0.21 | 22.91 | 0.46 | 0.00 | 0.00 |
| ATHDFS_J223427.0-602802 | NO | |||||||||||||
| ATHDFS_J223219.7-602802 | NO | |||||||||||||
| ATHDFS_J223114.1-602800 | YES | 38561 | 18.50 | 0.01 | 31.92 | 22.80 | 0.16 | 21.69 | 0.25 | 0.00 | 0.00 | |||
| ATHDFS_J223133.4-602755 | YES | 39033 | 22.10 | 0.12 | 22.33 | 0.05 | 21.25 | 0.04 | 20.30 | 0.03 | 19.54 | 0.06 | 0.60 | 0.03 |
| ATHDFS_J223240.7-602755 | YES | 38800 | 23.17 | 0.29 | 23.54 | 0.15 | 23.35 | 0.27 | 23.34 | 0.42 | 22.18 | 0.61 | 0.00 | 0.00 |
| ATHDFS_J223438.4-602747 | NO | |||||||||||||
| ATHDFS_J223454.2-602742 | NO | |||||||||||||
| ATHDFS_J223443.9-602739A | YES | 39667 | 22.44 | 0.22 | 22.27 | 0.07 | 20.77 | 0.04 | 19.61 | 0.02 | 18.84 | 0.04 | 0.37 | 0.01 |
| ATHDFS_J223443.9-602739B | YES | 39667 | 22.44 | 0.22 | 22.27 | 0.07 | 20.77 | 0.04 | 19.61 | 0.02 | 18.84 | 0.04 | 0.37 | 0.01 |
| ATHDFS_J223443.9-602739C | YES | 39667 | 22.44 | 0.22 | 22.27 | 0.07 | 20.77 | 0.04 | 19.61 | 0.02 | 18.84 | 0.04 | 0.37 | 0.01 |
| ATHDFS_J223136.1-602731 | YES | 39429 | 21.64 | 0.08 | 21.87 | 0.04 | 20.90 | 0.03 | 20.08 | 0.02 | 19.42 | 0.05 | 0.48 | 0.15 |
| ATHDFS_J223311.5-602725 | NO | |||||||||||||
| ATHDFS_J223142.7-602719 | YES | 39784 | 22.08 | 0.13 | 22.14 | 0.05 | 21.10 | 0.04 | 20.12 | 0.02 | 19.36 | 0.06 | 0.60 | 0.04 |
| ATHDFS_J223153.1-602723 | NO | |||||||||||||
| ATHDFS_J223148.6-602722 | NO | |||||||||||||
| ATHDFS_J223332.7-602723 | YES | 39695 | 21.76 | 0.08 | 22.18 | 0.04 | 21.60 | 0.05 | 20.84 | 0.04 | 20.19 | 0.09 | 0.64 | 0.18 |
| ATHDFS_J223241.5-602719 | NO | |||||||||||||
| ATHDFS_J223227.6-602719A | YES | 39818 | 22.13 | 0.15 | 22.95 | 0.17 | 22.50 | 0.19 | 22.05 | 0.26 | 20.85 | 0.33 | 0.98 | 0.14 |
| ATHDFS_J223227.6-602719B | NO | |||||||||||||
| ATHDFS_J223418.3-602715 | NO | |||||||||||||
| ATHDFS_J223244.5-602719 | NO | |||||||||||||
| ATHDFS_J223317.1-602714 | NO | |||||||||||||
| ATHDFS_J223312.3-602707 | S | 78952 | 22.98 | 0.27 | 23.94 | 0.24 | 22.51 | 0.13 | 20.77 | 0.04 | 18.01 | 0.01 | 0.00 | 0.00 |
| ATHDFS_J223415.2-602701 | NO | |||||||||||||
| ATHDFS_J223257.4-602657 | YES | 40051 | 23.85 | 0.53 | 23.91 | 0.20 | 23.76 | 0.36 | 23.25 | 0.33 | 21.82 | 0.39 | 0.00 | 0.00 |
| ATHDFS_J223329.0-602657 | YES | 40061 | 24.10 | 0.69 | 23.79 | 0.22 | 25.17 | 1.60 | 23.52 | 0.53 | 20.38 | 0.12 | 0.00 | 0.00 |
| ATHDFS_J223432.3-602652 | YES | 40138 | 26.26 | 1.95 | 26.03 | 0.49 | 25.59 | 0.61 | 24.42 | 0.27 | 23.51 | 0.47 | 0.00 | 0.00 |
| ATHDFS_J223259.9-602654 | NO | |||||||||||||
| ATHDFS_J223506.2-602647 | YES | 40414 | 23.87 | 0.46 | 24.07 | 0.19 | 23.14 | 0.17 | 22.35 | 0.12 | 21.49 | 0.21 | 0.64 | 0.17 |
| ATHDFS_J223359.1-602642 | NO | |||||||||||||
| ATHDFS_J223342.2-602639 | YES | 40697 | 22.76 | 0.15 | 23.77 | 0.18 | 23.29 | 0.23 | 22.50 | 0.17 | 22.30 | 0.62 | 0.51 | 0.12 |
| ATHDFS_J223221.4-602629 | YES | 40967 | 22.31 | 0.11 | 22.60 | 0.07 | 22.05 | 0.07 | 21.36 | 0.07 | 20.29 | 0.11 | 1.20 | 0.04 |
| ATHDFS_J223400.9-602633 | YES | 41325 | 22.25 | 0.20 | 21.54 | 0.04 | 20.20 | 0.03 | 19.01 | 0.01 | 18.18 | 0.03 | 0.37 | 0.04 |
| ATHDFS_J223212.4-602632 | YES | 40679 | 25.09 | 0.77 | 25.16 | 0.36 | 24.16 | 0.25 | 23.06 | 0.15 | 21.88 | 0.20 | 0.78 | 0.16 |
| ATHDFS_J223136.2-602627 | YES | 41222 | 21.33 | 0.07 | 21.77 | 0.06 | 20.82 | 0.05 | 19.85 | 0.03 | 19.12 | 0.08 | 0.60 | 0.06 |
| ATHDFS_J223432.6-602614 | YES | 41174 | 23.48 | 0.29 | 23.75 | 0.13 | 23.56 | 0.22 | 23.03 | 0.18 | 22.13 | 0.35 | 1.15 | 0.10 |
| ATHDFS_J223335.3-602615 | YES | 42237 | 20.62 | 0.04 | 20.39 | 0.02 | 19.20 | 0.01 | 18.48 | 0.01 | 17.76 | 0.02 | 0.08 | 0.13 |
| ATHDFS_J223136.9-602610 | YES | 41580 | 21.40 | 0.06 | 21.66 | 0.03 | 20.68 | 0.03 | 19.66 | 0.02 | 18.95 | 0.04 | 0.60 | 0.04 |
| ATHDFS_J223322.5-602607 | NO | |||||||||||||
| ATHDFS_J223442.5-602601 | YES | 41560 | 23.35 | 0.36 | 24.12 | 0.34 | 23.30 | 0.31 | 22.62 | 0.27 | 22.28 | 0.85 | 0.40 | 0.20 |
| ATHDFS_J223307.2-602556 | NO | |||||||||||||
| ATHDFS_J223148.3-602554 | YES | 41688 | 21.98 | 0.08 | 22.31 | 0.05 | 21.50 | 0.05 | 20.69 | 0.03 | 20.02 | 0.07 | 0.57 | 0.06 |
| ATHDFS_J223357.8-602548 | YES | 41825 | 22.41 | 0.09 | 22.55 | 0.04 | 22.03 | 0.04 | 21.54 | 0.04 | 21.07 | 0.10 | 0.01 | 0.05 |
| ATHDFS_J223308.8-602540 | NO | |||||||||||||
| ATHDFS_J223202.6-602534 | NO | |||||||||||||
| ATHDFS_J223222.4-602532 | S | 79167 | 22.65 | 0.24 | 17.67 | 0.00 | 14.47 | 0.00 | 14.23 | 0.00 | 13.55 | 0.00 | 0.00 | 0.00 |
| ATHDFS_J223432.2-602530 | NO | |||||||||||||
| ATHDFS_J223445.7-602523 | NO | |||||||||||||
| ATHDFS_J223351.2-602519 | YES | 42652 | 22.55 | 0.11 | 22.67 | 0.06 | 21.79 | 0.04 | 20.86 | 0.03 | 20.09 | 0.06 | 0.60 | 0.09 |
| ATHDFS_J223141.1-602506 | YES | 43090 | 20.00 | 0.02 | 20.27 | 0.01 | 19.25 | 0.01 | 18.71 | 0.01 | 18.09 | 0.02 | 0.19 | 0.09 |
| ATHDFS_J223228.9-602507 | NO | |||||||||||||
| ATHDFS_J223134.5-602457 | YES | 43114 | 22.96 | 0.23 | 23.06 | 0.13 | 21.94 | 0.08 | 20.74 | 0.05 | 19.93 | 0.10 | 0.37 | 0.07 |
| ATHDFS_J223306.6-602425 | NO | |||||||||||||
| ATHDFS_J223317.1-602427 | YES | 43898 | 23.77 | 0.53 | 24.70 | 0.69 | 22.07 | 0.10 | 21.80 | 0.17 | 0.00 | 0.00 | ||
| ATHDFS_J223444.9-602417 | YES | 43772 | 25.76 | 2.39 | 25.27 | 0.62 | 24.58 | 0.54 | 24.44 | 0.83 | 23.58 | 1.40 | 0.00 | 0.00 |
| ATHDFS_J223436.8-602426 | YES | 43650 | 23.10 | 0.19 | 23.09 | 0.07 | 22.42 | 0.06 | 21.68 | 0.05 | 21.03 | 0.11 | 0.54 | 0.14 |
| ATHDFS_J223245.3-602407 | YES | 43995 | 26.83 | 1.07 | 25.83 | 0.81 | 24.71 | 0.44 | 24.17 | 0.96 | 0.00 | 0.00 | ||
| ATHDFS_J223343.4-602348 | YES | 44829 | 22.03 | 0.08 | 22.44 | 0.05 | 21.98 | 0.06 | 21.57 | 0.07 | 21.09 | 0.16 | 0.14 | 0.14 |
| ATHDFS_J223410.2-602324 | NO | |||||||||||||
| ATHDFS_J223146.3-602313 | NO | |||||||||||||
| ATHDFS_J223331.6-602307 | YES | 45826 | 23.60 | 0.34 | 23.66 | 0.17 | 22.32 | 0.08 | 21.04 | 0.05 | 19.79 | 0.06 | 0.00 | 0.00 |
| ATHDFS_J223343.7-602307 | NO | |||||||||||||
| ATHDFS_J223358.9-602258 | YES | 46088 | 20.74 | 0.02 | 20.97 | 0.01 | 20.78 | 0.01 | 20.75 | 0.02 | 20.54 | 0.06 | 0.04 | 0.05 |
| ATHDFS_J223300.5-602225 | YES | 46891 | 23.75 | 0.34 | 24.09 | 0.22 | 23.39 | 0.23 | 22.59 | 0.17 | 22.08 | 0.41 | 0.51 | 0.09 |
| ATHDFS_J223154.6-602211 | YES | 47347 | 22.45 | 0.13 | 23.35 | 0.14 | 22.46 | 0.10 | 21.49 | 0.08 | 20.41 | 0.12 | 0.82 | 0.08 |
| ATHDFS_J223353.6-602136 | YES | 48095 | 24.63 | 0.92 | 26.30 | 1.66 | 25.41 | 1.40 | 24.17 | 0.71 | 22.80 | 0.74 | 0.00 | 0.00 |
| ATHDFS_J223341.1-602054 | YES | 49047 | 24.54 | 0.55 | 25.07 | 0.33 | 24.65 | 0.47 | 23.69 | 0.27 | 22.53 | 0.31 | 1.02 | 0.09 |
| ATHDFS_J223359.4-602047 | NO | |||||||||||||
| ATHDFS_J223431.4-602041 | YES | 49407 | 24.28 | 1.28 | 23.22 | 0.17 | 22.21 | 0.14 | 21.07 | 0.08 | 20.02 | 0.14 | 0.00 | 0.00 |
| ATHDFS_J223356.6-601949 | YES | 50950 | 21.41 | 0.09 | 21.21 | 0.03 | 19.75 | 0.02 | 18.86 | 0.01 | 18.13 | 0.02 | 0.27 | 0.04 |
| ATHDFS_J223316.0-601939 | YES | 50965 | 24.45 | 1.35 | 23.39 | 0.20 | 22.16 | 0.13 | 20.71 | 0.06 | 19.79 | 0.10 | 0.45 | 0.05 |
| ATHDFS_J223334.5-601928 | NO |
| ATHDFS name | F300 | F300 | F450 | F450 | F606 | F606 | F814 | F814 | morphological |
|---|---|---|---|---|---|---|---|---|---|
| magnitude | rms error | magnitude | rms error | magnitude | rms error | magnitude | rms error | information | |
| ATHDFS_J223258.6-603346 | 27.53 | 0.68 | 28.48 | 0.77 | 27.05 | 0.13 | 25.12 | 0.04 | no info |
| ATHDFS_J223247.6-603337 | 22.70 | 0.02 | 21.69 | 0.00 | 20.55 | 0.00 | 19.55 | 0.00 | late type spiral |
| ATHDFS_J223253.1-603329 | 25.00 | 0.07 | 24.31 | 0.02 | 23.69 | 0.01 | 22.56 | 0.00 | no info |
| ATHDFS_J223302.8-603323 | 25.45 | 0.19 | 23.60 | 0.02 | 23.36 | 0.01 | 22.79 | 0.01 | barred spiral |
| ATHDFS name | F110 | F110 | F160 | F160 | F222 | F222 | morphological |
|---|---|---|---|---|---|---|---|
| magnitude | rms error | magnitude | rms error | magnitude | rms error | information | |
| ATHDFS_J223253.7-603921 | 21.20 | 0.05 | 19.97 | 0.02 | 19.38 | 0.07 | no info |
| ATHDFS name | 50ccd | 50ccd | lp | lp | nuv | nuv | fuv | fuv | morphological |
|---|---|---|---|---|---|---|---|---|---|
| magnitude | rms error | magnitude | rms error | magnitude | rms error | magnitude | rms error | information | |
| ATHDFS_J223337.5-603329 | 17.83 | 0.0 | 17.48 | 0.00 | - | - | 29.13 | 0.00 | bright point source |
| (STIS QSO) | |||||||||
| ATHDFS_J223339.4-603306 | 24.76 | 0.01 | 24.46 | 0.04 | 41.00 | 0.00 | 37.33 | 0.00 | irregular and disturbed, |
| possible merging system |
| WFPC2 Flanking Observations | ||||||
|---|---|---|---|---|---|---|
| ATHDFS name | flanking field | F606 | F606 | F814 | F814 | morphological |
| ID | magnitude | rms error | magnitude | rms error | information | |
| ATHDFS_J223207.9-603928 | WdpVI | 26.46 | 0.21 | 25.61 | 0.15 | no info |
| ATHDFS_J223253.7-603921 | W9 | - | - | 21.12 | 0.01 | possible merging system |
| ATHDFS_J223245.6-603857 | W9 | - | - | 23.91 | 0.04 | no info |
| ATHDFS_J223248.2-603805 | W9 | - | - | 20.90 | 0.01 | edge-on disk galaxy |
| ATHDFS_J223254.5-603748 | W9 | - | - | 18.44 | 0.00 | barred spiral |
| ATHDFS_J223202.5-603714 | WdpVI | 25.86 | 0.11 | 24.17 | 0.04 | possible merging system |
| ATHDFS_J223253.0-603539 | W6 | - | - | 23.45 | 0.04 | no info |
| ATHDFS_J223245.3-603537 | W6 | - | - | 24.04 | 0.06 | no info |
| ATHDFS_J223338.8-603523 | W8 | - | - | 18.99 | 0.00 | early type spiral |
| ATHDFS_J223344.9-603515 | W8 | - | - | 19.51 | 0.00 | spiral galaxy in merging system |
| ATHDFS_J223350.5-603503 | W8 | - | - | 26.24 | 0.19 | no info |
| ATHDFS_J223307.1-603448 | W3 | - | - | 24.83 | 0.08 | no info |
| ATHDFS_J223243.3-603443 | W2 | - | - | 19.32 | 0.00 | merging system |
| ATHDFS_J223245.5-603419 | W2 | - | - | 21.10 | 0.01 | possible merger |
| ATHDFS_J223311.9-603417 | W3 | - | - | 23.93 | 0.05 | no info |
| ATHDFS_J223306.0-603350 | W3 | - | - | 17.25 | 0.00 | face-on spiral |
| ATHDFS_J223243.4-603352 | W2 | - | - | 19.87 | 0.00 | point-like, quasar |
| ATHDFS_J223247.6-603337 | W2 | - | - | 19.64 | 0.01 | spiral |
| ATHDFS_J223337.5-603329 | W8 | - | - | 17.70 | 0.00 | bright point source (STIS QSO) |
| ATHDFS_J223339.4-603306 | W8 | - | - | 24.81 | 0.10 | no info |
| ATHDFS_J223308.6-603251 | W1 | - | - | 21.03 | 0.01 | spheroidal |
| ATHDFS_J223317.7-603235 | W4 | - | - | 20.83 | 0.01 | spheroidal |
| ATHDFS_J223331.6-603222 | W7 | - | - | 20.38 | 0.01 | merging system, triple nuclei |
| ATHDFS_J223303.1-603132 | W1 | - | - | 24.05 | 0.05 | no info |
| NICMOS Flanking Observations | ||||||
| ATHDFS name | flanking field | F111 | F111 | F160 | F160 | morphological |
| ID | magnitude | rms error | magnitude | rms error | information | |
| ATHDFS_J223250.6-604336 | N9 | - | - | 22.06 | 0.02 | possible merging system |
| ATHDFS_J223337.5-604006 | N8 | - | - | 19.66 | 0.00 | merging system |
| ATHDFS_J223334.4-603804 | N7 | - | - | 22.30 | 0.09 | no info (at edge of image) |
| ATHDFS_J223210.3-604433 | dpJH | 20.45 | 0.03 | 19.83 | 0.01 | no info (at edge of image) |
| STIS Flanking Observations | ||||||
| ATHDFS name | flanking field | 50ccd | 50ccd | morphological | ||
| ID | magnitude | rms error | information | |||
| ATHDFS_J223425.0-603452 | S8 | 23.18 | 0.01 | disturbed, merging system | ||
| ATHDFS_J223327.6-603414 | S2 | 28.17 | 0.18 | no info | ||
| ATHDFS name | CTIO I | HST F812W | |
|---|---|---|---|
| magnitude | magnitude | (mJy) | |
| ATHDFS_J223207.9-603928 | - | 25.61 | 0.098 |
| ATHDFS_J223253.8-603921 | 20.68 | 21.12 | 0.052 |
| ATHDFS_J223245.6-603857 | 23.39 | 23.91 | 0.843 |
| ATHDFS_J223248.2-603805 | 20.49 | 20.90 | 0.076 |
| ATHDFS_J223254.5-603748 | 17.91 | 18.44 | 0.092 |
| ATHDFS_J223202.5-603714 | 23.60 | 24.17 | 0.148 |
| ATHDFS_J223253.0-603539 | 23.19 | 23.45 | 0.090 |
| ATHDFS_J223245.3-603537 | 23.77 | 24.04 | 0.051 |
| ATHDFS_J223338.8-603523 | 18.61 | 18.99 | 0.185 |
| ATHDFS_J223344.9-603515 | 18.69 | 19.51 | 0.344 |
| ATHDFS_J223350.5-603503 | 23.08 | 26.24 | 1.252 |
| ATHDFS_J223307.1-603448 | - | 24.83 | 0.103 |
| ATHDFS_J223243.3-603443 | 18.87 | 19.32 | 0.063 |
| ATHDFS_J223245.5-603419 | 20.33 | 21.10 | 0.265 |
| ATHDFS_J223311.9-603417 | 23.09 | 23.93 | 0.059 |
| ATHDFS_J223306.0-603350 | 16.58 | 17.25 | 0.452 |
| ATHDFS_J223258.6-603346 | - | 25.12 | 1.010 |
| ATHDFS_J223243.4-603352 | 19.45 | 19.87 | 0.098 |
| ATHDFS_J223247.6-603337 | 19.16 | 19.55 | 0.075 |
| ATHDFS_J223337.5-603329 | 16.51 | 17.70 | 1.126 |
| ATHDFS_J223253.1-603329 | 22.29 | 22.56 | 0.113 |
| ATHDFS_J223303-603324 | 22.31 | 22.79 | 0.051 |
| ATHDFS_J223339.4-603306 | - | 24.81 | 0.058 |
| ATHDFS_J223308.6-603251 | 20.45 | 21.03 | 0.821 |
| ATHDFS_J223317.7-603235 | 19.57 | 20.83 | 0.070 |
| ATHDFS_J223331.6-603222 | 19.90 | 20.38 | 0.395 |
| ATHDFS_J223303.1-603132 | - | 24.05 | 0.052 |
| ATHDFS name | (mJy) | Radio-to-optical Ratio |
|---|---|---|
| ATHDFS_J223258.7-603903 | 0.058 | 2.60 |
| ATHDFS_J223205.9-603857 | 0.254 | 3.24 |
| ATHDFS_J223327.6-603414 | 0.456 | 3.50 |
| ATHDFS_J223327.9-603304A | 0.221 | 3.18 |
| ATHDFS_J223327.9-603304B | 0.059 | 2.61 |
| ATHDFS_J223323.2-603249 | 0.457 | 3.50 |
| ATHDFS_J223335.3-603234 | 0.054 | 2.47 |
| ATHDFS_J223302.1-603213 | 0.063 | 2.64 |
| ATHDFS name | LDSS++ | redshift | spectral type | comments |
|---|---|---|---|---|
| number | ||||
| ATHDFS_J223241.4-603025 | 216 | 0.4250 | abs | OII, Balmer-, HK, H+ |
| ATHDFS_J223247.6-603337 | 196 | 0.5803 | abs | OII,HK,H-,G,H- |
| ATHDFS_J223306.0-603350 | 133 | 0.1733 | sf | H+,OIII+,Mgb,5268,H+,NII+,SII+ |
| ATHDFS_J223245.5-603419 | 204 | 0.4606 | sf | H+,OIII(4959+5007)+ |
| ATHDFS name | Sawicki & Mallén-Ornelas (2003) | redshift | comments |
|---|---|---|---|
| ID | |||
| ATHDFS_J223254.5-603748 | 90549 | 0.2668 | |
| ATHDFS_J223243.3-603443 | 20277 | 0.4233 | |
| ATHDFS_J223245.5-603419 | 20462 | 0.4608 | |
| ATHDFS_J223247.6-603337 | 672 | 0.5807 | |
| ATHDFS_J223302.8-603323 | 894 | 0.4642 |
| ATHDFS name | I mag | ||
|---|---|---|---|
| ATHDFS_J223353.9-605452 | 5.918 | 21.23 | 2.88 |
| ATHDFS_J223214.8-605430 | 18.601 | 21.58 | 3.52 |
| ATHDFS_J223448.4-605417 | 1.396 | 22.11 | 2.61 |
| ATHDFS_J223203.0-605242A | 87.888 | 21.59 | 4.20 |
| ATHDFS_J223107.4-604855 | 11.272 | 21.86 | 3.42 |
| ATHDFS_J223320.1-604457 | 0.344 | 24.90 | 3.12 |
| ATHDFS_J223210.3-604433 | 56.513 | 19.46 | 3.16 |
| ATHDFS_J223534.3-604328 | 0.657 | 23.66 | 2.90 |
| ATHDFS_J223355.6-604315 | 154.700 | 22.15 | 4.67 |
| ATHDFS_J223123.1-603903 | 23.988 | 22.87 | 4.15 |
| ATHDFS_J223245.6-603857 | 0.843 | 23.39 | 2.90 |
| ATHDFS_J223404.8-603732 | 3.238 | 21.60 | 2.77 |
| ATHDFS_J223343.7-603651 | 0.070 | 25.51 | 2.67 |
| ATHDFS_J223350.5-603503 | 1.252 | 23.08 | 2.95 |
| ATHDFS_J223420.9-603336 | 4.328 | 21.74 | 2.95 |
| ATHDFS_J223212.9-603234A | 2.816 | 22.02 | 2.88 |
| ATHDFS_J223212.9-603234B | 1.466 | 22.02 | 2.59 |
| ATHDFS_J223113.5-603147 | 0.831 | 23.02 | 2.75 |
| ATHDFS_J223329.1-602933 | 0.261 | 25.77 | 3.34 |
| ATHDFS_J223444.9-602417 | 9.581 | 23.58 | 4.03 |
| ATHDFS_J223245.3-602407 | 0.469 | 24.17 | 2.96 |
| ATHDFS_J223303.6-605751 | 0.508 | 23.5 | 2.53 |
| ATHDFS_J223410.5-605545A | 2.106 | 23.5 | 3.14 |
| ATHDFS_J223410.5-605545B | 2.443 | 23.5 | 3.21 |
| ATHDFS_J223308.5-605544 | 3.643 | 23.5 | 3.38 |
| ATHDFS_J223317.5-605416A | 7.754 | 23.5 | 3.71 |
| ATHDFS_J223317.5-605416B | 5.570 | 23.5 | 3.57 |
| ATHDFS_J223403.1-605101 | 12.043 | 23.5 | 3.90 |
| ATHDFS_J223454.0-604904 | 0.483 | 23.5 | 2.50 |
| ATHDFS_J223527.8-604639B | 1.423 | 23.5 | 2.97 |
| ATHDFS_J223319.1-604348 | 1.085 | 23.5 | 2.86 |
| ATHDFS_J223427.3-604258 | 0.571 | 23.5 | 2.58 |
| ATHDFS_J223417.8-604009 | 1.502 | 23.5 | 3.00 |
| ATHDFS_J223429.9-603629 | 0.671 | 23.5 | 2.65 |
| ATHDFS_J223224.0-603537 | 1.259 | 23.5 | 2.92 |
| ATHDFS_J223258.5-603346 | 1.010 | 23.5 | 2.82 |
| ATHDFS_J223509.5-603257 | 0.980 | 23.5 | 2.81 |
| ATHDFS_J223537.7-603013 | 2.860 | 23.5 | 3.28 |
| ATHDFS_J223236.5-603000 | 1.507 | 23.5 | 3.00 |
| ATHDFS_J223355.5-602956 | 1.534 | 23.5 | 3.01 |
| ATHDFS_J223140.6-602924 | 4.962 | 23.5 | 3.52 |
| ATHDFS_J223117.4-602850 | 7.756 | 23.5 | 3.71 |
| ATHDFS_J223306.6-602425 | 1.949 | 23.5 | 3.11 |
| ATHDFS_J223410.2-602324 | 0.582 | 23.5 | 2.58 |