The blue supergiant Sher 25 and its intriguing hourglass nebula
Abstract
The blue supergiant Sher 25 is surrounded by an asymmetric, hourglass-shaped circumstellar nebula. Its structure and dynamics have been studied previously through high-resolution imaging and spectroscopy, and it appears dynamically similar to the ring structure around SN 1987A. Here we present long-slit spectroscopy of the circumstellar nebula around Sher 25, and of the background nebula of the host cluster NGC 3603. We perform a detailed nebular abundance analysis to measure the gas-phase abundances of oxygen, nitrogen, sulphur, neon and argon. The oxygen abundance in the circumstellar nebula ( dex) is similar to that in the background nebula (), suggesting the composition of the host cluster is around solar. However, we confirm that the circumstellar nebula is very rich in nitrogen, with an abundance of , compared to the background value of . A new analysis of the stellar spectrum with the fastwind model atmosphere code suggests that the photospheric nitrogen and oxygen abundances in Sher 25 are consistent with the nebular results. While the nitrogen abundances are high, when compared to stellar evolutionary models they do not unambiguously confirm that the star has undergone convective dredge-up during a previous red supergiant phase. We suggest that the more likely scenario is that the nebula was ejected from the star while it was in the blue supergiant phase. The star’s initial mass was around 50M⊙, which is rather too high for it to have had a convective envelope stage as a red supergiant. Rotating stellar models that lead to mixing of core-processed material to the stellar surface during core H-burning can quantitatively match the stellar results with the nebula abundances.
keywords:
stars: evolution - stars: individual : Sher 25 - stars: supergiants - stars: abundances1 Introduction
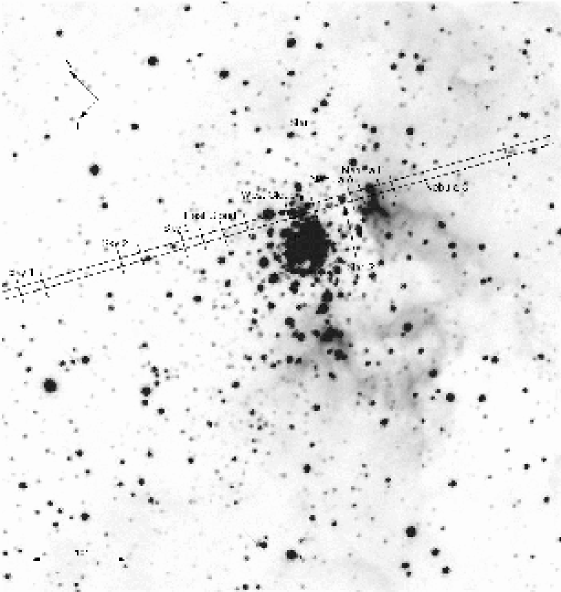
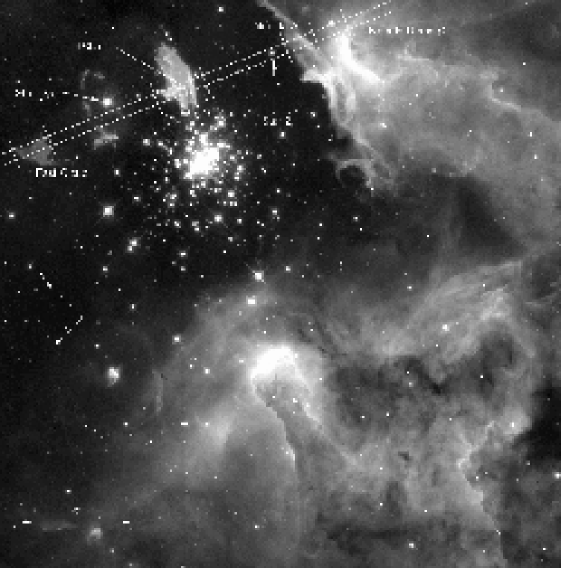
Sher 25 (Sher, 1965) is an evolved blue supergiant (BSG), with a -band magnitude of 12.28 and colour of 1.38 (van den Bergh, 1978). It has a spectral type of B1.5 Ia (Moffat, 1983), similar to Sk , the progenitor of SN 1987A, which was a B3 I supergiant when it exploded (Walborn et al., 1989; Panagia et al., 1987; Gilmozzi et al., 1987). Sher 25 is situated about 20′′ north of the trapezium-like system HD 97950, at the core of the young cluster in the centre of the giant H ii region NGC 3603. Figure 1 (lower panel) shows part of a HST WFPC2 image111Image credit: Wolfgang Brandner (JPL/IPAC), Eva K. Grebel (U. Wash.), You-Hua Chu (UIUC), NASA of this giant Galactic emission nebula with Sher 25 in the top left-hand corner, clearly showing its complicated emission-line nebula. Sher 25 was first reported by Sher (1965), who used photometric observations to ascertain the distance to NGC 3603 and its reddening. Brandner et al. (1997a) discovered the ring-shaped nebula and apparent bipolar outflows serendipitously during a high-resolution spectral study of emission-line knots in the giant H ii region. The authors likened the circumstellar nebula to that of SN 1987A, where the rings existed before the supernova explosion and hence appear to have been ejected by the progenitor star.
Brandner et al. (1997a), using high-resolution echelle spectra, showed that the ring and the outflow to the north-east had a high [N ii]/H ratio, compared to the background H ii region. In an [O iii]/H versus [N ii]/H diagram, the north-east outflow filament was clearly situated outside the location of H ii regions and supernova remnants. The authors interpreted this as an enhanced N abundance and concluded that the bipolar filaments consisted of stellar material that had been enriched by the CNO cycle. On this basis they further suggested that Sher 25 was an evolved BSG that had passed through the red supergiant (RSG) phase, possibly a twin of the progenitor of SN 1987A (Sk ). Note that enhanced N in a stellar photosphere or circumstellar nebulae does not necessarily imply post-RSG status (see, e.g., Lamers et al., 2001; Meynet & Maeder, 2000). The comparison with Sk is attractive, but one should note that the two central stars are rather different in luminosity and mass, Sher 25 (40-60M⊙) is more massive than Sk (15-20M⊙).
In a second paper, Brandner et al. (1997b) presented a study of the ring and bipolar outflows to investigate their physical structure and dynamics. Using long-slit spectroscopic mapping of Sher 25’s nebula, they uncovered an asymmetric hourglass shape, with the inner ring at the waist of the hourglass. Their new observations confirmed the inclination angle from Brandner et al. (1997a), but found different expansion velocities. Brandner et al. (1997a) found far larger velocities in the bipolar outflows than in the ring, indicating that they were ejected at different times. However, Brandner et al. (1997b) found more comparable velocities and derived dynamical ages of 6,560 and 6,700 years for the ring and bipolar lobes. Because of the comparable ages of the ring and the lobes, the authors concluded that both the ring and the bipolar lobes were formed from the same brief and violent mass ejection 6,630 years ago. Brandner et al. (1997a, b) also carried out a detailed comparison of Sher 25’s hourglass nebula with the ring structure around SN 1987A. Brandner et al. (1997a) suggested that the main differences could be attributed to the different metallicities of the regions and the main-sequence masses of the stars. They also suggested that the bipolar nebulae represented the first members of a new class of nebula around BSGs in the final stages of their evolution, somewhere between luminous blue variables (LBVs) and planetary nebulae. Smith (2007) has recently discovered another Galactic BSG (HD 168625) with a similar circumstellar ring structure. Smith suggests that this could have come from an LBV-type eruption rather than being formed through a RSG-BSG wind interaction, and by implication that perhaps the SN 1987A rings were formed in a similar manner. Subsequently, Smith et al. (2007) announced two further discoveries of ring nebulae in the Carina Nebula, one of which encircles an early B-type supergiant. They speculate that these nebulae may be much more common than we have previously assumed.
Fransson et al. (1989) suggested that Sk had passed through a RSG phase because of large over-abundances of nitrogen (compared to carbon and oxygen) in early UV spectra, although their uncertainties were large. The nebular spectroscopy from Brandner et al. (1997a, b) seems to suggest that Sher 25 has also undergone a RSG phase, and is currently at a similar evolutionary stage to that of Sk before it exploded. In this scenario, Sher 25 evolves from a main-sequence O-type star to a RSG, at which point it undergoes convective ‘dredge-up’ of CNO-processed material, thereby dramatically changing the surface abundances – a major mass-ejection event at this point could then explain the N-enriched nebula. Sher 25 would then evolve back across the H–R diagram to greater temperatures via a ‘blue loop’, ultimately returning to the red or continuing to evolve to hotter temperatures as a Wolf-Rayet star. An alternative scenario to account for the N-enrichment of Sher 25 is that the CNO-processed material was mixed from the core into the envelope via rotationally-induced mixing, while the star was on (or near) the main sequence. Given the observed range of rotational velocities, the CNO abundances seen in Galactic B-type supergiants (McErlean et al., 1999; Crowther et al., 2006a) are consistent with the predictions of rotationally-induced mixing; the results for Sher 25 were suggested to be similar to this population by Crowther et al. (2006b). We also note that the massive-star population in NGC 3603 appears to be predominantly coeval (with an age of 1-2 Myr), but that Sher 25, and one O-type supergiant, are likely to be slightly older (4 Myrs; Melena et al., 2008).
Smartt et al. (2002, hereafter Paper I) presented high-resolution optical spectroscopy of Sher 25 alongside a model photosphere and unified stellar wind analysis. They determined atmospheric parameters, the mass-loss rate and photospheric abundances for C, N, O, Mg and Si and compared them with other Galactic B-type stars. They found that Sher 25 was not extreme or abnormal in terms of its photospheric N abundance. They also compared the C/N and N/O abundance ratios to surface abundances predicted by stellar evolutionary calculations, which assumed that the star had been through a RSG phase with convective dredge-up. The N/O abundance ratio was found to be inconsistent with the star having been a RSG and therefore the nebula was likely to have been expelled during the BSG phase instead. However, the results were found to be consistent with some degree of rotational mixing while the star was near the main sequence. The wind analysis also suggested that Sher 25 has a relatively normal mass-loss rate in comparison with other Galactic B-type supergiants. Paper I also inspected the spectra for signs of binarity, but the exposures had insufficient temporal coverage over which to search for significant variations.
At present, the data from the star and the nebula of Sher 25 appear to be in conflict. Paper I did not find any evidence to suggest that the nebula was ejected during a previous RSG phase, or that Sher 25 had in fact been a RSG at all. Moreover, no evidence for blue loops has been found in studies of B-type supergiants (McErlean et al., 1999), nor in LBVs (Lamers et al., 2001). However, although the higher [N ii]/H ratios in comparison to the background ratios found by Brandner et al. (1997a) are indicative of N enrichment from the CNO cycle, it is not conclusive. No quantitative abundance analysis was carried out by Brandner et al. (1997a, b), as the spectra did not have sufficient wavelength coverage to determine electron densities and temperatures. In order to ascertain whether the hourglass nebula of Sher 25 is consistent with it having undergone a blue loop, a detailed abundance analysis is required.
The evolutionary status of Sher 25 has important implications for the progenitor of SN 1987A. The current theory of the evolution of single stars cannot account for several features of Sk and SN 1987A, i.e., the fact that Sk exploded as a BSG, the triple ring nebula, nor the chemical anomalies observed, principally the enhancement of He and CNO products (Podsiadlowski & Ivanova, 2003). This raises the question, did Sk actually go through a RSG phase? Was it a completely unique star? The observations have been reproduced by recent models of binary evolution that invoke the ‘slow merger’ of a RSG with a mass of 15–20 M⊙ with a companion of 1–2 M⊙, depending on the evolutionary state of the primary at the onset of the merger (Ivanova & Podsiadlowski, 2003; Podsiadlowski & Ivanova, 2003). Morris & Podsiadlowski (2005) then demonstrated how this can lead to the observed triple ring structure. Could the nebula around Sher 25 also be attributed to the presence of a companion star? A detailed abundance analysis could also indicate the origin of the nebula. We would assume that the abundances in the nebula would be the same as those in the photosphere of the star if it had been ejected in the near past. However, if the abundances showed real differences then it would indicate that the nebula was not the result of a mass ejection from Sher 25, but perhaps the result of the destruction of (or a severe mass-loss event from) an unseen companion.
In this paper we attempt to answer some of the questions that have been raised by the previous analyses. New nebular and stellar observations are presented in Section 2, followed by abundance analyses in Section 3 and a discussion of a potential binary companion in Section 4. The implications of both the nebular analysis and the search for a companion are summarised in Section 6.
2 Observations
2.1 Nebular observations
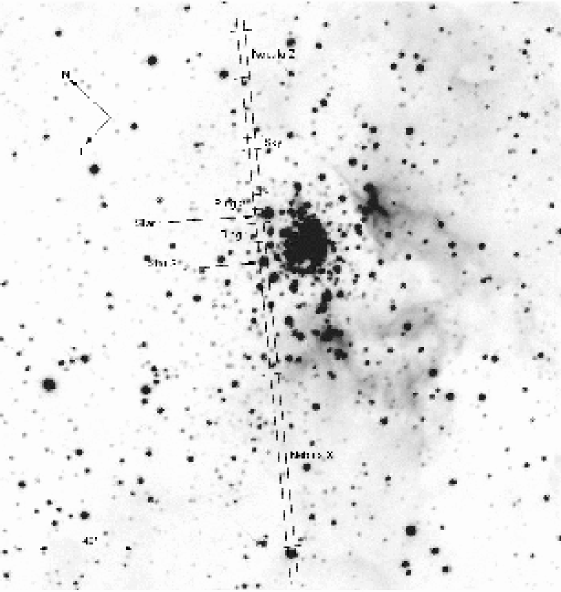
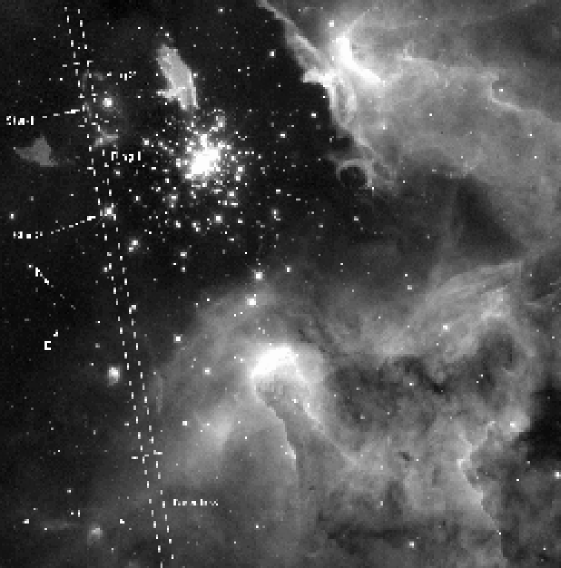
Long-slit spectroscopy of the nebula was obtained to enable a detailed abundance analysis of the two bipolar lobes, the ring of Sher 25 and the background nebula of NGC 3603. The observations were taken with the ESO 3.6-m telescope at La Silla, Chile with the ESO Faint Object Spectrograph and Camera (EFOSC2) on two consecutive nights commencing on 2003 May 7. Exposures were taken at two slit positions using Grism #11 with a 1′′ slit. The slit on the first night was orientated approximately east-west (EW), observing the bipolar lobes, while on the second night the slit was approximately north-south (NS), observing the ring. A list of the observations is given in Table 1. The slits were aligned using stars 1 and 2, labelled in the finders in Figures 1 and 2. The finders also show the apertures extracted along the different slit positions. The ground-based finders, shown in the top figures, are from a 10 s -band image taken with the ESO Multi Mode Instrument (EMMI) on the ESO 3.58-m New Technology Telescope (NTT) at La Silla, Chile. The bottom figures are finders of Sher 25 and the surrounding nebula showing the slit positions and the extracted apertures in more detail. The width of the slit in the figures does not reflect the difference in resolution of the NTT to the images. The final resolution of the spectra, as measured from the FWHM of the night sky lines was 14 Å, with spectral coverage from 3550 to 7345 Å.
| Date | JD | PA | Airmass | Set |
|---|---|---|---|---|
| (245 0000+) | (degree) | |||
| 2003 May 7 | 2767.49 | 1.20 | 1st | |
| 2003 May 7 | 2767.51 | 1.18 | 1st | |
| 2003 May 7 | 2767.53 | 2.11 | 1.18 | 1st |
| 2003 May 7 | 2767.56 | 17.01 | 1.19 | 2nd |
| 2003 May 7 | 2767.58 | 29.27 | 1.21 | 2nd |
| 2003 May 7 | 2767.60 | 40.25 | 1.24 | 2nd |
| 2003 May 8 | 2768.48 | 1.21 | 1st | |
| 2003 May 8 | 2768.50 | 1.19 | 1st | |
| 2003 May 8 | 2768.52 | 1.18 | 1st | |
| 2003 May 8 | 2768.55 | 11.44 | 1.18 | 2nd |
| 2003 May 8 | 2768.57 | 23.55 | 1.20 | 2nd |
| 2003 May 8 | 2768.59 | 34.94 | 1.23 | 2nd |
The spectra were reduced using standard techniques within iraf. The frames were debiased, then flat-fielded using normalised dome flats. Six target spectra, each 1800 s long, were obtained on both nights, with He-Ar arcs taken before, after and during the run. Unfortunately a small drift occurred during the arc exposure in the middle of the run so the processed target spectra were combined into two different sets for each night; before and after the arc (1st and 2nd sets in Table 1). The different sets were then calibrated separately and later the wavelength calibrated, extracted 1D spectra were combined.
Long-slit spectra suffer from geometric distortions introduced by a number of factors including differential atmospheric diffraction, the camera optics and the grism. These distortions were removed from the 2D spectra by a geometric transformation of the standards, combined arcs and the target spectra using iraf tasks within the longslit package in twodspec. Using the identify and reidentify tasks spectral lines were identified in the arc spectra along the dispersion axis and reidentified at a constant interval over the whole 2D spectrum. The fitcoords task was then used to fit a 2D function to the wavelength with respect to the pixel coordinate, producing a wavelength transformation map. The geometric correction was then applied to the arc using the transform task. The wavelength map was checked by comparing the corrected arc to the original before it was applied to the standards and target spectra.
In both sets the transformation of the EW slit was not well determined in the blue near [O ii] 3727, as the spectral feature identified in the calibration arc was quite weak and unreliable. The wavelength solution in the blue was therefore slightly uncertain. No such problem, however, was encountered during the transformation of the NS slit. Even with this problem, the transformation greatly improved the distortions in the spectra for both slit positions. The 2D wavelength-calibrated target spectra were then flux calibrated using the geometrically-corrected standard spectra (extracted using apall). Only standard star observations that were observed at a low airmass and with a larger slit-width were used for flux calibration. In both slit positions at least two standards were used. The spectra were corrected for extinction and flux calibrated using the standard iraf tasks standard, sensfunc and calibrate. The 2D spectra could not be background subtracted as the transformation at the blue end was not perfect. This was because the calibration arc had no suitable lines in the far blue, causing a small distortion to remain. The sky was instead subtracted from the extracted 1D spectra.

The extraction apertures for the target and sky spectra, shown in Figures 1 and 2, were identified by comparing the H emission to the stellar continuum along the slit. The exact apertures that were extracted are shown in Figure 3 and correspond to those in Figures 1 and 2. The sky spectra in the EW slit were extracted from the east end of the slit where the H emission was at its lowest (Figure 3, upper panel). The sky from the EW slit was combined into two different spectra, Sky123 and Sky12, to get a better handle on the errors associated with the sky-subtraction. Sky123 and Sky12 were found to differ slightly in the nebular lines, particularly in the Balmer, N and O lines. The night sky lines and background features were the same in both spectra. As can been seen in Figure 3 (lower panel) the background nebulosity extends over the full length of the NS slit, so the sky spectrum was extracted from the region where the H emission dips to its lowest level. The NS and EW skies were quite similar, as we would desire, with Sky123 in better agreement agreement with the NS sky spectrum. The 1D target spectra were extracted using the apall task from the wavelength and flux-calibrated 2D spectra using the brightest star as a template. The 1D spectra were then read into the spectral analysis program dipso (Howarth et al., 2003) for sky subtraction and further analysis.
As can be seen from the images of NGC 3603 and Figure 3, the background is highly complex and we selected the background regions for subtraction from the Sher 25 nebula as carefully as possible. Ideally it would be desirable to sample the background adjacent to the nebular extraction window. However, at our ground-based resolution this would have led to the background often being contaminated with stellar continuum, or high regions of background flux that were not necessarily representative of the background in the nebular aperture. This is perhaps the major limitation of this ground-based study; spectroscopy at the resolution of the HST images would undoubtedly improve this. Thus, we demonstrate throughout this paper the consequence of using two different sky selections, and propagate that through the abundance analyses.
The extracted 1D spectra were sky subtracted, then the first and second sets of both the EW and NS target spectra (Table 1) were combined within dipso. The EW spectra were then sky subtracted and co-added. The night sky lines were fully subtracted in all the spectra illustrating the success of the sky subtraction. The extracted, sky-subtracted target spectra are shown in Figures 4 and 5, and a line identification is given in Figure 6. The line fluxes were measured in dipso using the emission line fitting package elf. The errors in the line fluxes were estimated from the root-mean-square (RMS) of the continuum and were taken to be , where the represents the width of the line where the flux is 6% of the peak, i.e. the width at the base of the line. A 1% flux calibration error was also combined in quadrature.


2.2 Stellar observations
Sher 25 was observed using the University College London Échelle Spectrograph (UCLES) on the Anglo-Australian Telescope (AAT) on the night of 1999 May 28, as described in Paper I. Two wavelength regions were observed, one centred at 4335 Å, with the other at 6560 Å. The UCLES spectra lacked good temporal coverage, but the blue-region exposures were still check for evidence of a companion in Paper I, with no velocity shifts found at a significance greater than the estimated error of 6 . Sher 25 has since been observed using the Fibre-fed, Extended Range Optical Spectrograph (FEROS) on the 2.2-m Max Planck Gesellschaft (MPG)/ESO telescope on 2004 July 5–7 and again six months later with the same instrument. FEROS is a fixed configuration instrument, with = 48,000, giving a wide wavelength coverage of 3600–9200 Å in one exposure. The data were reduced using the standard FEROS data reduction pipeline, which runs under the midas environment. A journal of these observations can be found in Table 2.
| Date | JD | Range | Resolution | Telescope + | Observer |
|---|---|---|---|---|---|
| (245 0000+) | (Å) | (Å) | Instrument | ||
| 1999 May 28 | 1326.95 | 6534–6589 | 0.17 | AAT+UCLES | Smartt |
| 1327.00 | 3914–5284 | 0.11 | |||
| 2004 Jul 05 | 3191.60 | 3796–5030 | 0.09 | MPG/ESO+FEROS | Evans/Hendry |
| 6346–6783 | 0.14 | ||||
| 2004 Jul 07 | 3193.56 | 3800–5007 | 0.09 | MPG/ESO+FEROS | Evans/Hendry |
| 6346–6783 | 0.14 | ||||
| 2004 Dec 30 | 3369.85 | 3802–5008 | 0.09 | MPG/ESO+FEROS | Burnley |
| 6345–6779 | 0.14 | ||||
| 2004 Dec 31 | 3370.85 | 3796–5003 | 0.09 | MPG/ESO+FEROS | Burnley |
| 6345–6779 | 0.14 | ||||
| 2005 Jan 01 | 3371.83 | 3804–5008 | 0.09 | MPG/ESO+FEROS | Burnley |
| 6345–6778 | 0.14 |
AAT = 4-m Anglo-Australian Telescope, Australia. MPG/ESO = 2.2-m Max Planck Gesellschaft/ESO telescope, La Silla, Chile.
3 Nebular and stellar abundance analysis
3.1 Nebular abundance method
The nebular abundances were derived using the ‘direct’ method described by Skillman (1998). The logarithmic extinction at H, , was derived from the H/H, H/H and H/H ratios, whilst simultaneously solving for the effects of the underlying stellar absorption. The equivalent width of the stellar absorption, , was assumed to be equal for all four Balmer lines. The theoretical Balmer line ratios were calculated using the H emissivity calculations from Hummer & Storey (1987), which are very similar to the values calculated by Brocklehurst (1971). The Galactic reddening law used was that of Cardelli et al. (1989), assuming . The extinction, stellar absorption and their associated errors were determined from Monte Carlo simulations, using the method described by Olive & Skillman (2001). In some instances the H line was not present, in which case its flux was set to a negligible amount. The density assumed throughout this analysis was , because of the lack of resolved lines that can be used as density diagnostics. In the low-density limit, which is defined as being significantly lower than the critical densities, the emissivities do not vary appreciably with density for any of the transitions involved.
A reliable measurement of the electron temperature of the ionised gas is necessary for the ‘direct’ conversion of emission line strengths into ionic abundances. The electron temperatures were measured in most cases using the [N ii] and the [O iii] line ratios. The temperature was found from an analytical fit to these line ratios calculated for different temperatures using the ionic task within the iraf nebular suite of programs. This suite of programs is based on the fivel program developed by de Robertis et al. (1987) and described by Shaw & Dufour (1995). Wherever possible the N+ and the O++ electron temperatures, and , were measured although it was not possible to measure because of the wavelength range of the spectra.
A single electron temperature cannot be adopted for the whole nebula. Stasińska (1980) showed that in high metallicity nebulae the temperature increases with radius. This is because of the more efficient cooling of the [O iii] fine-structure lines in the inner parts of the nebula, where O++ is more dominant. O+, which is more abundant at larger radii, is not as efficient a coolant as O++, because it does not have similar IR fine-structure lines. Oxygen ions play a dominant role in the cooling process so, to a first approximation, it is reasonable to treat the nebula as having two different temperature zones, roughly corresponding to the O+ and the O++ zones. In this model, is taken to represent the temperature of the high ionisation species and , or in this case, the low-ionisation species (Garnett, 1992). However, photoionisation models suggest that some ions, such as S++ and Ar++, do not fit into the two-zone model and instead a three-zone model is more appropriate. Garnett (1992) showed that the region where S++ predominates straddles the zones in which O++ and O+++ dominate. The more appropriate estimation of and is given in equation (1). This three-zone model is assumed here and the Garnett (1992) relationships, which were adopted for the other ionic temperatures, are given in equations (1)–(4), where is the electron temperature in units of K.
| (1) | |||||
| (2) | |||||
| (3) | |||||
| (4) |
When could not be measured, it was estimated from equation (2), using . In the few cases where neither or could be measured, they were estimated from the simple average of the other Sher 25 or NGC 3603 background spectra, with an adopted error of 2,000 K.
Ionic abundance ratios were then calculated from the reddening and Balmer, absorption-corrected, emission line ratios, listed in Table 7, using equation (5) where is the theoretical emissivity and is the ionic abundance by number of ion Xi.
| (5) | |||||
| (6) | |||||
| (7) |
The theoretical emissivities were calculated from parabolic fits, with respect to temperature, of the output from the nebular task ionic. The He++ abundance is calculated from the He ii line using the relationship given in equation (6), which is a fit to the coefficients of Hummer & Storey (1987), and hence the O+++ abundance is estimated using equation (7). The elemental abundances were calculated from the sum of the ionic abundances from all the relevant ionic states. When this is not possible, the elemental abundance ratio was calculated from the available ionic abundances with an ionisation correction factor (ICF) applied instead. The ICFs used are those of Izotov & Thuan (1998), which were found analytically from a fit to the model calculations of photoionised H ii regions by Stasińska (1990). They are given in equations (8)–(10), where .
| (8) | |||||
| (9) | |||||
| (10) | |||||
The measured line fluxes and equivalent widths are listed in Table 7, alongside the reddening and absorption-corrected intrinsic line fluxes. Also listed in the table are the H flux and the final reddening and underlying Balmer absorption equivalent width corrections, and , that were applied from the Monte Carlo algorithm. Table 3 shows the flux ratios of [N ii] and 6584 with respect to H, compared to those of Sher 25 and SN 1987A from Brandner et al. (1997a).
The ionic and total abundances for the Sher 25 nebula and NGC 3603 background nebula are listed in Tables 8 and 9, respectively. The temperatures that were used to derive these abundances are also listed. A summary of the total abundance ratios of N/O and the total logarithmic abundance ratios of O, N, S, Ne and Ar is given in Table 4 for both the Sher 25 nebula and the NGC 3603 background nebula. The abundances for the different background subtractions are given for the EW spectra, with their averages in the following entries. The average EW abundances were then averaged with the NS abundances to give overall values for the Sher 25 and background nebulae, as given in bold font in Table 4. The abundances from R1 (surrounded by square brackets in the table) were not included in the averages. The Sher 25 stellar abundances (from Section 3.2) are also listed for comparison, as are solar abundances from Asplund et al. (2004) and Asplund et al. (2005). The solar Ar and Ne abundances, however, should be treated with caution as they are indirect measurements.
The [N ii]/H line ratios for the ring from Brandner et al. (1997a) are consistent with the values measured here (see Table 3). However, Brandner et al. find higher values for both the East Cloud (or the poles in Brandner et al’s nomenclature) and the background nebula. The Brandner et al. spectra were background subtracted by linear interpolation between the nebular emission to either side of the extracted spectrum. This is where the difference probably enters, as it was found in the spectra presented here that the emission close to the extracted spectra was too similar to be background. It was concluded that the object was quite extended and that the sky should be extracted from further afield. In the further paper by Brandner et al. (1997b) the structure around Sher 25 was shown to be a full hourglass nebula, therefore it is possible that the subtracted background was part of the structure and not only background.
In general, the abundances for the three components of the Sher 25 nebula (WC, EC and the ring) agree very well (see Table 4), with a maximum RMS scatter of 0.2 dex between the different spatial positions. The O abundances of the Sher 25 nebula are comparable with both those in the background nebula and solar abundances, suggesting that the cluster and the original composition of Sher 25 was similar to solar. The S abundances of the background nebula agree well with the solar value (within the errors), whereas the Ne abundances are significantly higher than the solar and the background nebular abundances, although the solar Ne abundance may be suspect (Drake & Testa, 2005). The mean Ar abundances of the Sher 25 nebula are also somewhat higher than the background, although within the uncertainties they are not incompatible. The differences between the solar and nebular abundances for Ne and Ar may arise not only from the indirect measurements of the solar abundances, but also from the ICFs as they are based on photoionisation models. As we will discuss below, the stellar O abundance from fastwind is also in good agreement with that from the nebula, within the expected uncertainties (see Section 3.2). As discussed above in Section 2.1, there may be some contamination of background nebular flux in the extracted Sher 25 circumstellar apertures. As the main difference between the surrounding nebula and that of Sher 25 is the N abundance, such contamination would work to reduce the measured enhancement of N. Hence, the very high N abundance appears to be a robust result and is supported in the stellar analysis below.
| Object | N/O | |||||
|---|---|---|---|---|---|---|
| EC12 | 1.36(0.22) | 8.65(0.13) | 8.78(0.14) | – | 8.42(0.15) | 6.70(0.13) |
| EC123 | 3.07(0.97) | 8.63(0.13) | 9.12(0.17) | – | 8.71(0.15) | 6.87(0.12) |
| EC (mean)a | 2.22(0.50) | 8.64(0.09) | 8.95(0.20) | – | 8.57(0.18) | 6.78(0.12) |
| WC12 | 1.50(0.22) | 8.64(0.18) | 8.82(0.19) | – | – | 6.53(0.19) |
| WC123 | 1.54(0.22) | 8.62(0.17) | 8.81(0.18) | – | – | 6.49(0.19) |
| WC (mean)a | 1.52(0.16) | 8.63(0.13) | 8.81(0.13) | – | – | 6.51(0.13) |
| [R1 | 1.27(0.43) | 8.57(0.34) | 8.67(0.35) | – | 8.29(0.36) | 6.65(0.33)] |
| R1+R2 | 2.61(1.31) | 8.55(0.36) | 8.97(0.38) | – | 8.35(0.38) | 6.81(0.33) |
| Sher 25 Nebulab | 2.12(0.55) | 8.61(0.13) | 8.91(0.15) | – | 8.46(0.21) | 6.70(0.17) |
| NA12 | 0.07(0.01) | 8.60(0.07) | 7.46(0.07) | 7.29(0.05) | 8.17(0.07) | 6.44(0.06) |
| NA123 | 0.07(0.01) | 8.59(0.11) | 7.44(0.12) | 7.28(0.06) | 8.17(0.12) | 6.44(0.08) |
| NA (mean)a | 0.07(0.01) | 8.60(0.07) | 7.45(0.07) | 7.29(0.04) | 8.17(0.07) | 6.44(0.05) |
| NB12 | 0.12(0.01) | 8.56(0.08) | 7.66(0.08) | 7.52(0.04) | 8.15(0.08) | 6.42(0.07) |
| NB123 | 0.14(0.01) | 8.64(0.08) | 7.79(0.09) | 7.46(0.05) | 8.23(0.09) | 6.46(0.07) |
| NB (mean)a | 0.13(0.01) | 8.60(0.07) | 7.72(0.09) | 7.49(0.04) | 8.19(0.07) | 6.44(0.05) |
| NC12 | 0.08(0.02) | 8.46(0.09) | 7.35(0.13) | 7.09(0.05) | 8.00(0.09) | 6.33(0.06) |
| NC123 | 0.06(0.02) | 8.49(0.10) | 7.30(0.14) | 7.09(0.05) | 8.04(0.10) | 6.35(0.06) |
| NC (mean)a | 0.07(0.01) | 8.47(0.07) | 7.32(0.10) | 7.09(0.04) | 8.02(0.07) | 6.34(0.04) |
| NX | 0.07(0.01) | 8.55(0.23) | 7.39(0.24) | 7.01(0.25) | 8.04(0.24) | 6.54(0.24) |
| Background Nebulab | 0.09(0.03) | 8.56(0.07) | 7.47(0.18) | 7.22(0.22) | 8.11(0.09) | 6.44(0.08) |
| Solar | 0.13(0.02) | 8.66(0.05)c | 7.78(0.06)d | 7.14(0.05)d | 7.84(0.06)d | 6.18(0.08)d |
| Sher 25 fastwind | 1.7 | 8.51(0.18) | 8.74(0.39) | – | – | – |
3.2 Stellar abundance analyses
A model atmosphere and abundance analysis of the stellar spectrum of Sher 25 was presented in Paper I. However, there are now more sophisticated codes available that provide consistent, unified treatments of the stellar wind and photospheric features. Here we present results from re-analysis of the high-resolution UCLES spectra using three contemporary model atmosphere codes; these results now supercede those from Paper I. In the first instance we employed the photospheric code tlusty to determine atmospheric parameters and abundances in the photosphere, assuming no wind contribution to any of the optical lines (for details of the model grids used see Hubeny & Lanz, 1995; Hunter et al., 2007). We then analysed the spectra using the stellar-wind codes fastwind (Puls et al., 2005) and cmfgen (Hillier & Miller, 1998; Hillier et al., 2003). The application of these codes to studies of B-type supergiants is described in detail by Trundle et al. (2004) and Crowther et al. (2006a), respectively.
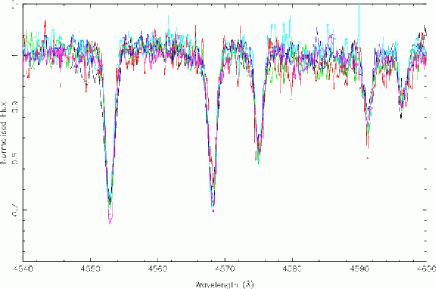
All three codes yield very similar physical parameters (summarised in Table 5), including similar mass-loss rates from the two analyses of the H profile. Note that we adopted slightly different values for for the fastwind and cmfgen analyses – both are reasonable values for early B-type supergiants (Trundle et al., 2004; Crowther et al., 2006a), and changes in over the range of 750 to 1000 do not affect the resulting abundances in either analysis. Fits to the H line are shown in Figure 7.

The nitrogen and carbon abundances are in reasonable agreement between the new methods (within the typical uncertainty of 0.2 dex), however the absolute oxygen abundance is significantly lower in the cmfgen analysis than the other two. As Sher 25 is a very luminous supergiant with a strong wind, we favour adopting the results of either fastwind or cmfgen as the most reliable measure of photospheric abundances. We suggest that the fastwind abundances are the better estimate, as we employed all of the 15 Oii and 7 Nii lines that were included in the observed spectra, and for which reliable atomic data exists. The cmfgen analysis used profile fitting to a smaller number of selected lines. For example, for oxygen these were Oii 4069-4092 Å and 4590-96 Å. The use of more lines in the fastwind analysis, and the resulting mean abundance, mitigates against systematic uncertainties in atomic data for any particular multiplet. As we want the best estimate of absolute abundances in the stellar photosphere for comparison with the nebular results and solar-like abundances, we therefore adopt the fastwind values as the best comparison. The uncertainties in the table are the standard error of the mean, and are just a measure of the statistical scatter of the results from the individual atomic transitions. As discussed by Trundle et al. (2004) and Hunter et al. (2007) the typical systematic uncertainty from errors on the derivation of atmospheric parameters are around 0.2 dex. This should be remembered when comparing the stellar results with the nebular abundances.
A new distance to NGC 3603 has been calculated recently by Melena et al. (2008) and they compiled a list of all distances quoted in the literature. Their favoured distance of 7.6 kpc and consistent treatment of line-of-sight extinction leads them to suggest a luminosity of Sher 25 of dex. Their comparison with the Geneva tracks (Meynet et al., 1994) would then suggest an initial mass of M⊙.
| Parameter | NLTE H/He | tlusty | fastwind | cmfgen |
| (K) | ||||
| (cgs) | ||||
| () | 1.75 | … | 1.95 | 1.60 |
| () | 1000 | … | 1000 | 750 |
| 1.5 | … | 2.5 | 2.5 | |
| () | 15 | 20 | 23 | 15 |
| C | 7.010.06 | … | ||
| N | 8.420.12 | |||
| O | 8.870.07 | |||
| Mg | 7.46 | … | … | |
| Si | 7.420.07 | … |
3.3 Discussion of abundances
The most significant result from this analysis is the enhanced N abundance of the Sher 25 nebula compared to the background nebula and solar abundances. The N abundance of the nebula is 0.17 dex larger than the stellar values from fastwind. However, considering the uncertainties in the absolute values of both, the difference is not significant and we consider the results to be consistent. The N/O ratio (by number) in the nebula and the star are also consistent within the uncertainties, and both are significantly higher than that previously reported by Paper I. The reason for the lower value in Paper I was the very high O abundance derived. As discussed above, we believe that the fastwind models produce more reliable results than the previous spherical, blanketed models. The fact that the new tlusty results, fastwind abundances, and nebular values are in good agreement supports our conclusion that the N/O of the stellar photosphere and nebula is in the range .
The morphology of the nebula and the strength of the N emission lines were suggested by Brandner et al. (1997a,b) to be a consequence of the star having gone through a previous RSG phase. A similar evolutionary path for Sk has been proposed to explain the hourglass-shaped nebula now seen around SN 1987A. The very high N/O which is quantitatively similar in both the stellar photosphere and the nebula could be interpreted as supporting this scenario. Lamers et al. (2001) presented the abundances that are predicted for the stellar envelope by the models of Meynet et al. (1994) after convective mixing during the RSG phase. As discussed above, the best estimate for the initial mass of Sher 25 is M⊙. Adopting a typical mass-loss rate of (Puls et al., 1996) and a main sequence (core hydrogen burning) lifetime, , of 4 Myr, the star is likely to have lost around 8–20M⊙. This would leave Sher 25 with 60–85 % of its mass at the onset of the convective mixing. Lamers et al. (2001) plotted the logarithmic N/O abundance as a function of the remaining mass fraction for several masses. The models indicate that Sher 25 should have a N/O abundance in the range of if it had gone through a previous RSG phase, and was originally a 40-60M⊙ main-sequence star. Hence our N/O result is just consistent with the lower end of this range, and one could interpret this as support for the star being in a post-RSG phase. Similar N enhancements for stars on blue loops are found by Heger & Langer (2000), who find that a 25M⊙ star should show an N enhancement of around 1.0 dex after having passed through RSG dredge-up.
However, we suggest that it is quite possible that the star has not been through a RSG phase and that the N enrichment we see is due to rotational mixing while the star was on the main-sequence. For example Lamers et al. (2001) also predict the surface abundances for rotationally-induced mixing as a function of mixing time, and our abundances are more consistent with this scenario. The authors predict N/O abundances in the range of for weak-to-strong mixing. Weak mixing has a mixing time greater than 5 , and strong mixing less than 0.5 . The N/O abundance of the Sher 25 nebula is consistent with a moderate amount of mixing, with a mixing time of 2.5 . The N abundance is also greatly enriched by almost a factor of 30 above the background nebula and around 13 times that of the solar levels. Similar values for N/O enrichment are also predicted by Heger & Langer (2000), although their most massive models were for 25 M⊙. The post-RSG scenario has a further problem in that a star of initial mass 50 M⊙ is somewhat too massive to have been a RSG with a convective envelope. Observationally we tend not to see RSGs with luminosities that would place their initial masses above 25 M⊙ (Levesque et al., 2005). Theoretical tracks at 40 M⊙ and above also do not reach the coolest regions where the atmospheres are certain to become convective. Smith (2007) also points out this problem with the RSG origin of the nebula for Sher 25 citing the lack of very massive, cool supergiants in observational H–R diagrams of single stars in the Local Group (e.g., Humphreys & Davidson, 1994). The consistency we see between the nebular N and O abundances show that the nebula is of the same composition as the stellar photosphere. We would suggest that this likely due to an ejection event from Sher 25 when it was in the BSG phase rather than a combination of a RSG with a dense slow wind being swept up by a subsequent faster wind from the hot B-type phase (Brandner et al., 1997a). Smith (2007) has also advanced dynamical arguments that the newly discovered ring structure around HD 168625 was ejected in a LBV eruption while the star was in the hot blue phase rather than being a swept up RSG wind. There seems to be a body of evidence now arguing against the RSG origin for these ring nebulae and perhaps an ejection mechanism while the star is still hot. We note that HD 168625 is of significantly lower luminosity and lower initial mass (20M⊙) than Sher 25 (50M⊙), and it is interesting that such similar ring structures are found around blue supergiants of vastly different mass. A mechanism for ejection of a nebula which has bipolar lobes and a disk structure from a near critically-rotating BSG has been proposed by Smith & Townsend (2007). This requires a pre-RSG phase and is attractive for very massive stars with circumstellar nebulae showing this type of morphology. Clearly Sher 25 is not currently rotating near its break-up velocity; its photospheric line-widths were given by Paper I as 98 . This is an upper limit to the as there is clear evidence now for a macroturbulent broadening mechanism in the atmospheres of hot supergiants (Hunter et al., 2008; Ryans et al., 2002). The results from these analyses would which would suggest a more likely rotational velocity for Sher 25 of 60 . If we assume that the rotation axis is aligned with the bi-polar lobes, then the inclination angle (Brandner et al., 1997b) would suggest a , far lower than critical. However this does not rule out the possibility of very fast rotation earlier in its lifetime. As B-type supergiants are evolved from massive O-type main-sequence stars, these progenitors often are rotating very rapidly and can be near critical.
The overall stellar parameters of Sher 25 (temperature, luminosity, mass-loss rate and photospheric abundances) are very much in line with those derived for other Milky Way B-type supergiants and the star itself does not appear anomalous in any striking way (Crowther et al., 2006a, b; Markova & Puls, 2008). The nebular abundances presented here support this view point. Apart from its nebula, it appears as a typical B-type supergiant in a normal young star cluster. However as demonstrated clearly by Melena et al. (2008), Sher 25 has an implied age of 4 Myrs which is significantly older than the most massive cluster members which are around 1 Myr old. Sher 25 also sits some 20′′ from the core which contains the bulk of the most massive stars. There is one other slightly evolved supergiant (Sher 23), which also appears to be a similar age to Sher 25. So there is some evidence of an age spread in the star-formation history of NGC 3603 and the question of whether Sher 25 was formed in the core and ejected, or formed near were we see it now, is still open.
4 Stellar binarity analysis
The spectra listed in Table 2 were first corrected for the heliocentric velocity and then cross-correlated with the 4547–4652 Å wavelength region of the spectrum of 1999 May 28 using dipso. The peak of the cross-correlation function was measured by fitting one or more Gaussian profiles to it using the dipso package elf. The resultant velocities are listed in Table 6. The July velocity set was shifted relative to the December set arbitrarily in time so that they coincided, revealing a sinusoidal velocity variation. The July and December velocity sets are shown with open and filled circles in Figure 8. In order to verify this variation a sine curve was fitted to the data using a -fitting algorithm. While carrying out this -fit the relative shift between the two datasets was varied to find the best fit possible. The July data set was iteratively shifted in order to find the best -fit. The data was fitted by , which had , corresponding to a period of around 3 d and an amplitude of 8.44 . The values are very low as a result of the error of 6 attached to each of the points, being large and perhaps overestimated. The arbitrary amount that the July data set was shifted by relative to the December dataset was consistent with a full number of complete periods, within the errors. The shifted velocities and best-fit sine function are plotted in Figure 8.

| Date | JD | Velocity with respect |
|---|---|---|
| to 1999 May 28 | ||
| (245 0000+) | () | |
| 1999 May 28 | 1327.00 | 0.00 |
| 2004 Jul 05 | 3191.60 | 7.01 |
| 2004 Jul 07 | 3193.56 | 0.10 |
| 2004 Dec 30 | 3369.85 | -0.07 |
| 2004 Dec 31 | 3370.85 | 13.47 |
| 2005 Jan 01 | 3371.83 | 10.00 |
These radial velocity shifts could be indicative of an unseen binary star. Using simple Keplerian arguments and the mass (M⊙) and radius (R⊙; from the models of Meynet et al. 2004) for Sher 25, we can put some limits on the parameters of the system to ascertain if the binary scenario is plausible. The parameters from the fit in Figure 8, together with the lower limit of the radius (45 R⊙) as the lower limit of the separation, indicate that the combined mass of the primary and secondary would have to be greater than 136 M⊙. This would suggest that the secondary would be much more massive than Sher 25, contrary to what we observe. The short period, but low maximum velocity amplitude of Sher 25 are hence inconsistent with a plausible close binary. Moving the centre of mass closer than the radius of Sher 25 might be attractive to slow merger hypotheses (e.g., Podsiadlowski & Ivanova, 2003). However, this is very speculative, as the dataset does not have enough temporal coverage to say one way or another. An altogether different explanation for these observations could be pulsations or some other natural variation in the stellar envelope or, given that the velocity shifts are of the same order as the uncertainties, an artifact of the wavelength calibration. Note, however, the same velocity shift is not present in the interstellar Ca ii 3933 Å line. Given this evidence, Sher 25 certainly warrants further spectroscopic monitoring in the future.
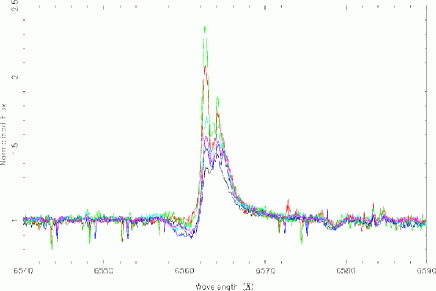
5 Sher 25’s variable wind
Another interesting feature of Sher 25 is evidence of a variable wind. Figure 9 shows the H and Si iii profiles of the Sher 25 spectra, where the colours used are as follows: black = 1999 May 28, red = 2004 July 5, green = 2004 July 7, blue = 2004 December 30, light blue = 2004 December 31 and pink = 2005 January 1. The H profiles, in all cases, show a variable double peak, which is the nebular component of Sher 25 superimposed onto the stellar profile. The peaks of the profiles are probably varying because of the different amounts of nebular emission that made it into either the slit or the aperture, depending on their exact position, or because of the sky subtraction. The UCLES (black line) spectra are from a single-slit spectrograph, whereas FEROS is a fibre-fed instrument. Paper I noted that the secondary peak bluewards of the rest wavelength of H in the UCLES spectrum is a result of the imperfect nebular subtraction. FEROS has two fibres, each of 2′′ diameter, which are separated by a fixed angular distance of 2.9′. Because of field rotation, it is highly probable that different amounts of the nebula were subtracted from different FEROS observations, as a result of the sky fibre being located at different positions in the extended and highly variable background nebula.
The point of interest in this figure is the trough of the P-Cygni profile, which varies significantly in time, indicating the variability of the wind. The resolution of the spectra is good enough to resolve the two components of the profile, therefore the variation is considered to be real, as it will not be affected by the sky subtraction. This variability is not seen in the profiles of the photospheric Si iii lines, which have been corrected for the observed radial velocity offsets, indicating that it does indeed appear to come from the wind.
6 Conclusions
Long-slit spectroscopy of the hourglass-shaped nebula surrounding Sher 25 was presented alongside that of the background nebula of NGC 3603. The nebular analysis confirmed the enhanced N abundances suggested by Brandner et al. (1997b), but they are not enhanced enough to indicate definitively that Sher 25 has been through a RSG phase. However, the N abundance was enhanced by a factor of 30 above the background nebular values. A new analysis with the fastwind unified stellar atmosphere and wind code suggests that the photospheric N and O abundances in Sher 25 are consistent with the nebular results. We therefore conclude that the nebula was ejected from the star while it was a BSG. Probable variations in the stellar radial velocity were discovered and it was shown that there was a possible binary scenario for the variation with a period and amplitude of 3 d and 8.44 . Using simple Keplerian arguments it was shown that, if a companion exists, the combined mass of the primary and the secondary would have to be greater than 136 M⊙. This is not a plausible scenario as no massive companion is visible in the extensive imaging or spectroscopy of this object. The masses might be more plausible if the separation of the binary is less than the radius of Sher 25, and we were witnessing a slow merger. However, the uncertainties are comparable to the velocitiy variations and additional observations are required to investigate this aspect further.
Acknowledgments
Based on observations at the European Southern Observatory at La Silla, under programmes 071.D-0180 and 074.D-0021. This work, conducted as part of the award ”Understanding the lives of massive stars from birth to supernovae” (S.J. Smartt) made under the European Heads of Research Councils and European Science Foundation EURYI (European Young Investigator) Awards scheme, was supported by funds from the Participating Organisations of EURYI and the EC Sixth Framework Programme. M. Hendry would like to thank PPARC and the Leverhulme Trust for support. EDS is grateful for the hospitality of the IoA during his sabbatical visit, and for partial support from the University of Minnesota. We thank Adam Burnley for obtaining some of the FEROS observations presented, and Nathan Smith for a helpful review of the paper and general discussions on blue supergiants.
References
- Asplund et al. (2005) Asplund M., Grevesse N., Sauval A. J., 2005, in ASP Conf. Ser. 336: Cosmic Abundances as Records of Stellar Evolution and Nucleosynthesis The Solar Chemical Composition. pp 25
- Asplund et al. (2004) Asplund M., Grevesse N., Sauval A. J., Allende Prieto C., Kiselman D., 2004, A&A, 417, 751
- Brandner et al. (1997a) Brandner W., Grebel E. K., Chu Y.-H., Weis K., 1997a, ApJL, 475, L45
- Brandner et al. (1997b) Brandner W., Chu Y.-H., Eisenhauer F., Grebel E. K., Points S. D., 1997b, ApJL, 489, L153
- Brocklehurst (1971) Brocklehurst M., 1971, MNRAS, 153, 471
- Cardelli et al. (1989) Cardelli J. A., Clayton G. C., Mathis J. S., 1989, ApJ, 345, 245
- Crowther et al. (2006a) Crowther, P. A., Lennon, D. J., & Walborn, N. R. 2006, A&A, 446, 279
- Crowther et al. (2006b) Crowther, P. A., Lennon, D. J., & Walborn, N. R., Smartt S.J., 2006, A&A, in ”Mass loss from stars and the evolution of stellar clusters”, ASP Conf Ser, Eds. A. De Koter, L.J. Smith & R. Waters
- Drake & Testa (2005) Drake, J. J., & Testa, P. 2005, Nature, 436, 525
- de Robertis et al. (1987) de Robertis M. M., Dufour R. J., Hunt R. W., 1987, JRASC, 81, 195
- Fransson et al. (1989) Fransson C., Cassatella A., Gilmozzi R., Kirshner R. P., Panagia N., Sonneborn G., Wamsteker W., 1989, ApJ, 336, 429
- Garnett (1992) Garnett D. R., 1992, AJ, 103, 1330
- Gilmozzi et al. (1987) Gilmozzi R., Cassatella A., Clavel J., Fransson C., Gonzalez R., Gry C., Panagia N., Talavera A., Wamsteker W., 1987, Nature, 328, 318
- Heger & Langer (2000) Heger, A., & Langer, N. 2000, ApJ, 544, 1016
- Hillier & Miller (1998) Hillier, D. J., & Miller, D. L. 1998, ApJ, 496, 407
- Hillier et al. (2003) Hillier, D. J., Lanz, T., Heap, S. R., Hubeny, I., Smith, L. J., Evans, C. J., Lennon, D. J., & Bouret, J. C. 2003, ApJ, 588, 1039
- Howarth et al. (2003) Howarth I. D., Murray J., Mills D., Berry D. S., 2003, Starlink User Note 50.24. Rutherford Appleton Laboratory
- Hubeny & Lanz (1995) Hubeny, I., & Lanz, T. 1995, ApJ, 439, 875
- Hummer & Storey (1987) Hummer D. G., Storey P. J., 1987, MNRAS, 224, 801
- Humphreys & Davidson (1994) Humphreys, R. M., & Davidson, K. 1994, PASP, 106, 1025
- Hunter et al. (2007) Hunter, I., et al. 2007, A&A, 466, 277
- Hunter et al. (2008) Hunter, I., et al. 2008, A&A, 479, 541
- Ivanova & Podsiadlowski (2003) Ivanova N., Podsiadlowski P., 2003, in From Twilight to Highlight: The Physics of Supernovae The Slow Merger of Massive Stars. pp 19
- Izotov & Thuan (1998) Izotov Y. I., Thuan T. X., 1998, ApJ, 500, 188
- Izotov & Thuan (2004) Izotov Y. I., Thuan T. X., 2004, ApJ, 602, 2
- Lamers et al. (2001) Lamers H. J. G. L. M., Nota A., Panagia N., Smith L. J., Langer N., 2001, ApJ, 551, 764
- Levesque et al. (2005) Levesque, E. M., Massey, P., Olsen, K. A. G., Plez, B., Josselin, E., Maeder, A., & Meynet, G. 2005, ApJ, 628, 973
- Markova & Puls (2008) Markova, N., & Puls, J., 2008, A&A, 478, 823
- McErlean et al. (1999) McErlean N. D., Lennon D. J., Dufton P. L., 1999, A&A, 349, 553
- Melena et al. (2008) Melena N.W., Massey P, Morrell N.I., Zangari A.M., 2008, AJ, 135, 878
- Meynet & Maeder (2000) Meynet, G., & Maeder, A. 2000, A&A, 361, 101
- Meynet et al. (1994) Meynet G., Maeder A., Schaller G., Schaerer D., Charbonnel C., 1994, A&AS, 103, 97
- Moffat (1983) Moffat A. F. J., 1983, A&A, 124, 273
- Morris & Podsiadlowski (2005) Morris T., Podsiadlowski P., 2005, in ASP Conf. Ser. 342: 1604-2004: Supernovae as Cosmological Lighthouses The Triple Ring Nebula around SN 1987A. pp 194
- Olive & Skillman (2001) Olive K. A., Skillman E. D., 2001, New Astronomy, 6, 119
- Panagia et al. (1987) Panagia N., Gilmozzi R., Clavel J., Barylak M., Gonzalez-Riestra R., Lloyd C., Sanz Fernandez de Cordoba L., Wamsteker W., 1987, A&A, 177, L25
- Panagia et al. (1996) Panagia N., Scuderi S., Gilmozzi R., Challis P. M., Garnavich P. M., Kirshner R. P., 1996, ApJL, 459, L17
- Podsiadlowski & Ivanova (2003) Podsiadlowski P., Ivanova N., 2003, in From Twilight to Highlight: The Physics of Supernovae The Progenitor of SN 1987A: A Progress Report. pp 13
- Puls et al. (2005) Puls, J., Urbaneja, M. A., Venero, R., Repolust, T., Springmann, U., Jokuthy, A., & Mokiem, M. R. 2005, A&A, 435, 669
- Puls et al. (1996) Puls J., Kudritzki R.-P., Herrero A., Pauldrach A. W. A., Haser S. M., Lennon D. J., Gabler R., Voels S. A., Vilchez J. M., Wachter S., Feldmeier A., 1996, A&A, 305, 171
- Ryans et al. (2002) Ryans, R. S. I., Dufton, P. L., Rolleston, W. R. J., Lennon, D. J., Keenan, F. P., Smoker, J. V., & Lambert, D. L. 2002, MNRAS, 336, 577
- Santolaya-Rey et al. (1997) Santolaya-Rey, A. E., Puls, J., & Herrero, A. 1997, A&A, 323, 48
- Seaton (1979) Seaton M. J., 1979, MNRAS, 187, 73P
- Shaw & Dufour (1995) Shaw R. A., Dufour R. J., 1995, PASP, 107, 896
- Sher (1965) Sher D., 1965, MNRAS, 129, 237
- Skillman (1998) Skillman E. D., 1998, in Stellar Astrophysics for the Local Group: VIII Canary Islands Winter School of Astrophysics Chemical Evolution of the ISM in Nearby Galaxies. pp 457
- Smartt et al. (2002) Smartt S. J., Lennon D. J., Kudritzki R. P., Rosales F., Ryans R. S. I., Wright N., 2002, A&A, 391, 979 (Paper I)
- Smith & Townsend (2007) Smith, N., & Townsend, R. H. D. 2007, ApJ, 666, 967
- Smith (2007) Smith, N. 2007, AJ, 133, 1034
- Smith et al. (2007) Smith, N., Bally, J., & Walawender, J. 2007, AJ, 134, 846
- Stasińska (1980) Stasińska G., 1980, A&A, 85, 359
- Stasińska (1990) Stasińska G., 1990, A&AS, 83, 501
- Trundle et al. (2004) Trundle, C., Lennon, D. J., Puls, J., & Dufton, P. L. 2004, A&A, 417, 217
- van den Bergh (1978) van den Bergh S., 1978, A&A, 63, 275
- Walborn et al. (1989) Walborn N. R., Prevot M. L., Prevot L., Wamsteker W., Gonzalez R., Gilmozzi R., Fitzpatrick E. L., 1989, A&A, 219, 229
Appendix A Data tables of line fluxes and intensities
| EC12 | EC123 | |||||
| Ion | ||||||
| 3727 [O ii] | 0.109(0.015) | 0.725(0.099) | 25.50 | 0.049(0.015) | 0.346(0.105) | 11.06 |
| 3868 [Ne iii] | 0.056(0.013) | 0.311(0.073) | 14.09 | 0.097(0.015) | 0.566(0.089) | 20.22 |
| 3889 He i+ H8 | 0.046(0.013) | 0.254(0.071) | 11.45 | 0.101(0.015) | 0.569(0.086) | 20.83 |
| 3968 [Ne iii]+ H7 | 0.041(0.011) | 0.199(0.051) | 9.48 | 0.042(0.013) | 0.205(0.065) | 8.11 |
| 4026 He i | 0.004(0.011) | 0.016(0.047) | 0.80 | 0.006(0.013) | 0.026(0.059) | 1.05 |
| 4101 H | 0.073(0.008) | 0.287(0.033) | 13.13 | 0.073(0.010) | 0.288(0.042) | 13.01 |
| 4340 H | 0.227(0.010) | 0.575(0.026) | 33.82 | 0.222(0.012) | 0.572(0.032) | 32.96 |
| 4471 He i | 0.023(0.016) | 0.045(0.031) | 3.48 | 0.022(0.018) | 0.045(0.035) | 2.79 |
| 4861 H | 1.000(0.023) | 1.000(0.016) | 97.70 | 1.000(0.026) | 1.000(0.018) | 94.23 |
| 4921 He i | 0.007(0.007) | 0.006(0.007) | 0.78 | 0.010(0.011) | 0.009(0.010) | 0.91 |
| 4959 [O iii] | 0.872(0.021) | 0.748(0.014) | 78.05 | 0.812(0.023) | 0.696(0.015) | 70.65 |
| 5007 [O iii] | 2.829(0.056) | 2.259(0.026) | 242.91 | 2.648(0.057) | 2.110(0.027) | 221.84 |
| 5755 [N ii] | 0.060(0.017) | 0.020(0.006) | 3.34 | 0.066(0.017) | 0.021(0.006) | 3.43 |
| 5876 He i | 0.628(0.019) | 0.190(0.006) | 34.44 | 0.677(0.023) | 0.198(0.007) | 34.95 |
| 6548 [N ii] | 5.925(0.114) | 1.041(0.033) | 262.28 | 7.007(0.147) | 1.176(0.045) | 288.81 |
| 6563 H | 20.235(0.387) | 3.515(0.110) | 891.87 | 21.349(0.445) | 3.539(0.136) | 876.02 |
| 6584 [N ii] | 17.775(0.340) | 3.037(0.096) | 777.98 | 21.018(0.438) | 3.427(0.133) | 855.75 |
| 6678 He i | 0.347(0.015) | 0.055(0.003) | 14.71 | 0.376(0.018) | 0.057(0.003) | 14.78 |
| 6717 [S ii] | 0.441(0.016) | 0.068(0.003) | 18.41 | 0.399(0.018) | 0.059(0.003) | 15.46 |
| 6731 [S ii] | 0.522(0.017) | 0.080(0.003) | 21.71 | 0.527(0.020) | 0.076(0.004) | 20.32 |
| 7065 He i | 0.378(0.025) | 0.044(0.003) | 14.21 | 0.415(0.030) | 0.046(0.004) | 14.40 |
| 7136 [Ar iii] | 1.145(0.033) | 0.127(0.006) | 43.04 | 1.211(0.039) | 0.127(0.007) | 41.75 |
| 2.54(0.04) | 2.61(0.05) | |||||
| Å | 0.16(2.09) | -0.22(2.81) | ||||
| Table 7 – Continued | ||||||
|---|---|---|---|---|---|---|
| WC12 | WC123 | |||||
| Ion | ||||||
| 3727 [O ii] | 0.220(0.013) | 0.822(0.054) | 2.83 | 0.226(0.015) | 0.836(0.059) | 2.78 |
| 4340 H | 0.065(0.005) | 0.512(0.012) | 0.56 | 0.056(0.005) | 0.512(0.012) | 0.46 |
| 4861 H | 1.000(0.036) | 1.000(0.019) | 6.98 | 1.000(0.037) | 1.000(0.020) | 6.62 |
| 4959 [O iii] | 0.648(0.032) | 0.440(0.019) | 4.36 | 0.611(0.034) | 0.409(0.020) | 3.89 |
| 5007 [O iii] | 1.901(0.058) | 1.216(0.021) | 12.42 | 1.777(0.057) | 1.123(0.021) | 10.99 |
| 5755 [N ii] | 0.077(0.032) | 0.024(0.010) | 0.35 | 0.081(0.033) | 0.025(0.010) | 0.35 |
| 5876 He i | 0.523(0.029) | 0.149(0.008) | 2.34 | 0.541(0.032) | 0.152(0.009) | 2.29 |
| 6548 [N ii] | 8.089(0.226) | 1.469(0.050) | 33.43 | 8.530(0.247) | 1.531(0.053) | 33.17 |
| 6563 H | 18.563(0.505) | 3.428(0.116) | 76.41 | 18.750(0.531) | 3.428(0.118) | 72.68 |
| 6584 [N ii] | 24.276(0.659) | 4.306(0.147) | 99.38 | 25.597(0.722) | 4.488(0.156) | 98.76 |
| 6678 He i | 0.220(0.060) | 0.037(0.010) | 0.88 | 0.212(0.062) | 0.035(0.010) | 0.80 |
| 6717 [S ii] | 0.406(0.062) | 0.066(0.010) | 1.61 | 0.393(0.066) | 0.063(0.011) | 1.47 |
| 6731 [S ii] | 0.576(0.063) | 0.093(0.010) | 2.27 | 0.587(0.067) | 0.094(0.011) | 2.19 |
| 7065 He i | 0.229(0.051) | 0.030(0.007) | 0.85 | 0.225(0.052) | 0.029(0.007) | 0.79 |
| 7136 [Ar iii] | 0.682(0.057) | 0.085(0.008) | 2.51 | 0.653(0.059) | 0.080(0.008) | 2.27 |
| 2.11(0.05) | 2.11(0.05) | |||||
| Å | 2.09(0.14) | 2.08(0.14) | ||||
EC = East cloud, WC = West cloud, R1 = Ring 1, R2 = Ring 2, NA = Nebula A, NB = Nebula B, NC = Nebula C and NX = Nebula X
| Table 7 – Continued | ||||||
|---|---|---|---|---|---|---|
| R1 | R1+R2 | |||||
| Ion | ||||||
| 3727 [O ii] | 0.110(0.023) | 0.485(0.101) | 6.92 | 0.047(0.020) | 0.227(0.095) | 3.05 |
| 3868 [Ne iii] | 0.045(0.016) | 0.172(0.060) | 2.77 | 0.054(0.017) | 0.222(0.072) | 3.38 |
| 3889 He i+ H8 | 0.061(0.016) | 0.368(0.059) | 3.83 | 0.064(0.017) | 0.398(0.072) | 4.04 |
| 3968 [Ne iii]+ H7 | 0.050(0.013) | 0.289(0.046) | 3.29 | 0.040(0.014) | 0.270(0.052) | 2.55 |
| 4101 H | 0.070(0.007) | 0.302(0.021) | 4.45 | 0.064(0.015) | 0.303(0.046) | 4.03 |
| 4340 H | 0.224(0.016) | 0.525(0.033) | 14.35 | 0.212(0.018) | 0.521(0.038) | 13.03 |
| 4471 He i | 0.035(0.021) | 0.058(0.034) | 2.08 | – | – | – |
| 4861 H | 1.000(0.025) | 1.000(0.017) | 51.73 | 1.000(0.029) | 1.000(0.019) | 47.70 |
| 4959 [O iii] | 0.592(0.019) | 0.501(0.014) | 29.03 | 0.647(0.023) | 0.543(0.016) | 28.89 |
| 5007 [O iii] | 1.843(0.041) | 1.474(0.020) | 88.04 | 2.027(0.049) | 1.601(0.023) | 87.75 |
| 5538 [Cl iii] | 0.011(0.013) | 0.005(0.006) | 0.41 | 0.010(0.013) | 0.005(0.006) | 0.33 |
| 5876 He i | 0.590(0.020) | 0.216(0.008) | 20.74 | 0.623(0.026) | 0.214(0.010) | 19.15 |
| 6548 [N ii] | 2.953(0.064) | 0.698(0.027) | 98.60 | 3.089(0.073) | 0.669(0.030) | 86.86 |
| 6563 H | 14.465(0.297) | 3.403(0.131) | 481.54 | 15.926(0.360) | 3.431(0.152) | 445.99 |
| 6584 [N ii] | 8.859(0.183) | 2.047(0.080) | 293.91 | 9.266(0.210) | 1.959(0.088) | 258.23 |
| 6678 He i | 0.284(0.021) | 0.062(0.005) | 9.26 | 0.307(0.022) | 0.061(0.005) | 8.37 |
| 6717 [S ii] | 0.269(0.024) | 0.057(0.005) | 8.70 | 0.264(0.026) | 0.051(0.005) | 7.13 |
| 6731 [S ii] | 0.287(0.024) | 0.061(0.005) | 9.28 | 0.290(0.026) | 0.056(0.005) | 7.79 |
| 7065 He i | 0.306(0.024) | 0.052(0.005) | 9.48 | 0.347(0.022) | 0.053(0.004) | 8.73 |
| 7136 [Ar iii] | 0.609(0.028) | 0.100(0.006) | 19.15 | 0.671(0.026) | 0.098(0.006) | 16.42 |
| 2.04(0.05) | 2.17(0.06) | |||||
| Å | 2.33(0.59) | 2.20(1.20) | ||||
EC = East cloud, WC = West cloud, R1 = Ring 1, R2 = Ring 2, NA = Nebula A, NB = Nebula B, NC = Nebula C and NX = Nebula X
| Table 7 – Continued | ||||||
|---|---|---|---|---|---|---|
| NA12 | NA123 | |||||
| Ion | ||||||
| 3727 [O ii] | 0.096(0.002) | 0.398(0.011) | 16.42 | 0.090(0.003) | 0.378(0.013) | 15.40 |
| 3798 H10 | 0.003(0.003) | 0.045(0.011) | 0.54 | 0.004(0.003) | 0.041(0.013) | 0.63 |
| 3820 He i | 0.006(0.003) | 0.024(0.010) | 0.99 | 0.007(0.003) | 0.027(0.012) | 1.08 |
| 3835 H9 | 0.012(0.003) | 0.084(0.010) | 1.83 | 0.013(0.003) | 0.080(0.012) | 2.00 |
| 3868 [Ne iii] | 0.140(0.003) | 0.508(0.013) | 20.67 | 0.144(0.004) | 0.525(0.015) | 21.50 |
| 3889 He i+ H8 | 0.051(0.003) | 0.228(0.010) | 7.36 | 0.052(0.003) | 0.225(0.012) | 7.74 |
| 3968 [Ne iii]+ H7 | 0.073(0.003) | 0.284(0.009) | 10.22 | 0.077(0.003) | 0.287(0.011) | 10.85 |
| 4026 He i | 0.005(0.003) | 0.015(0.008) | 0.69 | 0.006(0.003) | 0.017(0.009) | 0.79 |
| 4101 H | 0.091(0.002) | 0.289(0.007) | 12.44 | 0.091(0.003) | 0.284(0.009) | 12.46 |
| 4340 H | 0.274(0.004) | 0.572(0.007) | 38.82 | 0.274(0.005) | 0.570(0.009) | 38.83 |
| 4363 [O iii] | 0.009(0.002) | 0.016(0.003) | 1.21 | 0.009(0.003) | 0.017(0.005) | 1.23 |
| 4387 He i | 0.002(0.003) | 0.003(0.005) | 0.22 | 0.002(0.003) | 0.005(0.006) | 0.35 |
| 4471 He i | 0.034(0.003) | 0.056(0.005) | 4.75 | 0.034(0.003) | 0.056(0.006) | 4.70 |
| 4686 He ii | 0.014(0.004) | 0.017(0.005) | 1.90 | 0.014(0.005) | 0.018(0.006) | 2.02 |
| 4713 [Ar iv]+ He i | 0.024(0.004) | 0.028(0.005) | 3.30 | 0.024(0.005) | 0.029(0.006) | 3.39 |
| 4740 [Ar iv] | 0.008(0.004) | 0.009(0.005) | 1.09 | 0.008(0.005) | 0.010(0.005) | 1.16 |
| 4861 H | 1.000(0.015) | 1.000(0.010) | 135.77 | 1.000(0.015) | 1.000(0.010) | 136.42 |
| 4921 He i | 0.012(0.003) | 0.011(0.003) | 1.65 | 0.013(0.003) | 0.012(0.003) | 1.70 |
| 4959 [O iii] | 1.908(0.028) | 1.676(0.017) | 251.16 | 1.920(0.028) | 1.691(0.017) | 254.34 |
| 5007 [O iii] | 6.038(0.088) | 5.024(0.051) | 783.03 | 6.076(0.088) | 5.069(0.052) | 793.41 |
| 5518 [Cl iii] | 0.010(0.003) | 0.005(0.001) | 1.11 | 0.010(0.003) | 0.005(0.002) | 1.11 |
| 5538 [Cl iii] | 0.008(0.003) | 0.004(0.001) | 0.90 | 0.008(0.003) | 0.004(0.002) | 0.88 |
| 5876 He i | 0.407(0.006) | 0.162(0.002) | 45.30 | 0.407(0.006) | 0.162(0.002) | 45.67 |
| 6312 [S iii] | 0.038(0.003) | 0.011(0.001) | 4.15 | 0.037(0.004) | 0.011(0.001) | 4.05 |
| 6563 H | 12.948(0.188) | 3.395(0.057) | 1358.42 | 12.902(0.187) | 3.373(0.060) | 1363.58 |
| 6584 [N ii] | 0.272(0.005) | 0.070(0.001) | 28.41 | 0.247(0.004) | 0.064(0.001) | 25.97 |
| 6678 He i | 0.192(0.004) | 0.047(0.001) | 19.74 | 0.191(0.004) | 0.047(0.001) | 19.76 |
| 6717 [S ii] | 0.056(0.003) | 0.013(0.001) | 5.70 | 0.045(0.003) | 0.011(0.001) | 4.62 |
| 6731 [S ii] | 0.048(0.003) | 0.011(0.001) | 4.86 | 0.039(0.003) | 0.009(0.001) | 3.99 |
| 7065 He i | 0.281(0.007) | 0.055(0.002) | 27.26 | 0.284(0.010) | 0.055(0.002) | 27.93 |
| 7136 [Ar iii] | 0.910(0.015) | 0.170(0.004) | 86.96 | 0.921(0.016) | 0.171(0.004) | 91.13 |
| 1.92(0.02) | 1.93(0.02) | |||||
| Å | 1.99(0.43) | 1.56(0.52) | ||||
EC = East cloud, WC = West cloud, R1 = Ring 1, R2 = Ring 2, NA = Nebula A, NB = Nebula B, NC = Nebula C and NX = Nebula X
| Table 7 – Continued | ||||||
|---|---|---|---|---|---|---|
| NB12 | NB123 | |||||
| Ion | ||||||
| 3727 [O ii] | 0.176(0.003) | 0.860(0.019) | 46.61 | 0.173(0.003) | 0.832(0.019) | 45.96 |
| 3798 H10 | 0.005(0.004) | 0.036(0.016) | 1.26 | 0.006(0.004) | 0.046(0.016) | 1.52 |
| 3820 He i | 0.003(0.004) | 0.015(0.016) | 0.79 | 0.004(0.004) | 0.016(0.016) | 0.86 |
| 3835 H9 | 0.012(0.004) | 0.069(0.015) | 2.79 | 0.012(0.004) | 0.074(0.015) | 2.81 |
| 3868 [Ne iii] | 0.131(0.004) | 0.550(0.017) | 28.85 | 0.131(0.004) | 0.543(0.017) | 29.02 |
| 3889 He i+ H8 | 0.045(0.004) | 0.203(0.015) | 9.67 | 0.044(0.004) | 0.205(0.015) | 9.53 |
| 3968 [Ne iii]+ H7 | 0.078(0.004) | 0.309(0.013) | 15.97 | 0.078(0.004) | 0.312(0.013) | 15.92 |
| 4026 He i | 0.007(0.003) | 0.025(0.011) | 1.45 | 0.007(0.003) | 0.023(0.011) | 1.38 |
| 4101 H | 0.092(0.002) | 0.300(0.006) | 18.62 | 0.090(0.002) | 0.298(0.006) | 18.08 |
| 4340 H | 0.260(0.004) | 0.572(0.008) | 54.19 | 0.259(0.004) | 0.569(0.008) | 53.65 |
| 4363 [O iii] | 0.009(0.002) | 0.018(0.004) | 1.84 | 0.008(0.002) | 0.016(0.004) | 1.60 |
| 4387 He i | 0.003(0.004) | 0.006(0.007) | 0.61 | 0.002(0.004) | 0.004(0.007) | 0.42 |
| 4471 He i | 0.032(0.004) | 0.056(0.006) | 6.52 | 0.032(0.004) | 0.056(0.006) | 6.57 |
| 4686 He ii | 0.010(0.005) | 0.013(0.007) | 2.10 | 0.010(0.005) | 0.013(0.007) | 2.14 |
| 4713 [Ar iv]+ He i | 0.016(0.005) | 0.020(0.007) | 3.25 | 0.016(0.005) | 0.019(0.007) | 3.23 |
| 4740 [Ar iv] | 0.004(0.005) | 0.005(0.006) | 0.88 | 0.004(0.005) | 0.005(0.006) | 0.89 |
| 4861 H | 1.000(0.015) | 1.000(0.010) | 195.49 | 1.000(0.015) | 1.000(0.010) | 197.02 |
| 4921 He i | 0.013(0.004) | 0.012(0.003) | 2.44 | 0.013(0.004) | 0.012(0.004) | 2.60 |
| 4959 [O iii] | 1.965(0.028) | 1.721(0.017) | 368.75 | 1.977(0.029) | 1.730(0.018) | 377.13 |
| 5007 [O iii] | 6.271(0.090) | 5.174(0.053) | 1153.32 | 6.306(0.091) | 5.200(0.053) | 1183.96 |
| 5518 [Cl iii] | 0.011(0.004) | 0.005(0.002) | 1.76 | 0.012(0.004) | 0.006(0.002) | 1.86 |
| 5538 [Cl iii] | 0.008(0.004) | 0.004(0.002) | 1.26 | 0.008(0.004) | 0.004(0.002) | 1.31 |
| 5755 [N ii] | 0.008(0.002) | 0.003(0.001) | 1.15 | 0.007(0.002) | 0.003(0.001) | 1.14 |
| 5876 He i | 0.426(0.006) | 0.156(0.002) | 63.24 | 0.427(0.006) | 0.157(0.002) | 63.98 |
| 6312 [S iii] | 0.059(0.004) | 0.016(0.001) | 8.16 | 0.058(0.004) | 0.016(0.001) | 8.03 |
| 6563 H | 14.882(0.214) | 3.419(0.058) | 1897.09 | 14.715(0.212) | 3.421(0.058) | 1888.67 |
| 6584 [N ii] | 0.711(0.011) | 0.161(0.003) | 90.28 | 0.954(0.015) | 0.219(0.004) | 121.75 |
| 6678 He i | 0.208(0.006) | 0.044(0.001) | 25.75 | 0.207(0.006) | 0.045(0.001) | 25.74 |
| 6717 [S ii] | 0.105(0.006) | 0.022(0.001) | 12.87 | 0.098(0.006) | 0.021(0.001) | 12.00 |
| 6731 [S ii] | 0.151(0.006) | 0.031(0.001) | 18.41 | 0.145(0.006) | 0.030(0.001) | 17.81 |
| 7065 He i | 0.319(0.010) | 0.053(0.002) | 35.51 | 0.321(0.010) | 0.054(0.002) | 36.05 |
| 7136 [Ar iii] | 1.143(0.019) | 0.180(0.004) | 127.06 | 1.146(0.019) | 0.184(0.004) | 128.06 |
| 2.13(0.02) | 2.11(0.02) | |||||
| Å | 1.03(0.57) | 1.49(0.57) | ||||
EC = East cloud, WC = West cloud, R1 = Ring 1, R2 = Ring 2, NA = Nebula A, NB = Nebula B, NC = Nebula C and NX = Nebula X
| Table 7 – Continued | ||||||
|---|---|---|---|---|---|---|
| NC12 | NC123 | |||||
| Ion | ||||||
| 3727 [O ii] | 0.189(0.005) | 0.997(0.029) | 75.86 | 0.183(0.005) | 0.983(0.030) | 77.01 |
| 3798 H10 | 0.012(0.003) | 0.018(0.015) | 5.31 | 0.013(0.003) | 0.003(0.016) | 5.61 |
| 3820 He i | 0.002(0.003) | 0.008(0.014) | 0.69 | 0.001(0.003) | 0.003(0.015) | 0.24 |
| 3835 H9 | 0.023(0.003) | 0.060(0.014) | 10.02 | 0.022(0.003) | 0.036(0.015) | 9.99 |
| 3868 [Ne iii] | 0.115(0.003) | 0.518(0.017) | 48.79 | 0.115(0.004) | 0.527(0.017) | 50.91 |
| 3889 He i+ H8 | 0.066(0.003) | 0.231(0.014) | 27.88 | 0.064(0.003) | 0.204(0.015) | 28.45 |
| 3968 [Ne iii]+ H7 | 0.089(0.003) | 0.300(0.013) | 36.75 | 0.091(0.003) | 0.294(0.014) | 40.08 |
| 4026 He i | 0.008(0.003) | 0.029(0.011) | 3.25 | 0.009(0.003) | 0.033(0.012) | 3.84 |
| 4101 H | 0.103(0.003) | 0.292(0.008) | 39.96 | 0.106(0.003) | 0.290(0.009) | 44.35 |
| 4340 H | 0.270(0.004) | 0.576(0.009) | 98.55 | 0.270(0.004) | 0.573(0.009) | 104.99 |
| 4363 [O iii] | 0.011(0.002) | 0.023(0.004) | 3.84 | 0.010(0.002) | 0.022(0.004) | 3.89 |
| 4387 He i | 0.003(0.003) | 0.006(0.006) | 1.04 | 0.003(0.003) | 0.007(0.007) | 1.23 |
| 4471 He i | 0.030(0.003) | 0.055(0.006) | 10.24 | 0.030(0.003) | 0.055(0.006) | 10.83 |
| 4686 He ii | 0.008(0.004) | 0.010(0.006) | 2.47 | 0.008(0.004) | 0.011(0.006) | 2.68 |
| 4713 [Ar iv]+ He i | 0.012(0.004) | 0.016(0.006) | 3.86 | 0.012(0.004) | 0.015(0.005) | 3.85 |
| 4740 [Ar iv] | 0.004(0.004) | 0.005(0.005) | 1.21 | 0.004(0.004) | 0.005(0.005) | 1.29 |
| 4861 H | 1.000(0.014) | 1.000(0.010) | 279.32 | 1.000(0.014) | 1.000(0.011) | 296.67 |
| 4921 He i | 0.016(0.003) | 0.015(0.003) | 4.30 | 0.017(0.004) | 0.016(0.003) | 4.79 |
| 4959 [O iii] | 1.864(0.027) | 1.668(0.017) | 491.44 | 1.892(0.027) | 1.705(0.017) | 534.06 |
| 5007 [O iii] | 5.960(0.085) | 5.016(0.051) | 1527.73 | 6.046(0.087) | 5.120(0.052) | 1667.31 |
| 5518 [Cl iii] | 0.011(0.003) | 0.005(0.002) | 2.27 | 0.012(0.004) | 0.006(0.002) | 2.69 |
| 5538 [Cl iii] | 0.008(0.003) | 0.004(0.002) | 1.65 | 0.009(0.004) | 0.004(0.002) | 1.85 |
| 5755 [N ii] | 0.005(0.003) | 0.002(0.001) | 0.96 | 0.004(0.003) | 0.002(0.001) | 0.84 |
| 5876 He i | 0.433(0.007) | 0.157(0.002) | 78.77 | 0.433(0.007) | 0.157(0.003) | 82.68 |
| 6312 [S iii] | 0.055(0.004) | 0.015(0.001) | 8.81 | 0.048(0.004) | 0.013(0.001) | 7.91 |
| 6563 H | 15.193(0.217) | 3.410(0.063) | 2176.27 | 15.255(0.218) | 3.407(0.065) | 2283.83 |
| 6584 [N ii] | 0.624(0.009) | 0.139(0.003) | 88.88 | 0.503(0.008) | 0.111(0.002) | 74.69 |
| 6678 He i | 0.216(0.004) | 0.045(0.001) | 29.81 | 0.216(0.004) | 0.045(0.001) | 31.02 |
| 6717 [S ii] | 0.116(0.004) | 0.023(0.001) | 15.75 | 0.094(0.004) | 0.019(0.001) | 13.30 |
| 6731 [S ii] | 0.107(0.003) | 0.022(0.001) | 14.51 | 0.091(0.004) | 0.018(0.001) | 12.74 |
| 7065 He i | 0.275(0.009) | 0.044(0.002) | 34.01 | 0.279(0.010) | 0.044(0.002) | 35.83 |
| 7136 [Ar iii] | 1.135(0.018) | 0.174(0.004) | 139.37 | 1.147(0.019) | 0.174(0.004) | 145.56 |
| 2.19(0.02) | 2.21(0.02) | |||||
| Å | -5.65(1.47) | -8.26(1.76) | ||||
EC = East cloud, WC = West cloud, R1 = Ring 1, R2 = Ring 2, NA = Nebula A, NB = Nebula B, NC = Nebula C and NX = Nebula X
| Table 7 – Continued | |||
|---|---|---|---|
| NX | |||
| Ion | |||
| 3727 [O ii] | 0.252(0.016) | 1.504(0.103) | 226.84 |
| 3835 H9 | 0.020(0.009) | 0.088(0.048) | 24.76 |
| 3868 [Ne iii] | 0.070(0.009) | 0.351(0.047) | 96.10 |
| 3889 He i+ H8 | 0.052(0.009) | 0.236(0.045) | 75.71 |
| 3968 [Ne iii]+ H7 | 0.077(0.009) | 0.323(0.041) | 119.99 |
| 4026 He i | 0.011(0.009) | 0.043(0.037) | 14.64 |
| 4101 H | 0.090(0.008) | 0.304(0.029) | 86.20 |
| 4340 H | 0.235(0.010) | 0.550(0.025) | 204.70 |
| 4363 [O iii] | 0.006(0.010) | – | – |
| 4387 He i | 0.005(0.010) | 0.011(0.021) | 4.30 |
| 4471 He i | 0.029(0.011) | 0.055(0.021) | 22.24 |
| 4861 H | 1.000(0.018) | 1.000(0.013) | 533.12 |
| 4921 He i | 0.011(0.010) | 0.010(0.009) | 5.48 |
| 4959 [O iii] | 1.543(0.026) | 1.351(0.016) | 730.27 |
| 5007 [O iii] | 4.951(0.081) | 4.055(0.044) | 2219.13 |
| 5518 [Cl iii] | 0.011(0.009) | 0.005(0.004) | 3.82 |
| 5538 [Cl iii] | 0.013(0.009) | 0.006(0.004) | 4.00 |
| 5876 He i | 0.468(0.013) | 0.155(0.005) | 133.25 |
| 6312 [S iii] | 0.065(0.011) | 0.015(0.003) | 13.52 |
| 6563 H | 17.360(0.284) | 3.410(0.105) | 3236.00 |
| 6584 [N ii] | 1.238(0.022) | 0.240(0.008) | 228.98 |
| 6678 He i | 0.245(0.011) | 0.044(0.002) | 43.75 |
| 6717 [S ii] | 0.294(0.012) | 0.052(0.003) | 51.73 |
| 6731 [S ii] | 0.239(0.012) | 0.042(0.002) | 41.80 |
| 7065 He i | 0.303(0.015) | 0.041(0.002) | 48.62 |
| 7136 [Ar iii] | 1.234(0.025) | 0.160(0.006) | 191.13 |
| 2.37(0.04) | |||
| Å | -4.80(9.26) | ||
EC = East cloud, WC = West cloud, R1 = Ring 1, R2 = Ring 2, NA = Nebula A, NB = Nebula B, NC = Nebula C and NX = Nebula X
Appendix B Tables of ionic and total nebular abundances
| Property | EC12 | EC123 | WC12 | WC123 | R1 | R1+R2 |
|---|---|---|---|---|---|---|
| (O iii) (K) (measured) | – | – | – | – | – | – |
| (N ii) (K) (measured) | 7900(700) | 7700(700) | 7500(100) | 7500(1000) | – | – |
| (O iii) (K) | 7000(600) | 6800(600) | 6400(900) | 6400(900) | 6700(2000) | 6700(2000) |
| (O ii) (K) | 7900(700) | 7700(700) | 7500(1000) | 7500(1000) | 7700(2300) | 7700(2300) |
| (S iii) (K) | 7500(700) | 7300(600) | 7000(1000) | 7000(900) | 7200(2200) | 7200(2200) |
| O+/H+ () | 9.07(4.48) | 4.81(2.64) | 13.94(10.59) | 14.10(10.40) | 7.22(11.87) | 3.38(5.69) |
| O++/H+ () | 35.45(14.33) | 38.20(15.01) | 29.81(19.82) | 27.38(17.66) | 29.59(41.84) | 32.12(45.41) |
| O/H () | 4.45(1.50) | 4.30(1.52) | 4.38(2.25) | 4.15(2.05) | 3.68(4.35) | 3.55(4.58) |
| 8.65(0.13) | 8.63(0.13) | 8.64(0.18) | 8.62(0.17) | 8.57(0.34) | 8.55(0.36) | |
| O++/O | 0.80 | 0.89 | 0.68 | 0.66 | 0.80 | 0.90 |
| N+/H+ () | 123.52(35.18) | 148.44(40.78) | 209.62(94.64) | 217.78(95.49) | 92.22(89.68) | 88.29(85.88) |
| N+/O+ () | 135.70(21.77) | 307.26(97.12) | 150.04(21.69) | 154.11(22.14) | 127.45(43.47) | 260.81(130.54) |
| 0.13(0.06) | 0.49(0.12) | 0.18(0.06) | 0.19(0.06) | 0.11(0.13) | 0.42(0.18) | |
| N/H () | 604.20(225.67) | 1321.70(627.57) | 656.42(350.27) | 639.16(329.01) | 469.15(576.92) | 925.69(1280.33) |
| 8.78(0.14) | 9.12(0.17) | 8.82(0.19) | 8.81(0.18) | 8.67(0.35) | 8.97(0.38) | |
| S+/H+ () | 6.74(1.92) | 6.54(1.82) | 8.62(4.14) | 8.48(4.03) | 5.93(5.70) | 5.38(5.18) |
| Ne++/H+ () | 21.08(11.90) | 45.73(23.93) | – | – | 15.57(28.52) | 20.16(36.84) |
| Ne++/O+ | 0.59(0.15) | 1.20(0.23) | – | – | 0.53(0.27) | 0.63(0.31) |
| -0.23(0.10) | 0.08(0.08) | – | – | -0.28(0.18) | -0.20(0.17) | |
| Ne/H () | 2.65(1.12) | 5.15(2.07) | – | – | 1.94(2.49) | 2.23(3.08) |
| 8.42(0.15) | 8.71(0.15) | – | – | 8.29(0.36) | 8.35(0.38) | |
| Ar++/H+ () | 26.32(7.35) | 28.24(7.66) | 21.65(9.80) | 20.42(9.01) | 23.24(22.19) | 22.96(21.92) |
| Ar/H () | 49.92(16.73) | 73.48(23.92) | 33.65(18.28) | 31.07(16.45) | 44.94(51.49) | 64.96(74.43) |
| 1.90 | 2.60 | 1.55 | 1.52 | 1.93 | 2.83 | |
| 6.70(0.13 | 6.87(0.12) | 6.53(0.19) | 6.49(0.18) | 6.65(0.33) | 6.81(0.33) | |
| -1.95(0.18) | -1.77(0.18) | -2.11(0.26) | -2.13(0.25) | -1.91(0.47) | -1.74(0.49) |
| Property | NA12 | NA123 | NB12 | NB123 | NC12 | NC123 | NX |
|---|---|---|---|---|---|---|---|
| (O iii) (K) (m’d) | 8300(400) | 8300(700) | 8500(400) | 8200(500) | 9100(400) | 8900(500) | – |
| (N ii) (K) (m’d) | – | – | 11500(1600) | 10100(1200) | 10400(4000) | 10500(4900) | – |
| (O iii) (K) | 8300(400) | 8300(700) | 8500(400) | 8200(500) | 9100(400) | 8900(500) | 8600(2000) |
| (O ii) (K) | 8800(500) | 8800(700) | 11500(1600) | 10100(1200) | 10400(4000) | 10500(4900) | 9000(2100) |
| (S iii) (K) | 8600(500) | 8600(700) | 8700(500) | 8500(500) | 9200(500) | 9100(500) | 8800(2100) |
| He++/H+ () | 1.34(1.34) | 1.43(1.43) | 1.10(1.10) | 1.08(1.08) | 0.85(0.85) | 0.88(0.88) | 0.00(0.00) |
| O+/H+ () | 2.78(0.75) | 2.60(1.02) | 1.78(0.94) | 3.05(1.52) | 3.17(4.98) | 3.02(5.76) | 9.49(10.40) |
| O++/H+ () | 36.99(6.65) | 36.71(11.52) | 34.89(6.82) | 40.89(9.25) | 25.64(4.47) | 27.73(5.29) | 26.32(23.02) |
| O/H () | 3.98(0.67) | 3.93(1.16) | 3.67(0.69) | 4.39(0.94) | 2.88(0.67) | 3.07(0.78) | 3.58(2.53) |
| 8.60(0.07) | 8.59(0.11) | 8.56(0.07) | 8.64(0.08) | 8.46(0.09) | 8.49(0.10) | 8.55(0.23) | |
| O++/O | 0.93 | 0.93 | 0.95 | 0.93 | 0.89 | 0.90 | 0.74 |
| N+/H+ () | 2.01(0.33) | 1.80(0.42) | 2.21(0.71) | 4.24(1.28) | 2.46(2.34) | 1.94(2.24) | 6.45(4.24) |
| N+/O+ () | 7.24(0.40) | 6.92(0.52) | 12.38(1.09) | 13.89(1.18) | 7.77(1.97) | 6.41(1.97) | 6.79(1.31) |
| -1.14(0.02) | -1.16(0.03) | -0.91(0.04) | -0.86(0.04) | -1.11(0.10) | -1.19(0.12) | -1.17(0.08) | |
| N/H () | 28.78(5.10) | 27.22(8.26) | 45.38(9.42) | 61.05(14.02) | 22.38(7.70) | 19.72(7.86) | 24.33(17.79) |
| 7.46(0.07) | 7.43(0.12) | 7.66(0.08) | 7.79(0.09) | 7.35(0.13) | 7.29(0.15) | 7.39(0.24) | |
| S+/H+ () | 0.81(0.15) | 0.65(0.16) | 0.87(0.28) | 1.16(0.35) | 0.95(0.88) | 0.77(0.87) | 2.89(1.88) |
| S++/H+ () | 59.74(17.75) | 56.78(23.36) | 76.53(21.75) | 88.22(26.47) | 52.67(13.60) | 48.52(12.87) | 70.18(78.97) |
| 3.21(0.22) | 3.35(0.23) | 4.30(0.33) | 3.23(0.22) | 2.28(0.13) | 2.48(0.15) | 1.41(0.04) | |
| S/H () | 194.28(22.22) | 192.13(26.96) | 333.10(33.57) | 288.25(33.11) | 122.42(15.27) | 122.03(14.81) | 102.67(79.05) |
| 7.29(0.05) | 7.28(0.06) | 7.52(0.04) | 7.46(0.05) | 7.09(0.05) | 7.09(0.05) | 7.01(0.25) | |
| S/O | 4.89(0.99) | 4.89(1.59) | 9.08(1.94) | 6.56(1.59) | 4.25(1.12) | 3.97(1.12) | 2.87(2.99) |
| -1.31(0.08) | -1.31(0.12) | -1.04(0.08) | -1.18(0.09) | -1.37(0.10) | -1.40(0.11) | -1.54(0.31) | |
| Ne++/H+ () | 13.65(3.12) | 13.84(5.51) | 13.30(3.31) | 15.82(4.56) | 8.96(1.99) | 9.77(2.38) | 8.10(9.03) |
| Ne++/O+ | 0.37(0.02) | 0.38(0.03) | 0.38(0.02) | 0.39(0.03) | 0.35(0.02) | 0.35(0.02) | 0.31(0.08) |
| -0.43(0.02) | -0.42(0.04) | -0.42(0.03) | -0.41(0.03) | -0.46(0.02) | -0.45(0.03) | -0.51(0.10) | |
| Ne/H () | 1.47(0.26) | 1.48(0.45) | 1.40(0.28) | 1.70(0.38) | 1.01(0.24) | 1.08(0.28) | 1.10(0.83) |
| 8.17(0.07) | 8.17(0.12) | 8.15(0.08) | 8.23(0.09) | 8.00(0.09) | 8.03(0.10) | 8.04(0.24) | |
| Ar++/H+ () | 23.58(3.77) | 23.56(5.27) | 23.89(3.71) | 26.45(4.33) | 19.73(2.77) | 20.46(2.94) | 20.74(12.96) |
| Ar+++/H+ () | 3.75(2.05) | 3.94(2.58) | 1.99(2.53) | 2.29(2.90) | 1.44(1.64) | 1.54(1.70) | – |
| Ar/H () | 27.59(4.33) | 27.75(5.92) | 26.09(4.53) | 29.00(5.26) | 21.47(3.27) | 22.26(3.44) | 34.68(26.01) |
| 1.01 | 1.01 | 1.01 | 1.01 | 1.01 | 1.01 | 1.67 | |
| 6.44(0.06) | 6.44(0.08) | 6.42(0.07) | 6.46(0.07) | 6.33(0.06) | 6.35(0.06) | 6.54(0.24) | |
| -2.16(0.09) | -2.15(0.14) | -2.15(0.10) | -2.18(0.11) | -2.13(0.11) | -2.14(0.12) | -2.01(0.34) |