The Overdense Environment of a Large L Nebula at 2.711affiliation: Based on data collected at Subaru Telescope, which is operated by the National Astronomical Observatory of Japan. 22affiliation: Based in part on observations obtained at Kitt Peak National Observatory, a division of the National Optical Astronomy Observatories, which is operated by the Association of Universities for Research in Astronomy, Inc. under cooperative agreement with the National Science Foundation.
Abstract
Large nebulae (50 kpc) emitting strongly in Ly (also known as Ly “blobs”) are likely signposts of ongoing massive galaxy formation. The relative rarity of these sources and their discovery in well-studied galaxy overdensities suggest that they may be associated with regions of high galaxy density. One of the largest Ly nebulae, discovered at a redshift of 2.7 via its strong mid-infrared emission, provides an unbiased test of this association. We have carried out a deep intermediate-band imaging survey for Ly-emitting galaxies (LAEs) within a 30′26′ field of view around this Ly nebula. This is the first study of the environment of a Ly nebula found without a priori knowledge of its surroundings. We find that the nebula is located in an overdense region, at least 2050 h comoving Mpc in size, showing a factor of 3 LAE number density enhancement relative to the edge of the field. Given the predicted number of such overdensities, we rule out the possibility of a chance coincidence at the 1% level. This study, in conjunction with previous work, provides strong confirmation of the association between the largest Ly nebulae and overdense regions of the Universe.
Subject headings:
galaxies: formation — galaxies: high-redshift — large-scale structure of universe1. Introduction
Studies of massive galaxy populations show that the most massive galaxies are in place and in possession of the majority of their stellar mass by (McCarthy et al., 2004; van Dokkum et al., 2004; Daddi et al., 2005; Bundy et al., 2005; Brown et al., 2007). Thus, while dark matter halos in a CDM cosmology build up hierarchically with the gradual accretion and merging of smaller halos, the most massive galaxies within that context likely have more dramatic origins. The details of this process are uncertain, and ideally we would like to study sites of ongoing massive galaxy formation. Ly nebulae or Ly “blobs” (LABs) – large (50 kpc) clouds of gas emitting strongly in Ly ( erg s-1) – provide such an opportunity. The large Ly equivalent widths and the association with galaxy populations such as Lyman break galaxies (LBGs) and submillimeter galaxies (SMGs) strongly suggest that LABs are sites of ongoing galaxy formation. They have been found in small numbers (only 16 50 kpc LABs are known) around 2-3, a key epoch of black hole and galaxy growth (Steidel et al. 2000, hereafter S00; Francis et al. 2001; Palunas et al. 2004; Matsuda et al. 2004; Dey et al. 2005; Nilsson et al. 2006; Smith & Jarvis 2007; Greve et al. 2007). LABs span a range in size and surface brightness from the scales of Ly-emitting galaxies (LAEs) to the largest LABs known (150 kpc, 27 mag arcsec-2; e.g., Matsuda et al., 2004). LABs are similar to the large Ly halos observed in the overdensities around higher redshift radio galaxies (e.g., Venemans et al., 2007; Overzier et al., 2008) but are found in radio quiet environments. The dominant power source in LABs is difficult to determine; among the limited sample of large LABs, there is evidence for embedded AGN, starburst-driven superwinds, gravitational cooling radiation, and spatially-extended star formation, all of which may play a role in powering the Ly emission (Prescott et al. 2008, in preparation; S00; Chapman et al. 2004; Nilsson et al. 2006; Taniguchi & Shioya 2000; Matsuda et al. 2004; Dey et al. 2005; Matsuda et al. 2007).
Most known LABs, including two of the largest cases, have been discovered via narrow-band surveys, often by targeting known galaxy overdensities (S00; Francis et al. 2001; Palunas et al. 2004; Matsuda et al. 2004). Follow-up narrow-band imaging of the SSA22 region surrounding the S00 LABs revealed fainter LABs associated with the same overdensity traced by the LAEs (Matsuda et al., 2004). This suggests that LABs may be confined to overdense regions, as would be expected for sites of massive galaxy formation. A blank field survey by Saito et al. (2006) supported this claim, finding no LABs with sizes greater than 30 kpc and an order of magnitude lower number density of LABs relative to that found within the SSA22 galaxy overdensity. However, the association between LABs and galaxy overdensities may be misleading, as a truely systematic wide-area search has yet to be completed. A thorough environmental study has only been done for the S00 LABs, which were found by targeting a known galaxy overdensity.
In contrast, one of the largest LABs uncovered recently was found by entirely different means. While conducting a study of mid-infrared (24m) sources detected by the Spitzer Space Telescope, Dey et al. (2005) discovered a LAB at within the NOAO Deep Wide-Field Survey Boötes field (NDWFS111This research draws upon data provided by Dr. Buell Jannuzi and Dr. Arjun Dey as distributed by the NOAO Science Archive.; Jannuzi & Dey, 1999). Follow-up observations revealed complexity typical of the LAB class: the region hosts a buried AGN, many young galaxies, an LBG, and diffuse HeII and continuum emission suggestive of spatially-extended star formation (Prescott et al. 2008, in preparation). One of the largest and most luminous LABs known, and found without any a priori knowledge of its surroundings, this source represents a unique opportunity to perform an unbiased, complementary test of the association between LABs and overdense regions.
In this work, we present the first results from an ongoing deep intermediate-band Ly imaging survey of the environment of the Dey et al. (2005) LAB (hereafter, LABd05) and report on the spatial distribution of the LAEs in the immediate vicinity. A detailed analysis of the multiwavelength properties of LABd05 and the properties and clustering of the LAEs in the region will be presented by Prescott et al. (2008, in preparation). We assume the standard CDM cosmology (=0.3, =0.7, =0.7); the angular scale at is 7.96 kpc/″. All magnitudes are in the AB system.
2. Observations & Reductions
We obtained deep imaging of the field around LABd05 using the Subaru telescope and the SuprimeCam imager (Miyazaki et al., 2002) on U.T. 2007 May 10-14 and June 17. The survey covers 0.22 deg2 in an intermediate-band filter, IA445 (4458Å, 201Å), centered on the Ly line at the redshift of the nebula; this corresponds to a comoving volume of 4.27105 h Mpc3 (5245180 h Mpc). Conditions during the May observations were variable (clouds, variable seeing 0.7″-1.2″) and good in June (clear with 0.7″ seeing). We obtained a total of 3 hours of observations.
We reduced the data using the SDFRED software (Yagi et al., 2002; Ouchi et al., 2004). The data were overscan-subtracted and corrected for geometric and atmospheric distortions. We generated the sky flat using object frames that were free of bright stars in combination with other images taken in the same intermediate-band filter (Y. Taniguchi, private communication). Small portions of the SuprimeCam field of view are vignetted by the autoguider probe; the affected areas were masked, as were bad columns, bright star ghosts, and satellite trails. Images were aligned and scaled using common stars and then combined using a clipped mean algorithm, which successfully removed cosmic rays. Of the SuprimeCam field-of-view (0.26 deg2), 73% was usable (the remainder being of lower signal-to-noise along the edge of the field or in the vicinity of bright stars).
The limiting magnitude of the stacked image is 28.3 AB mag (1, 2″ diameter aperture), calculated using 10,000 random apertures. An approximate magnitude zeropoint was calculated from observations of the standard stars BD+25d4655 and Feige 34. For the NDWFS broad-band imaging, the limiting magnitudes are limit=27.9 mag, =27.1 mag, =26.0 mag (1, 2″ diameter aperture).
A portion of the field was observed in a custom -band filter (; 3590Å, 116Å) using the Mayall 4m Telescope over 6 nights (U.T. 2007 June 8-13). These data will be described elsewhere (Prescott et al. 2008, in preparation) but here provide a useful check on interlopers in our LAE sample.
3. Candidate Selection
We used Source Extractor (Bertin & Arnouts, 1996) to select a sample of 38,600 sources detected in the band down to the 5 limit of =26.5 mag (2″ diameter aperture; ()=1.51042 erg s-1) with the following search parameters: at least 5 contiguous pixels, a threshold of 2 per pixel, and a Gaussian filter matched to the seeing (FWHM0.8 arcsec). We measured matched aperture photometry using 2″ diameter apertures from the , , , and imaging datasets, which were registered and resampled to match the astrometry and pixel scale (0.258 arcsec/pix). Aperture corrections were neglected (1.08 for an unresolved source). Line-emitting sources are strongly detected in relative to , i.e., they have large negative colors relative to the normal galaxy locus (see Figure 1). We removed bright stars () using the CLASS_STAR parameter in Source Extractor (0.91) and employed a cut of 0.85 mag yielding 1500 candidates. Shifting the cut by 0.2 mag causes no significant change to the main results presented in Section 4. For a continuum source, this corresponds to an observed equivalent width (EW) cut of 148 Å. LAEs are known to be young, with estimated ages of 4-200 Myr (Finkelstein et al., 2007; Lai et al., 2007; Gawiser et al., 2007). For the case of a young galaxy (25 Myr old simple stellar population, solar metallicity, Chabrier IMF; Bruzual & Charlot, 2003; Tremonti et al., 2004) at with standard intergalactic absorption (Madau, 1995), this is equivalent to a rest-frame EW cut of 50Å.
We expect our LAE candidate sample to be contaminated by high EW, low-redshift [OII]3727,3729-emitting galaxies at . Since the bandpass lies on the red side of the filter (Figure 1, see inset), we also expect contamination from higher redshift galaxies () for which the Lyman limit has entered the filter, thus depressing the flux relative to the flux. Using the publicly available NDWFS imaging (Jannuzi & Dey, 1999), we employ a cut of 0.8 to remove both contaminant populations (see Figure 2). The final sample of 785 LAE candidates corresponds to a mean LAE surface density of 4200 deg-2. The properties and sizes of the LAE sample will be discussed in an upcoming paper (Prescott et al. 2008, in preparation). There are no other large (50 kpc) LABs in the vicinity of LABd05.
Sources at these redshifts should show very little flux in the -band, which straddles the Lyman limit (970-1000Å at ). Using the 25 Myr old model above to represent the typical LAE continuum shape, the galaxy luminosity function from Reddy et al. (2007), and standard intergalactic absorption (Madau, 1995), we predict that 1-2% of the LAE sample should have detected at the 5 level (=25.3). Only 1 LAE candidate (1%) is detected with 25.3, giving us confidence that we have selected a clean sample of LAEs. More sophisticated interloper rejection would require deeper imaging over the entire field.
4. Results and Discussion
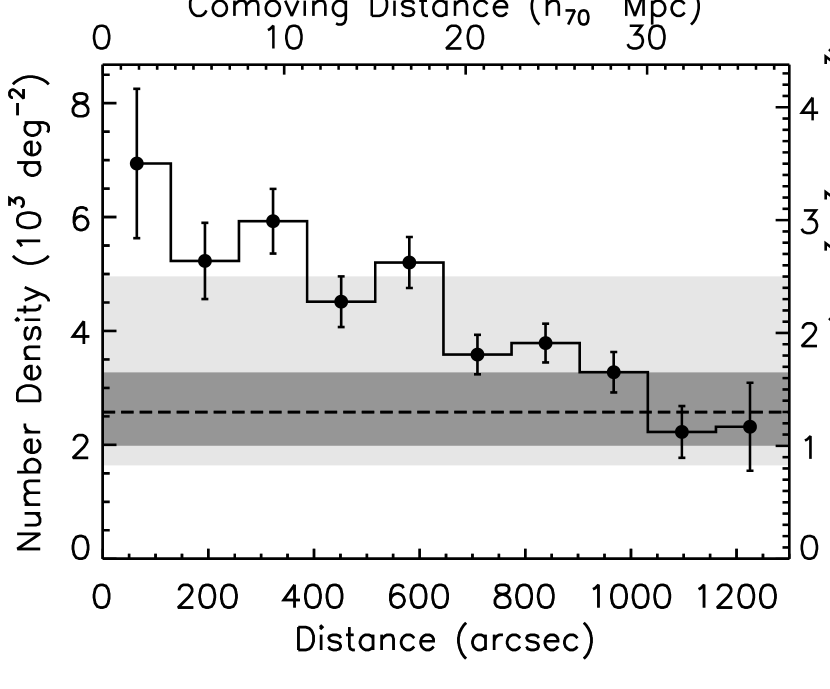
Figure 3 shows the spatial distribution of LAEs in the vicinity of LABd05. We find an overabundance of LAEs in the immediate vicinity of the LAB and clear evidence of an elongated overdense structure, with what appears to be a 10 h Mpc underdensity at [218.36,33.07]. In Figure 4, we plot the surface density of LAEs versus distance from LABd05. This shows a peak overdensity of a factor of 3.0 relative to the edge of the field, or a factor of 2.6 when averaged over the central 10 h Mpc radius. For comparison, the dashed line shows the expected LAE surface density estimated from the luminosity functions of Gronwall et al. (2007) and Ouchi et al. (2007) assuming a uniform redshift distribution across our bandpass and no evolution. The overdensity spans at least 1747 h Mpc (comoving). A study of the LAE population around the two S00 LABs, which are of comparable size and luminosity to LABd05, also found a factor of 3 overdensity relative to the field that was 60 Mpc across (Hayashino et al., 2004). Thus, although it was found without any a priori knowledge of its surroundings, LABd05 appears to reside in a similarly overdense environment.
Without follow-up spectroscopy, we cannot know the true redshift distribution of the sample within the intermediate-band filter. Assuming a uniform distribution across the filter ( 0.17, 180 h Mpc, comoving, along the line-of-sight), our survey yields a mean number density of 2.110-3 h Mpc-3 for LAEs with 1.51042 erg s-1 cm-2. The inner contour in Figure 3 corresponds to 2.810-3 h Mpc-3 while at the edge of the field 1.210-3 h Mpc-3. Given the presence of an overdensity, we expect the true redshift distribution to be significantly narrower. If we assume the overdensity resembles that hosting the S00 LABs, which extends 40 h Mpc comoving (22% of the filter width) along the line-of-sight (Matsuda et al., 2005), and that it is centered within the filter, the inner contour corresponds to a number density of 1210-3 h Mpc-3. Alternately, if the structure is cylindrical in shape with a radius of 10 h Mpc, the corresponding number density at the inner contour is 2510-3 h Mpc-3.
We estimate the expected frequency of such overdense structures using the galaxy catalog of Bower et al. (2006), which is based on the Millennium Simulation (Springel et al., 2005). We approximate our observational set-up by sampling the simulation volume randomly with cylinders that are 10 h Mpc in radius (the size of the overdensity peak) and 180 h Mpc in depth (the full span of the filter). We assumed a Ly/H ratio of 10 (Osterbrock, 1989) and scaled from the predicted H luminosity to select model LAE galaxies down to the Ly limit of our observations (under the assumption that Ly dominates the measured flux) at a redshift of . The number density of model LAEs in this case is 10.810-3 h Mpc-3, which is a factor of 5 higher than the mean density we observe. Taken at face value, this could imply that LAEs have a duty cycle of 20% or that they are a younger, less massive subset of this population. If we restrict the model galaxies to be younger than the sample’s median age (172 Myr) and less massive than the median stellar mass (9108 ), the number density of model LAEs is 3.510-3 h Mpc-3. In either case, we uncover overdensities of greater than a factor of 2 at a rate of 0.3%. Therefore, within the large span of our filter, which will tend to average out inhomogeneities and reduce the signal, our imaging survey had only a 0.3% chance of randomly uncovering such an overdense region if LABs and overdensities are independent phenomena. The space density of large Ly nebulae is very uncertain, but at the high end is the range quoted for the S00 Ly nebulae; 3-40010-6 Mpc-3 (Saito et al., 2006). Taking these values (equivalent to a 17-100% chance of finding one large LAB within the peak of the overdensity), the likelihood of a chance coincidence between a factor of 2 overdensity and a large Ly nebulae would be 0.05-0.3%. Preliminary results from more recent systematic Ly nebulae surveys hint that their true space density may be orders of magnitude lower (e.g., Prescott et al. 2008, in preparation), making the likelihood of chance coincidence vanishingly small.
In terms of the relevant emission mechanisms the Ly nebula class appears to be a highly heterogeneous mix, and this diversity could in principle derive from environmental differences. The largest Ly nebulae (100 kpc), including the case studied here, often show evidence for obscured AGN and extended star formation (e.g., Matsuda et al., 2007; Basu-Zych & Scharf, 2004, Prescott et al. 2008, in preparation) and have received the most scrutiny in terms of their properties and environments. Presumably, the somewhat smaller “cooling” LABs (e.g., Nilsson et al., 2006; Smith & Jarvis, 2007) must also reside in dense regions with sufficient gas supply, but thorough environmental studies of these sources have, to our knowledge, not yet been completed.
5. Conclusions
The discovery of a large Ly nebula at via its strong mid-infrared emission has provided an unbiased test of the association between these rare sources and galaxy overdensities. Using deep Ly imaging of the environment surrounding this LAB, we identify 785 LAE candidates and find evidence for a factor of 3 LAE overdensity which spans 2050 Mpc (comoving). This is comparable to what is found in the vicinity of the well-known S00 Ly nebulae. We rule out a chance coincidence at the 1% level. In conjunction with previous work, these results point conclusively to a strong association between the largest Ly nebulae and overdense regions of the Universe.
References
- Basu-Zych & Scharf (2004) Basu-Zych, A., & Scharf, C. 2004, ApJ, 615, L85
- Bertin & Arnouts (1996) Bertin, E., & Arnouts, S. 1996, A&AS, 117, 393
- Bower et al. (2006) Bower, R. G., Benson, A. J., Malbon, R., Helly, J. C., Frenk, C. S., Baugh, C. M., Cole, S., & Lacey, C. G. 2006, MNRAS, 370, 645
- Brown et al. (2007) Brown, M. J. I., Dey, A., Jannuzi, B. T., Brand, K., Benson, A. J., Brodwin, M., Croton, D. J., & Eisenhardt, P. R. 2007, ApJ, 654, 858
- Bruzual & Charlot (2003) Bruzual, G., & Charlot, S. 2003, MNRAS, 344, 1000
- Bundy et al. (2005) Bundy, K., Ellis, R. S., & Conselice, C. J. 2005, ApJ, 625, 621
- Chapman et al. (2004) Chapman, S. C., Scott, D., Windhorst, R. A., Frayer, D. T., Borys, C., Lewis, G. F., & Ivison, R. J. 2004, ApJ, 606, 85
- Daddi et al. (2005) Daddi, E., et al. 2005, ApJ, 626, 680
- Dey et al. (2005) Dey, A., et al. 2005, ApJ, 629, 654
- Finkelstein et al. (2007) Finkelstein, S. L., Rhoads, J. E., Malhotra, S., Pirzkal, N., & Wang, J. 2007, ApJ, 660, 1023
- Francis et al. (2001) Francis, P. J., et al. 2001, ApJ, 554, 1001
- Gawiser et al. (2007) Gawiser, E., et al. 2007, ApJ, 671, 278
- Greve et al. (2007) Greve, T. R., Stern, D., Ivison, R. J., De Breuck, C., Kovács, A., & Bertoldi, F. 2007, MNRAS, 382, 48
- Gronwall et al. (2007) Gronwall, C., et al. 2007, ApJ, 667, 79
- Hayashino et al. (2004) Hayashino, T., et al. 2004, AJ, 128, 2073
- Jannuzi & Dey (1999) Jannuzi, B. T. & Dey, A. 1999, in “Photometric Redshifts and the Detection of High Redshift Galaxies”, ASP Conference Series, Vol. 191, Edited by R. Weymann, L. Storrie-Lombardi, M. Sawicki, and R. Brunner. ISBN: 158381-017-X, p. 111
- Lai et al. (2007) Lai, K., et al. 2007, ArXiv e-prints, 710, arXiv:0710.3384
- Leitherer et al. (1996) Leitherer et al. 1996, PASP, 108, 996
- Madau (1995) Madau 1995, ApJ, 441, 18
- Matsuda et al. (2004) Matsuda, Y., et al. 2004, AJ, 128, 569
- Matsuda et al. (2005) Matsuda, Y., et al. 2005, ApJ, 634, 125
- Matsuda et al. (2007) Matsuda, Y., Iono, D., Ohta, K., Yamada, T., Kawabe, R., Hayashino, T., Peck, A. B., & Petitpas, G. R. 2007, ApJ, 667, 667
- McCarthy et al. (2004) McCarthy, P. J., et al. 2004, ApJ, 614, L9
- Miyazaki et al. (2002) Miyazaki, S., et al. 2002, PASJ, 54, 833
- Nilsson et al. (2006) Nilsson, K. K., Fynbo, J. P. U., Møller, P., Sommer-Larsen, J., & Ledoux, C. 2006, A&A, 452, L23
- Osterbrock (1989) Osterbrock, D. E. 1989, Research supported by the University of California, John Simon Guggenheim Memorial Foundation, University of Minnesota, et al. Mill Valley, CA, University Science Books, 1989, 422 p.
- Ouchi et al. (2004) Ouchi, M., et al. 2004, ApJ, 611, 660
- Ouchi et al. (2007) Ouchi, M., et al. 2007, ArXiv e-prints, 707, arXiv:0707.3161
- Overzier et al. (2008) Overzier, R. A., et al. 2008, ApJ, 673, 143
- Palunas et al. (2004) Palunas, P., Teplitz, H. I., Francis, P. J., Williger, G. M., & Woodgate, B. E. 2004, ApJ, 602, 545
- Reddy et al. (2007) Reddy, N. A., Steidel, C. C., Pettini, M., Adelberger, K. L., Shapley, A. E., Erb, D. K., & Dickinson, M. 2007, ArXiv e-prints, 706, arXiv:0706.4091
- Saito et al. (2006) Saito, T., Shimasaku, K., Okamura, S., Ouchi, M., Akiyama, M., & Yoshida, M. 2006, ApJ, 648, 54
- Smith & Jarvis (2007) Smith, D. J. B., & Jarvis, M. J. 2007, MNRAS, 378, L49
- Springel et al. (2005) Springel, V., et al. 2005, Nature, 435, 629
- Steidel et al. (2000) Steidel, C. C., Adelberger, K. L., Shapley, A. E., Pettini, M., Dickinson, M., & Giavalisco, M. 2000, ApJ, 532, 170
- Taniguchi & Shioya (2000) Taniguchi, Y., & Shioya, Y. 2000, ApJ, 532, L13
- Tremonti et al. (2004) Tremonti, C. A., et al. 2004, ApJ, 613, 898
- van Dokkum et al. (2004) van Dokkum, P. G., et al. 2004, ApJ, 611, 703
- Venemans et al. (2007) Venemans, B. P., et al. 2007, A&A, 461, 823
- Yagi et al. (2002) Yagi, M., Kashikawa, N., Sekiguchi, M., Doi, M., Yasuda, N., Shimasaku, K., & Okamura, S. 2002, AJ, 123, 66