11email: kohnaka@mpifr-bonn.mpg.de 22institutetext: European Southern Observatory, Karl-Schwarzschild-Str. 2, 85748 Garching, Germany
Spatially resolved dusty torus toward the red supergiant WOH G64 in the Large Magellanic Cloud ††thanks: Based on observations made with the Very Large Telescope Interferometer of the European Southern Observatory. Program ID: 076.D-0253, 080.D-0222 ,††thanks: This work is based [in part] on observations made with the Spitzer Space Telescope, which is operated by the Jet Propulsion Laboratory, California Institute of Technology under a contract with NASA.
Abstract
Aims. We present -band spectro-interferometric observations of the red supergiant WOH G64 in the Large Magellanic Cloud (LMC) using MIDI at the Very Large Telescope Interferometer (VLTI). While the very high luminosity ( ) previously estimated for WOH G64 suggests that it is a very massive star with an initial mass of 40 , its low effective temperature (3200 K) is in serious disagreement with the current stellar evolution theory.
Methods. WOH G64 was observed with VLTI/MIDI using the UT2-UT3 and UT3-UT4 baseline configurations.
Results. The dust envelope around WOH G64 has been spatially resolved with a baseline of 60 m—the first MIDI observations to resolve an individual stellar source in an extragalactic system. The observed -band visibilities show a slight decrease from 8 to 10 m and a gradual increase longward of 10 m, reflecting the 10 m silicate feature in self-absorption. This translates into a steep increase of the uniform-disk diameter from 8 to 10 m (from 18 to 26 mas) and a roughly constant diameter above 10 m. The visibilities measured at four position angles differing by 60° but at approximately the same baseline length (60 m) do not show a noticeable difference, suggesting that the object appears nearly centrosymmetric. The observed -band visibilities and spectral energy distribution can be reproduced by an optically and geometrically thick silicate torus model viewed close to pole-on. The luminosity of the central star is derived to be , which is by a factor of 2 lower than the previous estimates based on spherical models. We also identify the H2O absorption features at 2.7 and 6 m in the spectra obtained with the Infrared Space Observatory and the Spitzer Space Telescope. The 2.7 m feature originates in the photosphere and/or the extended molecular layers, while the 6 m feature is likely to be of circumstellar origin.
Conclusions. The lower luminosity newly derived from our MIDI observations and two-dimensional modeling brings the location of WOH G64 on the H-R diagram in much better agreement with theoretical evolutionary tracks for a 25 star. However, the effective temperature is still somewhat too cool compared to the theory. The low effective temperature of WOH G64 places it very close to or even beyond the Hayashi limit, which implies that this object may be experiencing unstable, violent mass loss.
Key Words.:
infrared: stars – techniques: interferometric – stars: supergiants – stars: late-type – stars: circumstellar matter – stars: individual: WOH G641 Introduction
The evolution of massive () red supergiants (RSGs) is not well understood, because of several physical processes difficult to theoretically formulate, such as mass loss, convective mixing, and rotation (e.g., Massey massey03 (2003)). Comparison of theoretical evolutionary tracks for RSGs with observational data is crucial for testing the present theory of the evolution of massive stars. While it is usually difficult to reliably derive the luminosities of Galactic RSGs, their counterparts in the Large and Small Magellanic Clouds (LMC and SMC, respectively) provide us with an excellent opportunity to compare theory and observation on the H-R diagram, thanks to their known distances (50 and 60 kpc for the LMC and SMC, respectively). Another advantage of studying RSGs in the LMC and SMC is that we can probe possible metallicity effects on the mass loss, because the metallicities of the LMC and SMC are systematically lower than the solar value ( and for the LMC and SMC, respectively). Although radiation pressure on dust grains is often considered to be the driving mechanism of mass loss in cool evolved stars, it is little understood where and how dust forms in RSGs and how mass outflows are initiated. Since dust formation is expected to depend on metallicity, studies on the circumstellar environment of RSGs in the LMC and SMC are useful for clarifying the metallicity effect on the dust formation and obtaining insights into the driving mechanism of mass outflows.
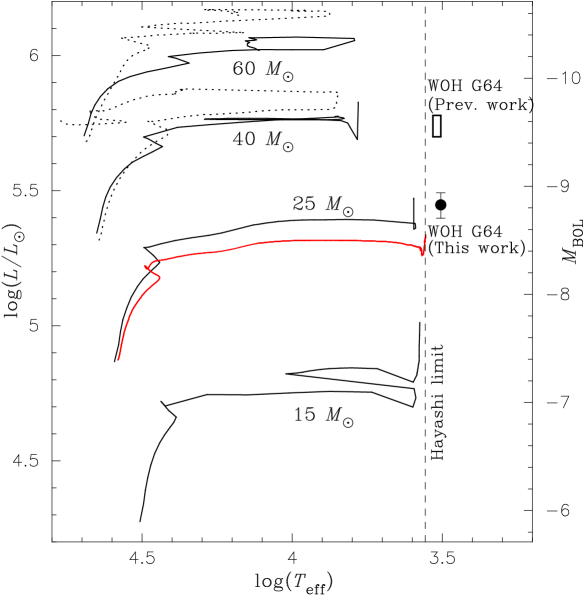
WOH G64 (IRAS04553-6825) is a highly luminous cool star in the LMC first identified by Westerlund et al. (westerlund81 (1981)). Subsequent infrared observations by Elias et al. (elias86 (1986)) and Roche et al. (roche93 (1993)) revealed that it exhibits a huge infrared excess and the 10 m silicate feature in self-absorption, which means that the object is surrounded by an optically thick dust envelope, experiencing heavy mass loss. WOH G64 is also known to show OH, SiO, and H2O masers (Wood et al. wood86 (1986), wood92 (1992); van Loon et al. vanloon96 (1996), vanloon98 (1998), vanloon01 (2001); Marshall et al. marshall04 (2004)). The spectroscopic studies on the TiO absorption bands suggest spectral types of M5–M7 (Elias et al. elias86 (1986); Van Loon et al. vanloon05 (2005)), which corresponds to effective temperatures of 3200–3400 K (see Sect. 3). Elias et al. (elias86 (1986)) and van Loon et al. (vanloon05 (2005)) derived bolometric magnitudes of ( ) and ( ), respectively, assuming spherical dust shells. Figure 1 shows an H-R diagram with the evolutionary models for of Schaerer et al. (schaerer93 (1993)). For comparison, we also plot the evolutionary track for a 25 star with newly computed with another evolutionary code (author: T. Driebe), which is based on the program of Blöcker (bloecker95 (1995)). The convective overshoot is included as described in Herwig et al. (herwig97 (1997)) and Herwig (herwig00 (2000)) with an overshoot parameter of , and the mass loss is incorporated by using the formula of de Jager et al. (dejager88 (1988)) from the zero-age main sequence. Figure 1 suggests that a star with an initial mass of 40 can reach the high luminosities observationally derived for WOH G64. However, the evolutionary models predict that a 40 star evolves only down to 6300 K and does not reach the low effective temperatures of 3200–3400 K observed for WOH G64. Therefore, the location of WOH G64 on the H-R diagram is in serious disagreement with theory.
It is worth noting here that Roche et al. (roche93 (1993)) and van Loon et al. (vanloon99 (1999)) suggest a disk-like or clumpy structure for the dust envelope of WOH G64. Van Loon et al. (vanloon99 (1999)) attempted to reproduce the observed spectral energy distribution (SED) with a spherical dust shell model, but could not find a reasonable fit. The reason is that the huge mid- and far-infrared excess indicates a large optical depth for the dust shell, which would lead to very low flux in the near-infrared and in the visible. However, the observed SED of WOH G64 shows high fluxes at these wavelengths. The possible presence of a disk-like or clumpy structure makes the above luminosity estimates assuming spherical dust shells uncertain. If there is indeed such a deviation from spherical symmetry, the luminosity of the central star can only be estimated from multi-dimensional radiative transfer modeling using as many observational constraints as possible. Therefore, observational studies on the disk-like/clumpy structure in WOH G64 is important both for deriving the luminosity of the central star and for a better understanding of the mass loss in RSGs in the LMC.
High spatial resolution observations in the mid-infrared are a powerful tool to obtain a clearer picture of the circumstellar environment of RSGs. The MID-infrared Interferometric instrument (MIDI) at the Very Large Telescope Interferometer (VLTI) is ideal for this goal with its “spectro-interferometric” capability and has already proven its potential to study the circumstellar environment of cool (and also hot) evolved stars. However, such studies on stellar sources with MIDI are limited to Galactic objects up to now. Despite the large distance to the LMC (50 kpc is adopted in the present work), the high luminosity of WOH G64 and its huge infrared excess make it observable with MIDI ( Jy). In this paper, we present MIDI observations of WOH G64 and radiative transfer modeling to derive the physical properties of its dust envelope as well as the luminosity of the star.
2 Observations
| # | Night | Tel. | P.A. | Seeing | Remarks | ||
|---|---|---|---|---|---|---|---|
| (UTC) | (m) | (°) | |||||
| 1 | 2005 Sep. 18 | 08:18:03 | UT3-UT4 | 57.9 | 85.7 | 15 | Spectrum only |
| 2 | 2005 Nov. 12 | 08:22:17 | UT3-UT4 | 62.4 | 136.0 | 05–07 | |
| 3 | 2005 Nov. 13 | 08:23:15 | UT2-UT3 | 33.9 | 77.7 | 06 | Spectrum only |
| 4 | 2007 Oct. 22 | 05:30:49 | UT3-UT4 | 56.5 | 77.3 | 10–15 | |
| 5 | 2007 Oct. 22 | 06:36:17 | UT3-UT4 | 59.0 | 92.7 | 10–15 | |
| 6 | 2007 Oct. 22 | 07:41:05 | UT3-UT4 | 60.8 | 107.5 | 10–15 |
2.1 -band visibilities
WOH G64 was observed with MIDI in the HIGH_SENS mode in September and November 2005 as well as in October 2007 with two baseline configurations using the 8.2 m Unit Telescopes (UT2-UT3 and UT3-UT4), as summarized in Table LABEL:table_obs (Program ID: 076-D0253 and 080-D0222, P.I.: K. Ohnaka). A prism with a spectral resolution of at 10 m was used to obtain spectrally dispersed fringes between 8 and 13 m, and each data set contains typically 200 scans. A detailed description of the observing procedure is given in Przygodda et al. (przygodda03 (2003)), Leinert et al. (leinert04 (2004)), and Chesneau et al. (chesneau05 (2005)). Since WOH G64 itself is too faint in the band () for the Multi-Application Curvature sensing Adaptive Optics (MACAO) system, we performed “off-target Coudé guiding” using the nearby star 0216-0046676 (USNO-B1.0 catalog) with = 16, which is 106 away from WOH G64. In addition to MACAO, the InfraRed Image Sensor (IRIS) operating in the band was used to keep the alignment of two beams as correct as possible during interferometric observations.
For data reduction, we use the MIA+EWS package ver.1.5111Available at http://www.strw.leidenuniv.nl/~nevec/MIDI (Leinert et al. leinert04 (2004); Jaffe jaffe04 (2004)). Since the magnitude of the guide star is close to the limit of the MACAO system on UTs ( = 17), our MIDI observations can be severely affected by atmospheric conditions such as seeing, wind speed, and coherence time. In order to assess the data quality, we check the acquisition images of each data set, which are taken before the interferometric observations, as well as the histogram of the fringe power of scans at each spectral channel. This fringe histogram appears very broad and/or asymmetric when the image quality is poor or the overlap of two beams is not perfect, and therefore, it can be used for diagnosing the data quality. We find out that the data sets #1 and #3 are affected by poor image quality and/or imperfect beam overlap, and therefore, we use these data sets only for extracting the -band spectra. On the other hand, the other four data sets do not show a hint of such problems, and we derive visibilities and spectra from these data sets.
We derive the interferometer transfer function at each spectral channel between 8 and 13 m by observing calibrators listed in Table LABEL:table_calib. We use the mean of the transfer function values derived from the calibrators observed on the same night as WOH G64, and the errors of the calibrated visibilities are first estimated from the standard deviation of the transfer function values at each wavelength. While the errors estimated in this manner are quite small (1 %), there may still be systematic errors discussed above, even if the data sets seem not to be severely affected by the overlap problem and/or poor image quality. In order to account for such systematic errors, we assume a minimum relative error of 15% as adopted by Preibisch et al. (preibisch06 (2006)).
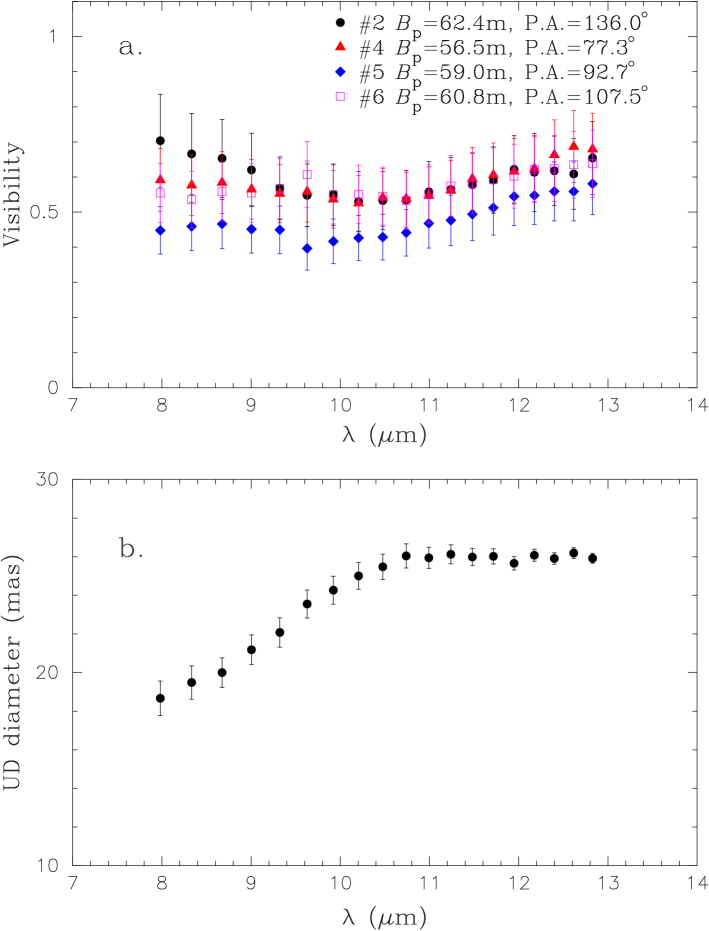
Figure 2a shows the -band visibilities of WOH G64 derived from the data sets #2, #4, #5, and #6 using the EWS package. Since the results obtained with the MIA and EWS packages show good agreement, we only present the result derived with the EWS package in the discussion below. The object is spatially resolved by our MIDI observations. The observed -band visibilities are approximately constant or slightly decrease from 8 to 10 m, while they increase gradually longward of 10 m.
Qualitatively, the observed wavelength dependence of the visibilities can be explained by the silicate absorption feature at 10 m (see Fig. 3). In an optically thick dust envelope, photons in the silicate feature originate farther out from the star compared to the continuum, leading to a decrease in visibility inside the silicate feature. The four visibilities were obtained at approximately the same baseline length (57–62 m) but at position angles differing by 59°, but there is no remarkable difference among the visibilities within the errors. Therefore, the object shows no significant deviation from centrosymmetry over this range of position angle. The uniform-disk diameter derived from the visibilities, which is plotted in Fig. 2b, shows a steep increase from 8 to 10 m (from 18 to 26 mas) with a flat portion longward of 10 m. However, we stress that the uniform-disk fitting is merely for obtaining some characteristic angular size of the object.
2.2 -band spectra
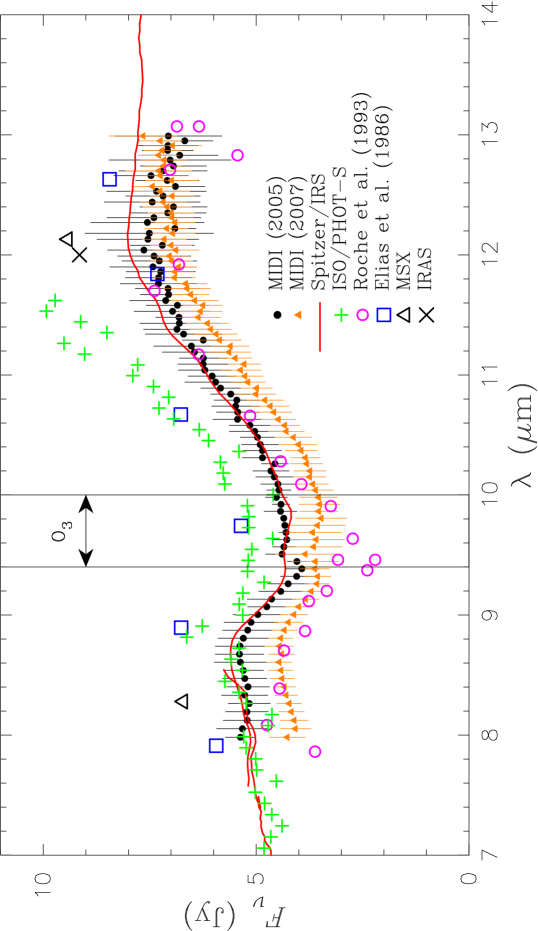
We extract the absolutely calibrated -band spectra of WOH G64 from our MIDI data with the procedure described in Ohnaka et al. (ohnaka07 (2007)). The calibrators observed at airmasses similar to WOH G64 are used for the spectrophotometric calibration and marked with in Table LABEL:table_calib. The averaged spectra are calculated separately from the data taken 2005 and 2007 with three (WOH G64, calibrator) pairs each, and the errors are estimated from the standard deviation of the spectra derived from these pairs. The extracted -band spectra, which are plotted in Fig. 3, are dominated by the self-absorption of amorphous silicate at 10 m. The MIDI spectrum obtained in 2007 shows flux levels slightly lower than that observed in 2005. However, given the errors of the spectrophotometric calibration of MIDI data, the difference is marginal, and we cannot draw a definitive conclusion about the temporal variation of the -band flux between 2005 and 2007. Also plotted are the mid-infrared spectra obtained with the Spitzer Space Telescope (Werner et al. werner04 (2004)) and the Infrared Space Observatory (ISO). The Spitzer spectrum was obtained on 2005 January 12 with the InfraRed Spectrometer222 The IRS was a collaborative venture between Cornell University and Ball Aerospace Corporation funded by NASA through the Jet Propulsion Laboratory and Ames Research Center. (IRS, Houck et al. houck04 (2004)) in the Short Low (SL) and Long Low (LL) modes covering from 5.2 to 38 m with spectral resolution of 64–128 (Program ID: P03426, P.I.: J. H. Kastner) and has recently been published by Buchanan et al. (buchanan06 (2006)). We downloaded the Basic Calibration Data (BCD) processed with the S15-3 pipeline from the Spitzer data archive and extracted the spectrum using SMART v.6.2.4 (Higdon et al. higdon04 (2004)). The sky background was estimated by means of “local sky” using the pixels outside the extraction aperture, and the spectra extracted at two nodding positions are co-added. The extracted spectrum is in very good agreement with that published in Buchanan et al. (buchanan06 (2006)). The ISO spectrum obtained on 1996 May 26 with PHOT-S (2.5–5 m and 6–12 m, ), which was published by Trams et al. (trams99 (1999)), was downloaded from the ISO data archive. We also plot (spectro)photometric data available in the literature (Elias et al. elias86 (1986); Roche et al. roche93 (1993); MSX, Egan et al. egan03 (2003); IRAS Point Source Catalog).
The MIDI spectrum obtained in 2005 is in very good agreement with the Spitzer/IRS spectrum, which was taken relatively close in time to our MIDI data compared to the other data. We also note that the MIDI spectrum was obtained with a slit of 052″, while the Spitzer/IRS uses much larger slits (36 57″ and 105 168″ in the SL and LL modes, respectively). Therefore, the agreement between the MIDI and Spitzer/IRS spectra means the absence of extended emission in the band (whether physically associated to WOH G64 or background emission). On the other hand, there are some differences in the flux level as well as the depth of the 10 m feature between the MIDI spectra and the other data. This can be due to either differences in the apertures used for these observations or an intrinsic temporal variation. Given the above good agreement between the MIDI and Spitzer data, the differences between the MIDI and the other data are more likely to be (long-term) temporal variations of the mid-infrared flux. In fact, Roche et al. (roche93 (1993)) report that WOH G64 shows noticeable temporal variations of the flux level as well as the depth of the 10 m absorption over 5 years, despite the small variability amplitude in the band (, Wood et al. wood92 (1992); Whitelock et al. whitelock03 (2003)). However, since the MIDI spectra taken in 2005 and 2007 do not show a significant temporal variation, we merge the data (-band visibilities as well as spectra) taken at the two epochs for our radiative transfer modeling. In addition to our MIDI spectra, we also include the Spitzer/IRS spectrum in our modeling, because it was obtained relatively close in time to our MIDI observations.
| Calibrator | Sp. | Date | |||
| Type | (Jy) | (mas) | (UTC) | ||
| 2005 | |||||
| HD33042 | K5III | 12.3 | Sep. 18 | 07:37:50 | |
| Nov. 12 | 08:46:31 | ||||
| Nov. 13 | 08:47:36 | ||||
| HD37160 | K0IIIb | 9.4 | Sep. 18 | 08:56:35 | |
| HD36673 | F0Ib | 8.1 | Nov. 12 | 05:33:39 | |
| Nov. 12 | 07:10:25 | ||||
| HD36079 | G5II | 20.3 | Nov. 12 | 06:24:46 | |
| 2007 | |||||
| HD26967 | K2III | 13.5 | Oct. 22 | 04:56:51 | |
| HD55865 | K0III | 12.4 | Oct. 22 | 06:08:55 | |
| Oct. 22 | 07:05:45 | ||||
2.3 Spectral energy distribution
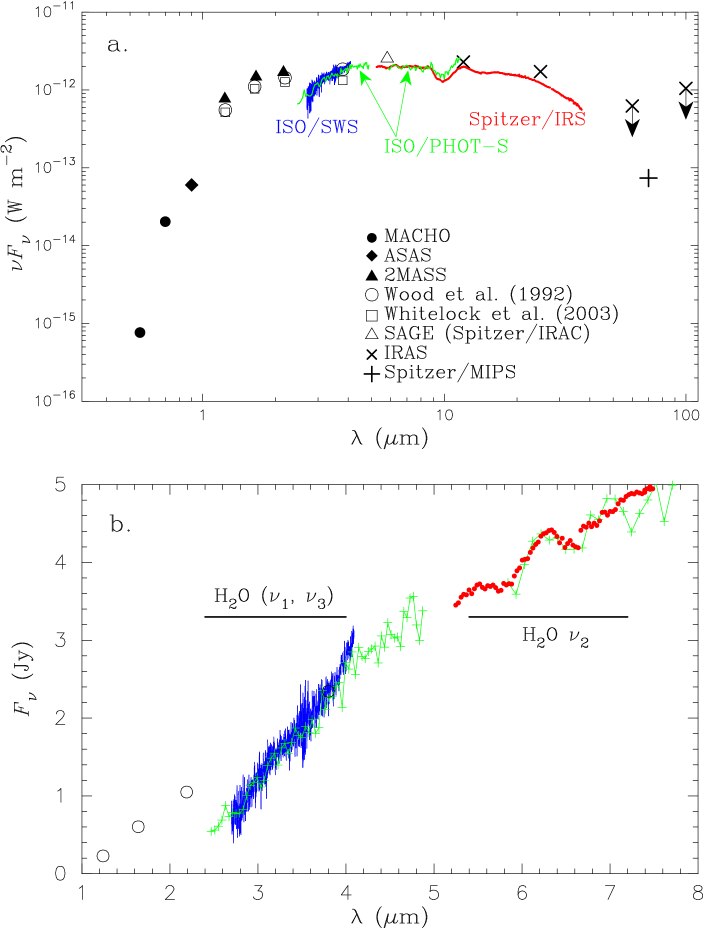
Together with the -band visibilities and mid-infrared MIDI and Spitzer/IRS spectra, we use photometric data from the optical to the far-infrared as observational constraints in our radiative transfer modeling. We collect photometric data on WOH G64 available in the literature (Elias et al. elias86 (1986); Wood et al. wood92 (1992); Whitelock et al. whitelock03 (2003); 2MASS, Cutri et al. cutri03 (2003); MACHO, Alcock et al. alcock01 (2001); ASAS, Pojmanski et al al. pojmanski02 (2002), pojmanski03 (2003), pojmanski04 (2004), 2005a ,b; IRAS Point Source Catalog; SAGE, Meixner et al. meixner06 (2006)). The long-term monitoring of Wood et al. (wood92 (1992)) and Whitelock et al. (whitelock03 (2003)) shows that the variability of WOH G64 is as small as 0.3 in the near-infrared. The infrared spectra obtained with the PHOT-S and the Short Wavelength Spectrometer (SWS) onboard the ISO (Vandenbussche et al. vandenbussche02 (2002)) are also included. Since the IRAS data only give upper limits on the 60 and 100 m fluxes, we derive the 70 m flux from the imaging data obtained with the Multiband Imaging Photometer for Spitzer (MIPS, Rieke et al. rieke04 (2004)) on 2005 November 8 (Program ID: P20203, P.I.: M. Meixner). The 70 m flux is extracted from the post-BCD data with an aperture radius of 35″, with the background emission estimated in an annulus between 40″ and 60″. The resulting 70 m flux is 1.7 Jy. The interstellar extinction toward WOH G64 is uncertain. Van Loon et al. (vanloon97 (1997)) argue that while the foreground reddening toward the LMC is on average, there may be considerable (but patchy) extinction inside the LMC. However, since no systematic study on the reddening inside the LMC is available, we neglect the interstellar extinction toward WOH G64 in the present work. The whole SED is plotted in Fig. 4a, which reveals the huge infrared excess toward WOH G64.
Figure 4b shows an enlarged view of the region between 1 and 8 m. The ISO/SWS and ISO/PHOT-S spectra reveal remarkable absorption features between 2.4 and 4 m, which can be attributed to the H2O and fundamental bands. As presented in Sect. 3, the flux contribution of the attenuated star is the more dominant compared to the dust thermal emission at wavelengths below 3 m. Therefore, the H2O absorption feature centered at 2.7 m is likely to originate in the photosphere and/or in the so-called “warm molecular layers” (or MOLsphere) close to the star, whose presence is confirmed in Galactic RSGs (e.g., Tsuji tsuji00 (2000), tsuji06 (2006); Ohnaka ohnaka04 (2004); Verhoelst et al. verhoelst06 (2006); Perrin et al. perrin07 (2007)). On the other hand, the Spitzer/IRS spectrum (and also the ISO/PHOT-S spectrum, although a little noisy) reveals the 6 m H2O feature due to the fundamentals, which is only marginally discernible in Fig. 1a of Buchanan et al. (buchanan06 (2006)) because of the large ordinate scale of their plot. Since the flux is dominated by the dust thermal emission at these wavelengths, the 6 m absorption feature is mostly caused by the H2O gas present in the circumstellar envelope, and the H2O absorption is seen with the hot dust thermal emission as the background. Such circumstellar H2O absorption features, albeit much weaker, are also identified in the Galactic red supergiant NML Cyg (Justtanont et al. justtanont96 (1996)).
3 Modeling of the dusty environment of WOH G64
Since van Loon et al. (vanloon99 (1999)) have already shown that the SED of WOH G64 cannot be explained by a spherical dust shell model, we attempt to explain the observed SED and -band visibilities with the second simplest geometry: axisymmetric dust torus (or disk) model. We use our Monte Carlo code (mcsim_mpi) for two-dimensional modeling of the dusty environment of WOH G64. The outputs of mcsim_mpi are dust temperature and monochromatic mean intensity in each cell of the dust envelope. Using these outputs, a model image at a given wavelength viewed from an arbitrary angle is computed with our ray-trace code. The details of our codes are described in Ohnaka et al. (ohnaka06 (2006)).
The central star is assumed to be a blackbody of effective temperature . The spectral type of WOH G64 is determined as M7.5 from optical spectroscopy by Elias (elias86 (1986)) and van Loon et al. (vanloon05 (2005)), although the latter authors note some ambiguity in the spectral classification of WOH G64 and suggest that an earlier spectral type of M5 is also possible. We convert these spectral types to effective temperatures using the temperature scale derived by Levesque et al. (levesque06 (2006)) based on RSGs in the LMC. Since their effective temperature scale does not extend beyond M4.5, we linearly extrapolate the temperature scale between M0 and M4.5 down to M7.5, which results in = 3230 K. The earlier spectral type of M5 corresponds to = 3400 K. We adopt = 3200 K in our modeling, but the adoption of 3400 K turns out not to noticeably affect the result of the modeling presented below.
The torus model considered here is similar to that adopted by Ohnaka et al. (ohnaka06 (2006)), which is basically a sphere with a biconical cavity. We introduce two differences compared to this previous model: 1) the density in the cavity is lower than in the torus but not exactly zero, and 2) the density drop from the torus to the cavity (along the latitudinal direction) is smoothed as described by
where and are the radial distance from the central star and the latitudinal angle measured from the equatorial plane, respectively, while and are the inner boundary radius and the half-opening angle of the torus, respectively (see the inset of Fig. 5a). is a constant representing the smoothing of the density drop from the torus to the bipolar cavity. In the models discussed below, we adopt (for and measured in radian). represents the ratio of the density in the cavity to that in the torus. The radial density distribution is assumed to be proportional to (i.e., ), which corresponds to a steady mass outflow with a constant velocity. The free parameters in our models are , , (the radial optical depth at 0.55 m in the equatorial plane), and . In addition to these parameters describing the torus, it is necessary to specify its orientation in the plane of the sky. This is equivalent to specifying the angle between the torus symmetry axis projected onto the plane of the sky and the projected baseline vector of our MIDI observations (see also Fig. 6), and this angle is used as an additional free parameter. The torus is assumed to consist of amorphous silicate grains, because the MIDI, Spitzer/IRS, and ISO spectra show no obvious dust features other than the self-absorption due to amorphous silicate. The grain size distribution is proportional to between the minimum size () and maximum size (), as considered by Mathis et al. (mathis77 (1977)). We tentatively assume = 0.005 m, = 0.1 m, and = 3.5, and examine the effects of these parameters later. The mean of the absorption and scattering coefficients weighted with the above size distribution is computed from the complex refractive index of the “warm silicate” of Ossenkopf et al. (ossenkopf92 (1992)) using the Mie code of Bohren & Huffman (bohren83 (1983)). For simplicity, isotropic scattering is considered for our modeling.
The range of the free parameters varied in our modeling is as follows: () = 5 … 25 with = 5, = 20° … 90° with = 10° ( = 90° corresponds to spherical shell models), = 10 … 50 with = 5, and = 0.0 … 0.5 with = 0.1. The outer boundary radius () is fixed to 250 (see discussion below). SEDs are computed for different inclination angles (measured from pole-on as illustrated in Fig. 5a) of = 0°… 90° with = 10° for all models, and we first compare these model SEDs with the observed one. This comparison between the model and observed SEDs allows us to derive the bolometric luminosity of the central star, because the distance to the LMC is known (50 kpc). The two-dimensional visibilities are then computed from the Fourier transform of model -band images. Note that the stellar radius derived from the central star’s luminosity and effective temperature is used to scale the model visibilities.
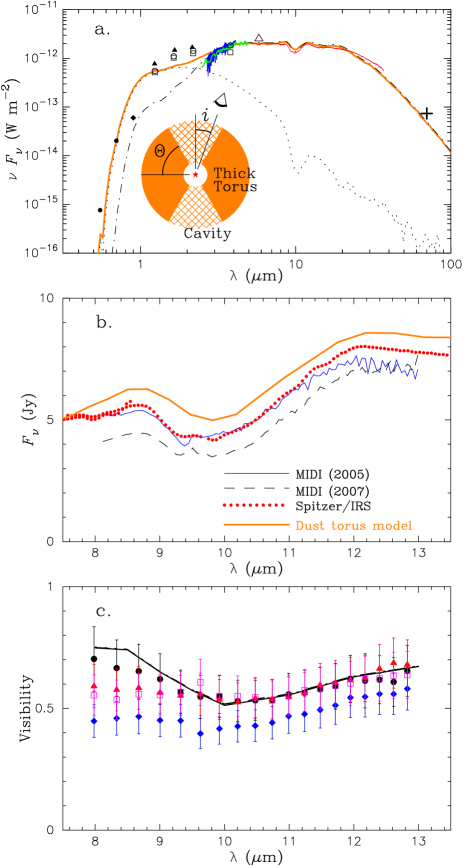
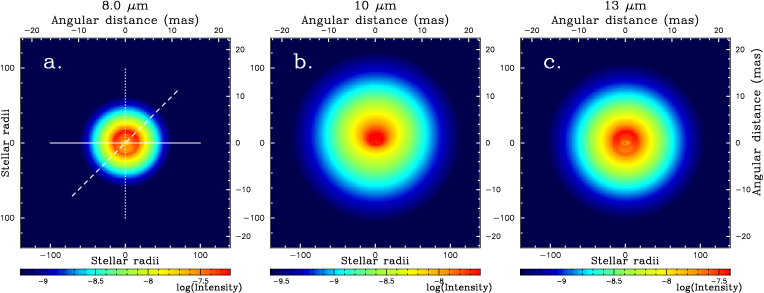
Figure 5 shows a comparison of the best-fit model with the observed SED and -band visibilities, and the parameters of the model are given in Table LABEL:table_res. As shown in the inset of Fig. 5a, the best-fit model is characterized by a geometrically and optically thick torus viewed close to pole-on. The whole SED including the 10 m silicate feature is reasonably reproduced. The torus is optically thick in the equatorial direction ( = 30 and = 7), which gives rise to the huge mid- and far-infrared excess as observed. However, since the object is seen through the cavity with lower density ( = 9 and = 2.1), the central star is not entirely obscured, and the flux in the near-infrared and in the optical as well as the observed silicate absorption is reasonably reproduced. The model predicts the near-infrared ( and bands) flux to be somewhat lower than the observation. This is because the spectrum of the central star is approximated with that of a blackbody. The spectrum of photospheric models shows a flux excess at these wavelengths compared to the blackbody of the same effective temperature, because the opacity of negative hydrogen, which is the major continuous opacity source in the atmosphere of cool stars, has a minimum at 1.6 m (e.g., Tsuji tsuji78 (1978); Plez et al. plez92 (1992)). The discrepancy in the optical flux between the model and the observation can be explained by molecular absorption features (mainly TiO) which are not included in the blackbody approximation. For comparison, we show a spherical shell model with the same parameters as the best-fit torus model, but with = 20 (and a higher luminosity of than the of the torus model discussed below). This spherical shell model can reproduce the mid- and far-infrared excess as well as the 10 m silicate feature, but the predicted near-infrared and visible fluxes are too low to explain the observed data, because the optical depth along the line of sight is much higher.
The model visibilities are also in agreement with the MIDI observations within the errors of the measurements. This pole-on model appears nearly centrosymmetric as seen in the -band images shown in Fig. 6, and this can explain the absence of a noticeable position-angle dependence in the observed visibilities. The orientation of the torus in the plane of the sky cannot be well constrained because the object is seen close to pole-on, but obviously, it is not a crucial parameter in such a case and does not affect the determination of the other parameters. We note that the inner boundary radius is weakly constrained, 10–20 , because the four visibilities currently available were taken at approximately the same baseline length and cannot put tight constraints on the radial density distribution. This hampers us from discussing possible metallicity effects on dust formation in LMC RSGs at the moment.
We study the effects of the outer boundary radius by varying in the best-fit model. While the adoption of larger outer boundary radii ( = 500 and 1000 ) does not result in a notable change in the SED below 70 m and -band visibilities, the models with the outer boundary radii smaller than 250 predict the 70 m flux to be too low compared to the Spitzer/MIPS data. Therefore, we can only set a lower limit of 250 on the outer boundary radius. We also check the effects of the grain size distribution by changing the minimum and maximum grain sizes as well as the power-law index of the size distribution for the best-fit model. We find the upper limit for the minimum grain size to be 0.05 m, while the lower limit cannot be well constrained. On the other hand, the upper and lower limits for the maximum grain size are found to be 0.15 m and 0.01 m, respectively. Models with power-law index values between 1.5 and 4.5 (3.5 is adopted in the above modeling) can reproduce the observational data, and thus, this parameter is not tightly constrained by the present modeling.
| Parameter | Value |
|---|---|
| Torus half-opening angle () | 60°10° |
| Torus inner boundary radius () | |
| (with 1 = 8 AU) | ( AU) |
| Inner boundary dust temperature | K |
| Torus outer boundary radius () | |
| Radial optical depth at 0.55 m () | |
| Optical depth along the line of sight | () |
| Radial density distribution | (fixed) |
| Inclination angle () | 20° (0°– 30° with ) |
| Grain size distribution | |
| Maximum grain size () | 0.1 m (0.01–0.15 m) |
| Minimum grain size () | 0.005 m (0.05 m) |
| Total envelope mass | 3–9 |
| (gas-to-dust ratio = 200–500) | |
| Luminosity | |
| Stellar radius | 1730 |
| Effective temperature | 3200 K (fixed) |
4 Discussion
Our two-dimensional modeling of the MIDI data and SED indicates that WOH G64 has an axisymmetric, optically thick dust torus. The presence of such axisymmetric structures is suggested toward Galactic RSGs as well. In particular, the well-studied dusty RSG, NML Cyg, which can be regarded as a Galactic counterpart of WOH G64 (van Loon et al. vanloon98 (1998)), is also suspected to have bipolar outflows based on radio interferometry observations (Richards et al. richards96 (1996)). Therefore, the occurrence of bipolar outflows and/or thick tori seems to be a common phenomenon among RSGs in the Galaxy as well as in the LMC, although the origin of the axisymmetric structures is still unclear. We note that the pole-on dusty torus model for WOH G64 is qualitatively consistent with the asymmetric OH maser profile with the blue peak much stronger than the red peak. Marshall et al. (marshall04 (2004)) propose that the amplification of the stellar light is responsible for the blue-red-asymmetry, and this process can be particularly effective, when the star is seen through the less dense cavity as in the case of WOH G64.
The luminosity of the central star derived from our radiative transfer modeling, ( = ), is by a factor of 2 lower than the (5–6) previously estimated by Elias et al. (elias86 (1986)) and van Loon et al. (vanloon05 (2005)) assuming a spherical shell. Our modeling suggests that the object has an optically thick torus and is seen through the cavity with lower density. In such a case, more radiation escapes toward the cavity (i.e., toward the observer) than toward the optically thick torus, and the bolometric luminosity of the central star is overestimated, when it is derived from the observed flux assuming isotropic radiation. The location of WOH G64 based on the new, lower luminosity is plotted in Fig. 1. The newly derived luminosity corresponds to that of an RSG with an initial mass of 25 , and the location of WOH G64 is in much better agreement with the theoretical evolutionary tracks, although WOH G64 is still somewhat too cool compared to the theoretical models. In fact, comparison with the Hayashi limit presented in Levesque et al. (levesque07 (2007)) reveals that WOH G64 is to the right of the Hayashi limit if is 3200 K. Even if we adopt = 3400 K corresponding to the earlier spectral type of M5 suggested by van Loon et al. (vanloon05 (2005)), it is close to, but still slightly beyond the Hayashi limit. The extreme effective temperature of WOH G64 suggests that it may be experiencing a very unstable phase accompanied by heavy mass loss, as proposed for some RSGs in the LMC and SMC located in the forbidden zone beyond the Hayashi limit (Levesque et al. levesque07 (2007)). However, it should also be kept in mind that the determination of effective temperature from the optical spectrum may be affected by the extinction due to the circumstellar dust envelope and/or the contribution of scattered light by dust grains, as suggested from the redshifted photospheric absorption lines with respect to the SiO and H2O masers (van Loon et al. vanloon98 (1998), vanloon01 (2001)). Also, the Hayashi limit is a complex function of stellar mass and metallicity as described in Cox & Giuli (cox68 (1968)). Therefore, it is still possible that WOH G64 is just on the Hayashi limit with an effective temperature somewhat higher than the above estimates.
WOH G64 indeed appears to have already shed a significant fraction of its initial mass. The dust mass in the best-fit torus model is with a grain bulk density of 3 g cm-3, which translates into a total envelope mass of 3–9 with gas-to-dust ratios of 200–500. These values already represent a noticeable fraction of the initial total mass of 25 estimated for WOH G64. Moreover, as discussed in Sect. 3, the outer boundary radius of 250 is a lower limit, and the envelope mass becomes even higher for larger outer boundary radii. Interestingly, although WOH G64 is cooler than the evolutionary tracks for a 25 star shown in Fig. 1, the evolutionary calculation from Schaerer et al. (schaerer93 (1993)) as well as the new calculation performed in this work predicts that a 25 star has lost 2 and 7.5 at the RSG stage (an age of 7.8 Myr), respectively. Therefore, the derived envelope mass of WOH G64 is in rough agreement with current stellar evolution theory.
5 Concluding remarks
We have spatially resolved the circumstellar environment of the dusty red supergiant WOH G64 in the LMC, which is the first MIDI observation to resolve an individual stellar source in an extragalactic system. The observed -band uniform-disk diameter is found to increase from 18 mas at 8 m to 26 mas at 13 m. The visibilities obtained at approximately the same baseline length but at four position angles differing by 60° show no remarkable difference, indicating that the object appears nearly centrosymmetric. Our two-dimensional radiative transfer modeling shows that these visibilities and the observed SED can be explained by an optically and geometrically thick torus viewed close to pole-on. The luminosity of the central star derived by our modeling is by a factor of 2 lower than the previous estimates based on spherical shell models. The new, lower luminosity brings WOH G64 in much better agreement with the theoretical evolutionary tracks, which suggests an initial mass of 25 for WOH G64. However, its location on the H-R diagram is very near or beyond the Hayashi limit. This implies that WOH G64 may be in an unstable stage at the moment, experiencing remarkable mass loss. The total envelope mass estimated from our model is of the order of 3–9 , representing a significant fraction of its initial mass. This envelope mass is comparable to what is predicted by current stellar evolutionary calculations.
We also identified the H2O absorption features at 2.7 m and 6 m in the spectra obtained with ISO and Spitzer, respectively. The 2.7 m feature is likely to originate in the photosphere and/or MOLsphere. On the other hand, the 6 m feature can be interpreted as the absorption due to cold circumstellar H2O gas seen with the hot dust thermal emission as background.
Obviously, follow-up MIDI observations are necessary for putting more constraints on the properties of the torus. In particular, MIDI observations with shorter and longer baselines are indispensable for obtaining tighter constraints on the torus inner boundary radius, which is crucial for better understanding possible metallicity effects on the dust formation and mass loss in RSGs. MIDI measurements over even a wider position angle range are also important for probing the possible presence of more complex structures. The H2O gas in the photosphere and in the MOLsphere can be studied in more detail using the near-infrared VLTI instrument AMBER (Petrov et al. petrov07 (2007)). For example, AMBER observations of the H2O bands in the band would be useful for constraining the geometrical extension of the H2O layers close to the star.
Acknowledgements.
We thank the ESO VLTI team on Paranal and in Garching and the MIDI team for carrying out the observations and making the data reduction software publicly available. This paper utilizes public domain data originally obtained by the MACHO Project, whose work was performed under the joint auspices of the U.S. Department of Energy, National Nuclear Security Administration by the University of California, Lawrence Livermore National Laboratory under contract No. W-7405-Eng-48, the National Science Foundation through the Center for Particle Astrophysics of the University of California under cooperative agreement AST-8809616, and the Mount Stromlo and Siding Spring Observatory, part of the Australian National University.References
- (1) Alcock, C., Allsman, R., Alves, D., et al. 2001, Variable Stars in the Magellanic Clouds from the MACHO Project
- (2) Blöcker, T. 1995, A&A, 297, 727
- (3) Bohren, C. F., & Huffman, D. R. 1983, Absorption and Scattering of Light by Small Particles, Wiley, New York
- (4) Buchanan, C. L., Kastner, J. H., Forrest, W. J., et al. 2006, ApJ, 132, 1890
- (5) Chesneau, O., Meilland, A., Rivinius, T., et al. 2005, A&A, 435, 275
- (6) Cox, J. P., & Giuli, T. R. 1968, Principles of Stellar Structure, Volume 2: Applications to Stars, Gordon and Breach
- (7) Cutri, R. M., Skrutskie, M. F., Van Dyk, S., et al. 2003, The 2MASS All-Sky Catalog of Point Sources
- (8) de Jager, C., Nieuwenhuijzen, H., & van der Hucht, K. A. 1988, A&AS, 72, 259
- (9) Egan, M. P., Price, S. D., Kraemer, K. E., et al. 2003, The Midcourse Space Experiment Point Source Catalog Version 2.3, Air Force Research Laboratory Technical Report AFRL-VS-TR-2003-1589
- (10) Elias, J. H., Frogel, J. A., & Schwering, P. B. 1986, ApJ, 302, 675
- (11) Herwig, F., Blöcker, T., Schönberner, D., & El Eid, M. 1997, A&A, 324, L81
- (12) Herwig, F. 2000, A&A, 360, 952
- (13) Higdon, S. J. U., Devost, D., Higdon, J. L., et al. 2004, PASP, 116, 975
- (14) Houck, J., Roellig, T., van Cleve, J., et al. 2004, ApJS, 154, 18
- (15) Jaffe, W. 2004, SPIE Proc., 5491, 715
- (16) Justtanont, K., de Jong, T., Helmich, F. P, et al. 1996, A&A, 315, L217
- (17) Leinert, Ch., van Boekel, R., Waters, L. B. F. M., et al. 2004, A&A, 423, 537
- (18) Levesque, E., M., Massey, P., Olsen, K. A. G., et al. 2006, ApJ, 645, 1102
- (19) Levesque, E., Massey, P., Olsen, K. A. G., Plez, B. 2007, In: The Biggest, Baddest, Coolest Star, A.S.P. Conf. Ser., in press, (astro-ph/0708.2914)
- (20) Marshall, J. R., van Loon, J. Th., Matsuura, M., et al. 2004, MNRAS, 355, 1348
- (21) Massey, P. 2003, ARA&A, 41, 15
- (22) Mathis, J. S., Rumple, W., & Nordsieck, K. H. 1977, ApJ, 217, 425
- (23) Meixner, M., Gordon, K. D., Indebetouw, R., et al. 2006, AJ, 132, 2268
- (24) Meynet, G., & Maeder, A. 2005, A&A, 429, 581
- (25) Ohnaka, K. 2004, A&A, 421, 1149
- (26) Ohnaka, K., Driebe, T., Hofmann, K.-H., et al. 2006, A&A, 445, 1015
- (27) Ohnaka, K., Driebe, T., Weigelt, G., & Wittkowski, M. 2007, A&A, 466, 1099
- (28) Ossenkopf, V., Henning, Th., & Mathis, J. S. 1992, A&A, 261, 567
- (29) Perrin, G., Verhoelst, T., Ridgway, S. T., et al. 2007, A&A, 474, 599
- (30) Petrov, R. G., Malbet, F., Weigelt, G., et al. 2007, A&A, 464, 1
- (31) Plez, B., Brett, J. M., & Nordlund, Å 1992, A&A, 256, 551
- (32) Pojmanski G., Maciejewski, G., Pilecki, B., & Szczygiel, D. 2002, AcA, 52, 397
- (33) Pojmanski G., Maciejewski, G., Pilecki, B., & Szczygiel, D. 2003, AcA, 53, 341
- (34) Pojmanski G., Maciejewski, G., Pilecki, B., & Szczygiel, D. 2004, AcA, 54, 153
- (35) Pojmanski G., Maciejewski, G., Pilecki, B., & Szczygiel, D. 2005a, AcA, 55, 97
- (36) Pojmanski G., Maciejewski, G., Pilecki, B., & Szczygiel, D. 2005b, AcA, 55, 275
- (37) Preibisch, Th., Kraus, S., Driebe, T., van Boekel, R., & Weigelt, G. 2006, A&A, 458, 235
- (38) Przygodda, F., Chesneau, O., Graser, U., Leinert, Ch., & Morel, S. 2003, Ap&SS, 286, 85
- (39) Richards, A. M. S., Yates, J. A., & Cohen, R. J. 1996, MNRAS, 282, 665
- (40) Rieke, G. H., Young, E. T., Engelbracht, C. W., et al. 2004, ApJS, 154, 25
- (41) Roche, P. F., Aitken, D. K., & Smith, C. H. 1993, MNRAS, 262, 301
- (42) Schaerer, D., Meynet, G., Maeder, A., & Schaller, G. 1993, A&AS, 98, 523
- (43) Trams, N. R., van Loon, J. Th., Waters, L. B. F. M., et al. 1999, A&A, 346, 843
- (44) Tsuji, T. 1978, A&A, 62, 29
- (45) Tsuji, T. 2000, ApJ, 540, L99
- (46) Tsuji, T. 2006, ApJ, 645, 1448
- (47) Vandenbussche, B., Beintema, D., de Graauw, T., et al. 2002, A&A, 390, 1033
- (48) van Loon, J. Th., Zijlstra, A. A., Bujarrabal, V., & Nyman, L.-Å. 1996, A&A, 306, L29
- (49) van Loon, J, Th., Zijlstra, A. A., Whitelock, P. A., et al. 1997, A&A, 325, 585
- (50) van Loon J. Th., te Lintel Hekkert, P., Bujarrabal, V., Zijlstra, A. A., & Nyman, L.-Å. 1998, A&A, 337, 141
- (51) van Loon, J. Th., Groenewegen, M. A. T., de Koter, A., et al. 1999, A&A, 351, 559
- (52) van Loon, J. Th., Zijlstra, A. A., Bujarrabal, V., & Nyman, L.-Å. 2001, A&A, 368, 950
- (53) van Loon, J. Th., Cioni, M.-R., L., Zijlstra, A. A., & Loup, C. 2005, A&A, 438, 273
- (54) Verhoelst, T., Decin, L., Van Malderen, R., et al. 2006, A&A, 447, 311
- (55) Werner, M. W., Roellig, T. L., Low, F. J., et al. 2004, ApJS, 154, 1
- (56) Westerlund, B. E., Olander, N., & Hedin, B. 1981, A&AS, 43, 267
- (57) Whitelock, P., Feast, M. W., van Loon, J. Th., & Zijlstra, A. A. 2003, MNRAS, 342, 86
- (58) Wood, P. R., Bessell, M. S., & Whiteoak, J. B. 1986, ApJ, 306, L81
- (59) Wood, P. R., Whiteoak, J. B., Hughes, S. M. G., et al. 1992, ApJ, 397, 552