X-ray Observations of Optically Selected Giant Elliptical-Dominated Galaxy Groups
Abstract
We present a combined optical and X-ray analysis of three optically selected X-ray bright groups with giant elliptical galaxies in the center. These massive ellipticals were targeted for XMM-Newton X-ray observations based on their large velocity dispersions and their proximity to a nearby ROSAT X-ray source. Additionally, these targets are significantly brighter in the optical than their nearest neighbors. We show that one of these systems meets the standard criteria for a fossil group. While the other two systems have a prominent magnitude gap in the E/S0 ridgeline, they do not appear to have reached the fossil-like final stage of group evolution.
Subject headings:
elliptical and lenticular, cD — galaxies:galaxies: clusters — X-rays:LA-UR-07-0764
1. Introduction
X-ray bright giant elliptical galaxies have gained considerable attention recently as possible end points in the evolution of galaxy groups. It is often suggested that these systems form in the process of merging of smaller galaxies with the associated loss of the progenitors’ disk component and the formation of a common, group-sized dark matter halo. Details of this process are still unclear, and the formation process is sensitive to both the cosmological parameters and astrophysical processes involved.
The possibility that members of compact groups could merge to form a large elliptical galaxy on timescales much shorter than the Hubble time was first predicted from early numerical simulations Barnes (1989). In 1993, Ponman & Bertram suggested that a large elliptical galaxy which formed through mergers of smaller galaxies could retain its diffuse halo. Such an object would exhibit a high X-ray luminosity, while its optical light would be dominated by a single massive galaxy. In 1994, Ponman et al. reported the discovery of just such an object and termed it a “fossil group” (FG). Other researchers have discovered similar objects and have employed terms such as over-luminous elliptical galaxies (OLEGs, Vikhlinin et al. (1999)). The number of these systems reported in the literature is growing. Similar to the early days of galaxy cluster research, the precise object definitions used by researchers show large variations Vikhlinin et al. (1999); Mulchaey & Zabludoff (1999); Romer et al. (2000); Jones et al. (2003); Sun et al. (2004); Yoshioka et al. (2004); Ulmer et al. (2005). In general, the search criteria usually include a cut for both absolute optical magnitude of the central object, and extended X-ray emission, as well as the requirement for an optical magnitude gap between the first and the second brightest member of the group.
While both observations and numerical N-body simulations firmly establish the existence of fossil-group-like objects, there are several remaining questions to be addressed. The theory of hierarchical structure formation predicts that more massive objects form by merging of less massive objects, and consequently, that mass functions for structures of different mass, such as clusters and groups of galaxies, should be self-similar. While the expected self-similarity is seen in N-body simulations, it seems to break down observationally. The mass function of clusters is in general agreement with simulations, but even the most massive groups demonstrate a lack of low-mass satellites and exhibit mass functions similar to the Local Group D’Onghia et al. (2007). These conclusions should be considered preliminary, as they have been so far based on a small number of studied systems.
Two theories have been proposed as models for the formation of giant ellipticals: evolutionary formation through merging and in situ through accretion. The first scenario suggests that they are the end-point of group/cluster evolution through mergers and dynamical friction. The second suggests that they are the massive-end point of the elliptical galaxy distribution or that they formed initially with a deficit of small galaxies Mulchaey & Zabludoff (1999); Jones et al. (2003); Yoshioka et al. (2004); Mendes de Oliveira et al. (2006). Both of these theories have their own difficulties when trying to explain the observations. If these systems have evolved from groups or clusters one would expect to see cool cores, but observationally cool cores are not seen at all or are smaller than expected Khosroshahi et al. (2004, 2006); Sun et al. (2004). Mass-to-light ratios of fossil groups are unusually high (Khosroshahi et al. 2007), suggesting that the star-formation history of their member galaxies is different from other groups and clusters. They also appear to have higher than expected concentrations as measured from their density profiles.
The fraction of fossil-like groups among the general population of groups may well be a sensitive probe of structure formation. While both N-body simulations and observations predict that fossil groups represent a significant fraction of all groups in the mass range -, existing observational statistics do not provide tight constraints for comparison. Historically, fossil groups were selected from X-ray surveys. Due to to the relatively spotty or shallow sky coverage of these X-ray observations, the number of identified fossil groups is low. Vikhlinin et al. (1999) estimated that OLEGs comprise 20% of all groups and clusters of comparable luminosity, but this estimate was based on only 4 objects found in a survey of extended objects. Jones et al. (2003) found a sample of 6 fossil groups satisfying their criteria and calculated their fraction to be 8-20%. Altogether fewer than 20 objects have been studied so far Mendes de Oliveira et al. (2006), and temperature measurements are available only for a handful Khosroshahi et al. (2007). In addition, the existing sample is somewhat heterogeneous as various selection criteria were used in different studies. Recently fossil group candidates were identified in the Sloan Digital Sky Survey (SDSS) data Santos et al. (2007). Between 6 and 34 candidates satisfying their criteria were found, depending on the minimum redshift range and radius of search for group members.
Recent and planned optical surveys provide an opportunity to expand the sample of fossil group candidates based on optical selection of giant ellipticals. We report here the results of our attempt for such an optical selection (see also Mulchaey & Zabludoff 1999, Santos et al. 2007). We require some evidence of X-ray emission from our targets based on the all-sky survey, and we are able to confirm the presence of extended X-ray emission and to measure its parameters after dedicated XMM-Newton observations of the selected candidates. In this paper, we present the analysis of combined optical and X-ray data, including measurements of temperature, metallicity, and X-ray luminosity for three X-ray bright groups with giant elliptical galaxies in the center. Whenever our analysis requires taking into account cosmological parameters, we assume km/s Mpc-1, , and .
2. Data
In this section we describe the algorithm we used to identify X-ray bright groups with a central giant elliptical galaxy in the SDSS data base, and we present the XMM-Newton data reduction process.
2.1. Selection Criteria
Fossil-like galaxy groups with a central giant elliptical galaxy were most often identified based on the detection of extended hot X-ray emission followed by optical observations. The SDSS data archive provides the opportunity to search for such systems starting from the optical data. The wealth of data from surveys like the SDSS and 2dFGRS, not to mention future wide-field surveys, allows for a true systematic study of properties and evolution of groups of galaxies. Our selection algorithm focuses on bright ellipticals that are neither completely isolated, nor in typical galaxy groups. The algorithm includes the following steps.
-
1.
Identify all galaxy pairs in the SDSS DR2 spectroscopic sample Abazajian et al. (2004) where the brighter of the two galaxies is at least 2 magnitudes brighter than its counterpart and .
-
2.
Ensure that the bright galaxy is an early-type and has a measurable velocity dispersion. Choose only the most massive ellipticals. We choose those with velocity dispersions km s-1.
-
3.
Ensure that there are three galaxies within 1 Mpc, but that the tenth nearest neighbor is 1.5 Mpc away (this is one Abell radius). This final criteria ensures that the fossil group candidate resides in a slightly overdense region, but not in a generic group or cluster.
The above selection criteria have consequences. First, the use of the SDSS spectroscopic sample allows us to search a complete (at the 90% level) magnitude limited galaxy survey. However, the magnitude limits and the requirement result in a redshift limit of for fossil group candidates. Second, the requirement of at least 3 galaxies with 1 Mpc of the bright early-type galaxy implies that we will not find any Isolated Over-luminous Elliptical Galaxies (IOLEGS – as defined by Yoshioka et al. 2004).
Applying these criteria we obtained a list of 14 candidates. We visually examined all of these candidates and removed two systems that had been affected by fiber collisions in the SDSS (which only observed 85% of galaxy pairs closer than 55 arcseconds). We matched the remaining 12 candidates with the available X-ray information using HEASARC and found seven RASS Faint Source Catalog matches. One of these had been already observed (UGC00842, also known as MS ).
Our selection criteria were not designed to create a statistical sample of fossil groups. Our goal was to identify massive ellipticals in slightly over-dense regions that lack bright nearest neighbors but are comparatively bright in X-rays. We then targeted these ellipticals to collect X-ray data and study their derived spectral properties (e.g., temperatures and masses) with respect to their optical properties.
Our optical target selection was performed in 2005. We obtained XMM data for the two X-ray brightest objects from the selected systems RX J and RX J in 2006 during the XMM AO5 Cycle, and used archived XMM data for UGC00842 Mathews (2003). Everywhere below we refer to these objects as rxj0029, rxj1505, and ugc00842.
2.2. XMM data reduction
| aa exposure time for the xx camera in kiloseconds. | bb ratio of observed fluxes in keV band outside FOV to that in “blank” sky data set for the xx camera. | |||||
|---|---|---|---|---|---|---|
| rxj0029 | 6.7 | 3.68 | 15.4 | 1.72 | 15.4 | 1.71 |
| rxj1505 | … | … | 18.6 | 1.63 | 17.6 | 1.63 |
| ugc00842 | 5.2 | 1.21 | 6.3 | 0.99 | 6.1 | 0.94 |
We analyzed XMM data from the EPIC/MOS and pn detectors. The observations were done in Full Frame mode using the THIN optical filter. Calibrated event files were generated using tasks emchain and epchain from XMM-Newton SAS V 7.0 and the calibration database as available in July 2007 was used.
For our analysis we follow closely the data preparation technique described in Kotov & Vikhlinin (2005). We summarize here the most important steps. We use the events corresponding to patterns 0–12 for the MOS cameras and 0–4 for the pn camera. We exclude chip #2 in the MOS1 data of the rxj1505 observation since it looks brighter than the others on the image compiled from the preprocessed event file111See also XMM-Newton helpdesk: http://xmm.esac.esa.int/xmmhelp/EPICMOS?id=16999. The data for each camera is cleaned from flares using the 2–15 keV band and data from the entire field of view is used, with the exception of point sources. Good time intervals are generated from the periods on the lightcurves for which deviations from the mean rate are less than . Cleaned exposure times for each camera are given in Table 1. The rxj1505 data from the pn camera are highly contaminated by flares, so we do not use them.
Since the observed objects are not bright, the X-ray images contain some regions which are dominated by background emission. Therefore, a double-subtraction technique Arnaud et al. (2002) for modeling the background is used. The first step of this method is a subtraction of the energetic particles induced background. In order to do this, normalization coefficients between the background present in the observation and background characteristics for the given camera are found.
We calculate these coefficients as a ratio of fluxes from the outside field of view in the 10–15 keV band between the observation and the “template” background file. As a “template” file for each camera, we use a compilation of “blank” sky observations as described in Carter & Read (2007). The normalization coefficients we obtain in this way are listed in Table 1. For rxj0029 and rxj1505 the scaling coefficients are higher than 1.5. Good values should lie within 0.8–1.2 interval. In our case the data from both observations are contaminated by particle background. Nevertheless, as we show in our analysis, these observations are still useful for imaging and spectroscopic measurements. The scaling coefficient for the pn data of rxj0029 is too high, see Table 1, so we did not use the pn data from this observation.
3. X-ray Properties
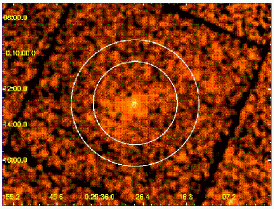
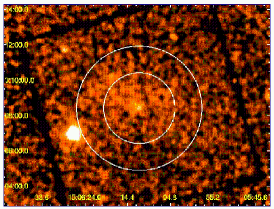
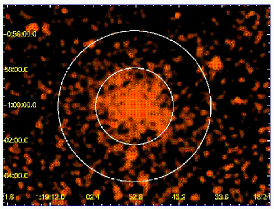
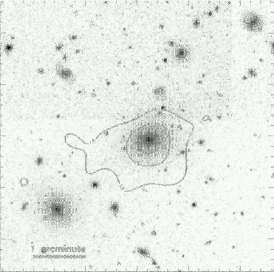
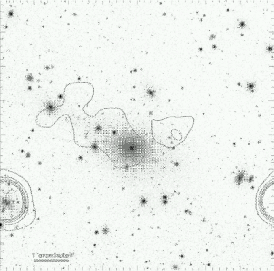
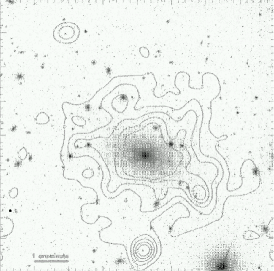
In this section we present the spectral and imaging analysis of our groups. Fig. 1 shows the smoothed, particle background subtracted, vignetting and exposure corrected images of rxj0029, rxj1505, and ugc00842.
3.1. X-ray Spectral Analysis
| aaX-ray flux measured in the 0.5–2.0 keV band. | bbX-ray luminosity in the 0.5–2.0 keV band. | ccBolometric luminosity (0.1–20.0 keV band) obtained by extrapolation of the measured luminosity to using the -model. | ||||
|---|---|---|---|---|---|---|
| Name | ( erg s-1 cm-2) | ( erg s-1) | (keV) | () | ( erg s-1) | |
| rxj0029 | 0.060 | |||||
| rxj1505 | 0.042 | |||||
| ugc00842 | 0.045 |
We extract the spectra of rxj0029, rxj1505, and ugc00842 in circles with 140”, 120”, and 130” radii, respectively (see the inner circles in Fig. 1).
The response and effective area files are generated with rmfgen and arfgen tasks from the SAS package. The resulting spectra are binned in such a way that there are at least 40 photons in every bin. We use the absorbed MEKAL model Mewe et al. (1995) as a fitting model, where the Galactic absorption is fixed at a value obtained from radio surveys Dickey & Lockman (1990). However, due to the contamination of the rxj0029 and rxj1505 data by the particle background we have to add a power-law component without a correction for the effective area. This component allows us to describe the high energy part of the spectrum. We also add the same component to the ugc00842 spectrum in order to describe residual contaminations by flares, since any further thorough cleaning of flares, such as changing -clipping or experiments with different cleaning energy bands, only reduced the exposure time without improving the spectrum.
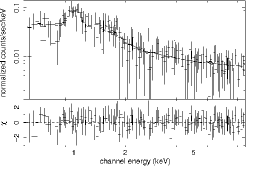
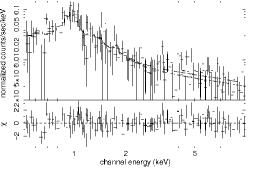
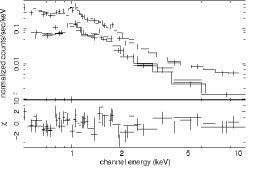
The data from MOS1 and MOS2, including pn in the case of ugc00842, are fitted jointly in the 0.5–10 keV band, where the temperatures, metalicities, and power-law slopes are held fixed, while the normalizations for each spectral component and for each of the detectors is kept free. The resulting spectra for the groups are shown in Fig. 2 and the derived spectral parameters are given in Table 2.
Figure 2 shows that the main feature of the group spectra in the soft band is a bremsstrahlung component. The power-law component in this band is several times lower. The values for temperatures and abundances are primarily determined from the shapes of the spectra in this band. Hence, the parameters inferred from the fits are quite reliable even for the groups rxj0029 and rxj1505 which are contaminated by particle induced backgrounds.
3.2. X-ray Imaging Analysis
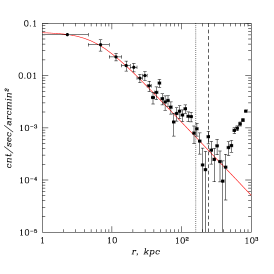
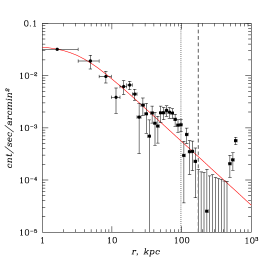
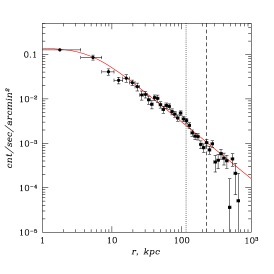
For the imaging analysis in the 0.5–2.0 keV energy band we mask all detectable point sources on the MOS1 and MOS2 detectors for three of our groups. Then we add vignetting corrected images. Surface brightness profiles are shown in Fig. 3. We use the -model Cavaliere & Fusco-Femiano (1976) to fit the data:
| (1) |
where is the angular projected off-center distance and is the core radius of the distribution. The best fit parameters for and are given in Table 3 and the surface brightness profiles extracted from the complete field of view are shown in Fig. 3. The derived parameters and fall in the range of values for groups of galaxies measured in Osmond & Ponman 2004. Several outer points on the brightness profiles for rxj0029 and rxj1505 lie higher than one would expect, especially for rxj0029. This effect is probably caused by the particle induced background and vignetting corrections. The same effects but in lesser degree, can also be seen in Kotov & Vikhlinin (2005). These last points give some idea of the possible uncertainties in our results due to experimental errors. As one can see, most of our points lie well above this level, and our fit parameters are stable against these effects.
Assuming a spherically symmetric density distribution and hydrostatic equilibrium of the intragroup gas, and using the fitted temperatures and fit parameters of the -model, we estimate the total masses of the groups inside and as
| (2) |
The estimated values for and (see Table 3) are typical for groups of galaxies.
Knowing and we can obtain gas mass estimations inside these radii. We use the popular deprojection technique Fabian et al. (1981); White et al. (1997) in order to obtain volume emissivity, which is then converted to the gas density and gas mass. Since the brightness profiles are quite noisy, we deproject the -model fits rather than count rates. The results are shown in Table 3.
The gas fractions inside and are in good agreement with the gas fractions for other groups of galaxies with the same temperatures (see Fig. 4 and Fig. 6 in Sanderson et al. 2003).
| 222() is the radius inside which the mean density of the object is 2500(500) times higher than the mean density of the Universe. | ||||||||||
|---|---|---|---|---|---|---|---|---|---|---|
| Name | (kpc) | (kpc) | () | () | () | (kpc) | () | () | () | |
| rxj0029 | 243 | 2.2% | 545 | 4.4% | ||||||
| rxj1505 | 173 | 2.3% | 388 | 5.1% | ||||||
| ugc00842 | 228 | 4.4% | 509 | 8.8% |
4. Optical Properties
| NameaaAll quantities given here are calculated for galaxies inside . | ||||||
|---|---|---|---|---|---|---|
| (km/s) | () | |||||
| rxj0029 | 16 | 434 | 3.09 | |||
| rxj1505 | 13 | 242 | 1.98 | |||
| ugc00842 | 16 | 439 | 1.93 |
The optical data are taken from the Sloan Digital Sky Survey (SDSS) DR5 release Adelman-McCarthy et al. (2005). We note that the SDSS magnitudes have been found to be underestimated for bright galaxies as a result of the background subtraction technique utilized by the SDSS photometric pipeline Lauer et al. (2007); Bernardi et al. (2007). Thus, we have corrected the petrosian magnitudes using the technique described in von der Linden et al. (2007). These corrections are between 0.1 and 0.2 magnitudes in the and -bands. We have also applied extinction corrections and k-corrections using 333http://cosmo.nyu.edu/blanton/kcorrect/ version v4_1 Blanton et al. (2003). To compare to the literature we transform the SDSS magnitudes to using the transformations given in Fukugita et al. (1996).
We calculate velocity dispersions for our groups using galaxies with available spectral information (see Table 4). For a consistency check we estimated using Gigardi et al. (1998); Khosroshahi et al. (2007):
| (3) |
values obtained this way are within 20% from the values we get from the X-ray profiles (Table 3), and therefore in good agreement considering the uncertainties in both estimations.
5. Discussion and Conclusions
Hierarchical structure formation theory predicts the formation of larger galaxies through mergers of smaller galaxies. Studies of the largest galaxies provide us with a sensitive test for these predictions. The merger rates depend on masses of merging galaxies and on the impact parameter at first encounter. Under the usual assumption of an isothermal spherical model for each galaxy and a circular orbit for the smaller halo, the infall time can be estimated as D’Onghia et al. (2005):
| (4) |
where is an impact parameter, and and are characteristic circular velocities for the main halo and the satellite, correspondingly. One conclusion from this formula is that the mergers are more efficient in groups ( 700 km/s), than in rich clusters ( 1400 km/s). Another conclusion is that galaxies with 250 km/s merge faster than dwarf galaxies. For mergers along filaments with 10 kpc, a deficit of galaxies is expected within the groups of mass 1013 – 10 dominated by a single giant elliptical galaxy. While this model explains the existence and properties of the observed fossil groups and OLEGs, we would like to point out that there is no clear physical justification to define a magnitude gap observed in such systems at some particular level. In this dynamical sense, the fossil group criteria discussed in the literature Jones et al. (2003) seem to be rather arbitrary. Recent statistical studies of SDSS galaxy groups Yang et al. (2007) confirm that the magnitude gap distribution is smooth and exhibits no special features at 2. There is no clear guidance for the choice of other selection criteria, like the radius of the optical search for galaxies and the acceptable range of redshifts. In fact, Santos et al. (2007) applied different cuts to SDSS data and came to lists of 6 to 34 candidates. Exploring the parameter space may be more fruitful in this situation than by setting particular cuts and limits.
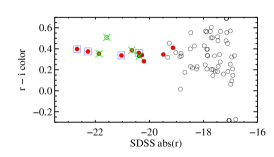
The central galaxy of the group rxj1505 is much brighter than the others in the group, however, the absolute difference in magnitudes between the first and second brightest galaxy is 1.69, which is not enough to satisfy the commonly used fossil group definition Jones et al. (2003). While this group is not exceptionally bright or massive, its mass-to-light ratio and other X-ray scaling relations are similar to fossil groups Khosroshahi et al. (2007). The magnitude gap for this system is close to that of the group Cl 1205+44, which at z=0.59 has been identified as the most distant known fossil group Ulmer et al. (2005).
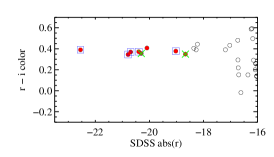
The group rxj0029 appears to be a more unusual object, as in this case the largest magnitude gap is not between the brightest and the second brightest galaxy, but between the second brightest and the rest of the group. While an absence of galaxies and a large magnitude gap between the two brightest galaxies and the third brightest galaxy (=2.47, =2.07 — for galaxies inside ) assume an evolved system, the presence of the second bright galaxy breaks the standard picture. In the optical the two brightest galaxies look rather similar, close in their luminosities, morphologies and colors (see Fig. 5, 4 and Table 4). However, the X-ray emission is clearly centered around the brightest object, with its peak at the position of the central galaxy (Fig. 5). One possibility is that in spite of similar redshifts the second brightest galaxy is X-ray faint and simply projected on the usual fossil group. However, the weighted center of the X-ray emission in rxj0029 is shifted from its peak to the direction of the second brightest galaxy. This may be an indication that the two galaxies are interacting. One may speculate that this interaction is too recent for the stars of the two galaxies to merge, but still long enough, so that the gas component is stripped from the second galaxy and moved toward the center of the group. Continuing infall of that gas may explain an excess of X-ray emission toward the second galaxy. Whether this picture is accurate or not, it demonstrates again that fossil and fossil-like groups may be a more heterogeneous population than is usually assumed.
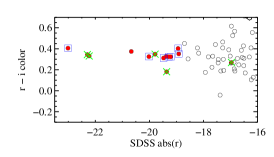
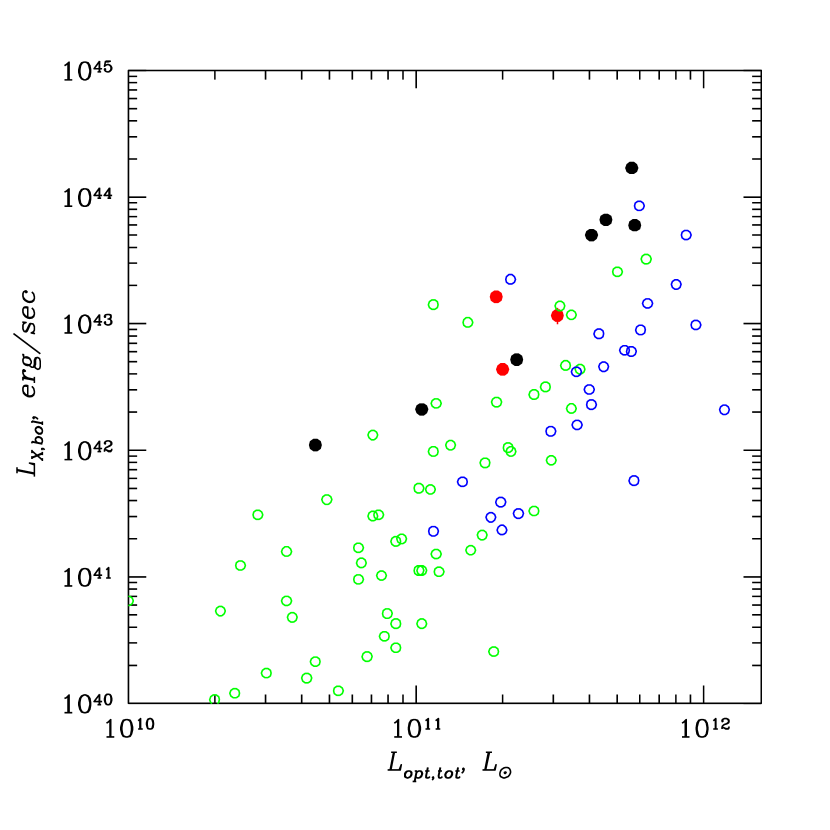
The third group, ugc00842, satisfies the standard fossil group definitions. The magnitude gap between the first and second brightest galaxy is greater than 2 (see Table 4, Fig. 4). Moreover, it holds for all member galaxies lying inside . The next bright galaxy (01:19:13.46, 01:08:41.2), for which is 525 kpc away from the central galaxy of ugc00842. The group is very bright in the X-ray relative to its optical luminosity, as is typical for fossil groups (Fig. 6). Thus, this object can be added to the list of known fossil groups (see Mendes de Oliveira et al. 2006).
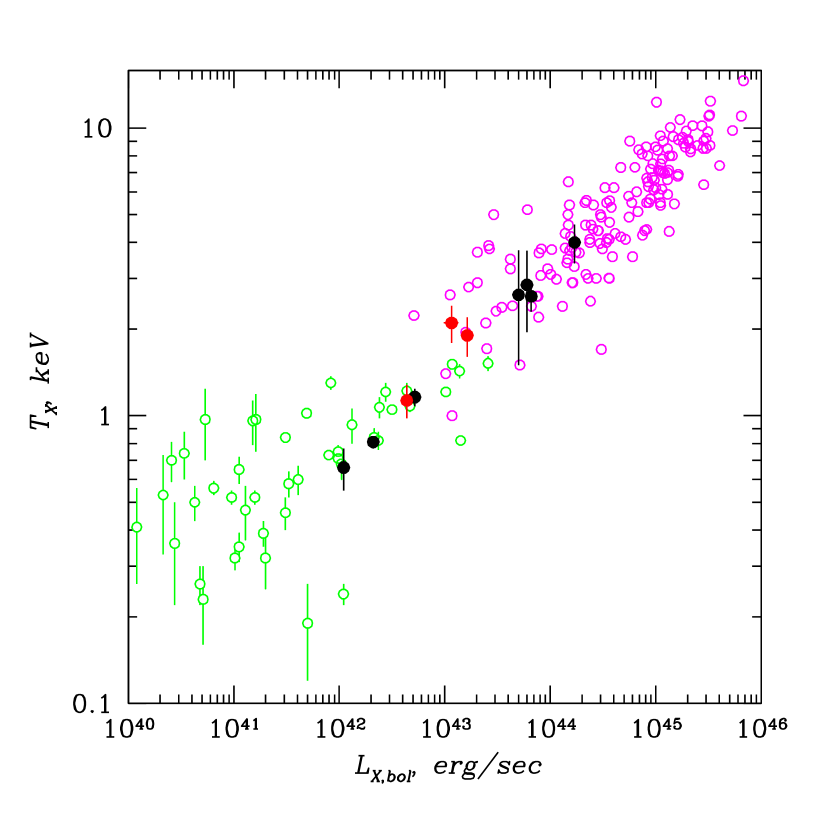
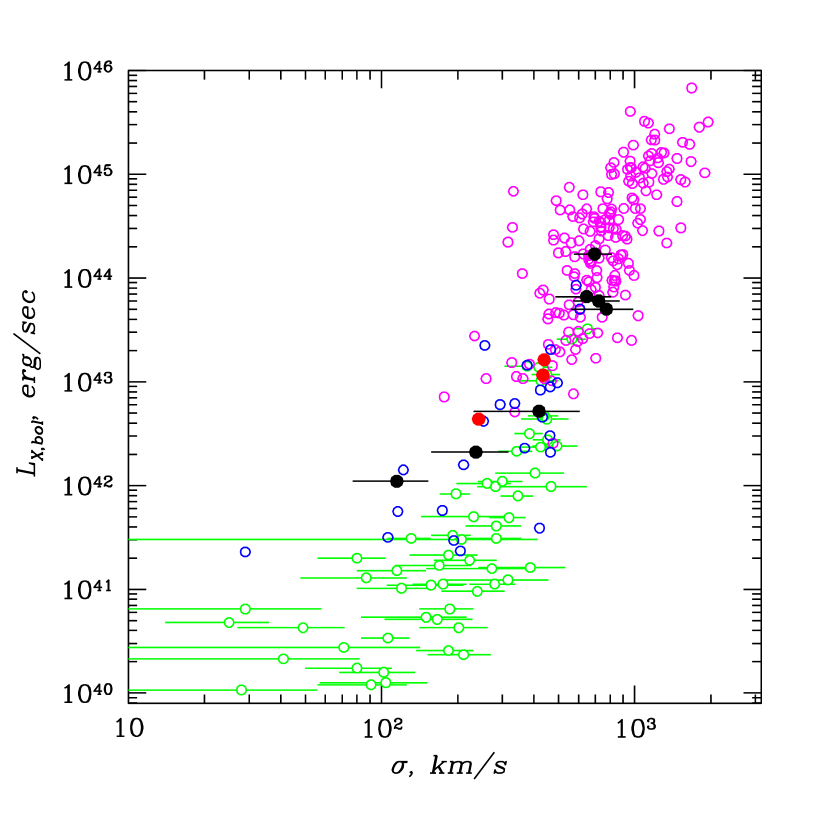
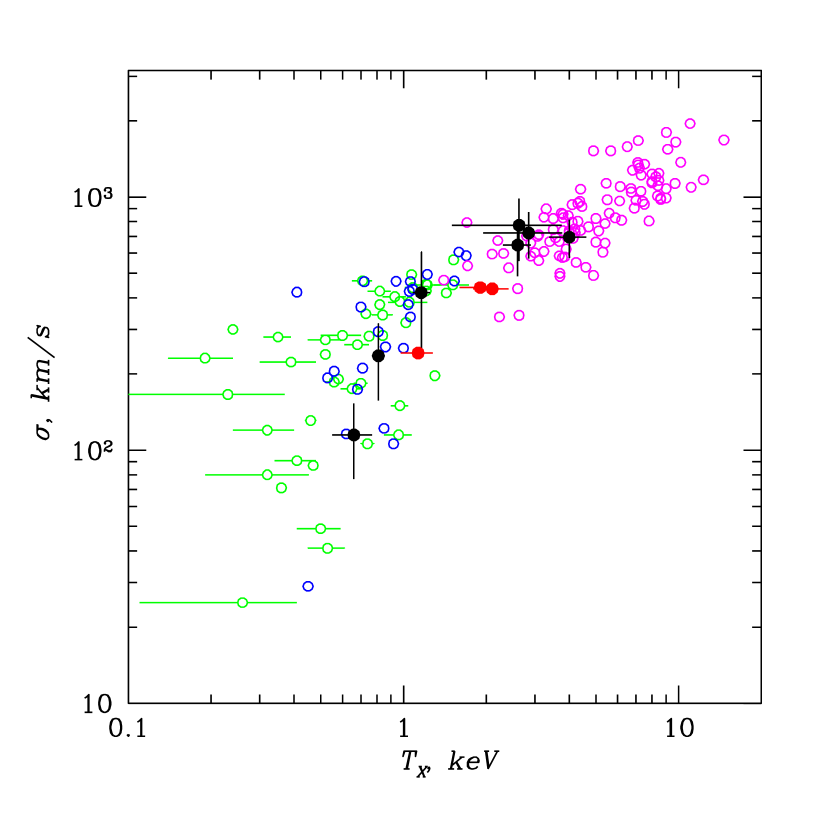
Observationally, the most notable difference between fossil groups and the general population of galaxy groups is that fossils are brighter in the X-ray at the same optical luminosity. Our selection criteria (described in Section 2.1) provided us with a range of systems including a fairly average group, an evolved group, and a fossil group. However, their locations on the optical/X-ray scaling-laws indicate that all three appear similar to the fossil group sample studied in Khosroshahi et al. (2007).
As a consequence, it may be that fossil groups, as classically defined, do not reside in a preferred location in this parameter space. Instead, it may be that the currently available group catalogs fail to accurately trace the full range of parameter space in the scaling-laws.
Historically, fossil groups are characterized by their unusual X-ray and optical properties. While these systems are supposed to be common, less than 20 of them have been studied so far. This is understandable, due to the fact that X-ray observations have so far been very spotty or shallow, and as a result it has been hard to collect adequate statistics for these objects. In contrast, optical data provided by the SDSS contains hundreds of thousands of galaxy groups suitable for this type of study. In this work we use optical selection criteria to identify possible fossil group candidates, which can then be further studied with dedicated X-ray observations. We focused on the observation of giant elliptical galaxies, which dominate a population of dwarf galaxies and are bright in X-rays because of their significant masses and large amounts of stripped intergroup gas. We confirmed that in all cases we detect an extended X-ray emission as expected from groups in the considered mass range. This allows us to conclude that the algorithm presented in this paper is quite efficient for the search of groups of galaxies dominated by giant elliptical galaxy. However, it should be tightened for the search of fossil groups.
AV thanks Oleg Kotov for useful advice in XMM-Newton data reduction. We gratefully acknowledge helpful discussions with Alexey Vikhlinin and Ann Zabludoff. We also acknowledge use of Alexey Vikhlinin’s software444http://hea-www.harvard.edu/RD/zhtools/ in our X-ray data analysis. We are thankful to Habib Khosroshahi for providing us with data points for Fig. 6. This work was supported by the LDRD program at Los Alamos National Laboratory.
References
- Abazajian et al. (2004) Abazajian, K., et al. 2004, AJ, 128, 502
- Adelman-McCarthy et al. (2005) Adelman-McCarthy, J. K., Ag eros, M. A., Allam, S. S., Anderson, K. S. J.; Anderson, S. F. et al. 2007, ApJS, 172, 634
- Arnaud et al. (2002) Arnaud, M., et al. 2002, A&A, 390, 27
- Barnes (1989) Barnes J. E., 1989, Nature, 338, 123
- Bernardi et al. (2007) Bernardi, M., Hyde, J. B., Sheth, R. K., Miller, C. J., Nichol, R. C., 2007, AJ, 133, 1741
- Blanton et al. (2003) Blanton, M. R., Brinkmann, J., Csabai, I., Doi, M. Eisenstein, D., et al. 2003, AJ, 125, 2348
- Carter & Read (2007) Carter, J. A., & Read, A. M. 2007, A&A, 464, 1155
- Cavaliere & Fusco-Femiano (1976) Cavaliere, A., & Fusco-Femiano, R. 1976, A&A, 49, 137
- Dickey & Lockman (1990) Dickey, J. M., & Lockman, F. J. 1990, ARA&A, 28, 215
- D’Onghia et al. (2005) D’Onghia, E., Sommer-Larsen, J., Romeo, A. D., Burkert, A., Pedersen, K., Portinari, L., & Rasmussen, J. 2005, ApJL, 630, L109
- D’Onghia et al. (2007) D’Onghia, E., Maccio’, A. V., Lake, G., Stadel, J., Moore, B., 2007, astro-ph/0704.2604
- Fabian et al. (1981) Fabian, A. C., Hu, E. M., Cowie, L. L., & Grindlay, J. 1981, ApJ, 248, 47
- Fukugita et al. (1996) Fukugita, M., Ichikawa, T., Gunn, J. E., Doi, M., Shimasaku, K., & Schneider, D. P. 1996, AJ, 111, 1748
- Gigardi et al. (1998) Girardi M., Giuricin G., Mardirossian F., Mezzetti M., Boschin W., 1998, ApJ, 505, 74
- Helsdon & Ponman (2003) Helsdon, S. F., & Ponman, T. J. 2003, MNRAS, 340, 485
- Jones et al. (2003) Jones, L. R., Ponman, T. J., Horton, A., Babul, A., Ebeling, H., & Burke, D. J. 2003, MNRAS, 343, 627
- Khosroshahi et al. (2004) Khosroshahi, H. G., Jones, L. R., & Ponman, T. J. 2004, MNRAS, 349, 1240
- Khosroshahi et al. (2006) Khosroshahi, H. G., Maughan, B. J., Ponman, T. J., & Jones, L. R. 2006, MNRAS, 369, 1211
- Khosroshahi et al. (2007) Khosroshahi, H. G., Ponman, T. J., & Jones, L. R. 2007, MNRAS, 377, 595
- Kotov & Vikhlinin (2005) Kotov, O., & Vikhlinin, A. 2005, ApJ, 633, 781
- Lauer et al. (2007) Lauer, T. R., Faber, S. M., Richstone, D., Gebhardt, K., Tremaine, S., et al. 2007, ApJ, 662, 808
- Mathews (2003) Mathews, W. 2003 XMM-Newton Proposal 02033402
- Mendes de Oliveira et al. (2006) Mendes de a Oliveira, C. L., Cypriano, E. S., & Sodré, L. J. 2006, AJ, 131, 158
- Mewe et al. (1995) Mewe, R., Caastra, J. S., & Liedahl, D. A. 1995, Legacy, 6, 16
- Mulchaey & Zabludoff (1999) Mulchaey, J. S., & Zabludoff, A. I. 1999, ApJ, 514, 133
- Osmond & Ponman (2004) Osmond, J. P. F., & Ponman, T. J. 2004, MNRAS, 350, 1511
- O’Sullivan et al. (2001) O’Sullivan, E., Forbes, D. A., & Ponman, T. J. 2001, MNRAS, 328, 461
- Ponman & Bertram (1993) Ponman, T. J. & Bertram, D. 1993, Nature, 363, 51
- Ponman et al. (1994) Ponman, T. J., Allan, D. J., Jones, L. R., Merrifield, M., McHardy, I. M., Lehto, H. J., & Luppino, G. A. 1994, Nature, 369, 462
- Romer et al. (2000) Romer, A. K., Nichol, R. C., Holden, B. P., Ulmer, M. P., Pildis, R. A. et al. 2000, ApJS, 126, 209
- Sanderson et al. (2003) Sanderson, A. J. R., Ponman, T. J., Finoguenov, A., Lloyd-Davies, E. J., & Markevitch, M. 2003, MNRAS, 340, 989
- Santos et al. (2007) Santos, W. A., Mendes de Oliveira, C., & Sodré, L. J. 2007, AJ, 134, 1551
- Sun et al. (2004) Sun, M., Forman, W., Vikhlinin, A., Hornstrup, A., Jones, C., & Murray, S. S. 2004, ApJ, 612, 805
- Vikhlinin et al. (1999) Vikhlinin, A., McNamara, B. R., Hornstrup, A., Quintana, H., Forman, W., Jones, C., & Way, M. 1999, ApJL, 520, L1
- von der Linden et al. (2007) von der Linden, A., Best, P. N., Kauffmann, G., White, S. D. M., 2007, MNRAS, 379, 867
- Ulmer et al. (2005) Ulmer, M. P., Adami, C., Covone, G., Durret, F., Lima Neto, G. B., Sabirli, K., Holden, B., Kron, R. G., & Romer, A. K., 2005, ApJ, 624, 124
- White et al. (1997) White, D. A., Jones, C., & Forman, W., 1997, MNRAS, 292, 419
- Wu et al. (1999) Wu, X.-P., Xue, Y.-J., & Fang, L.-Z. 1999, ApJ, 524, 22
- Yang et al. (2007) Yang, X., Mo, H. J., van den Bosch, F. C., 2007, astro-ph/0710.5096
- Yoshioka et al. (2004) Yoshioka, T., Furuzawa, A., Takahashi, S., Tawara, Y., Sato, S., Yamashita, K., & Kumai, Y. 2004, Advances in Space Research, 34, 2525