Dissection of the protostellar envelope surrounding IRAS 051730555 in L1634
Abstract
Context. The youngest protostars that power energetic outflows are surrounded by infalling and rotating envelopes that contain most of the mass of the system.
Aims. To study the properties and kinematics of the protostellar envelope surrounding the embedded source IRAS 051730555 in L1634.
Methods. We carried out VLA ammonia observations at 1.3 cm with the VLA in the D configuration to map the gas towards the core of L1634.
Results. The NH3 emission towards IRAS 051730555 is resolved and shows two components clearly distinguishable morphologically: a cross-like structure, roughly elongated in the direction of the HH 240/241 outflow and associated with IRAS 051730555, plus an arc-like stream elongated towards the north. The properties and kinematics of the gas suggest that the origin of the cross-like morphology could be the interaction between the outflow and the envelope. A more compact and flattened structure, which could be undergoing rotation about the axis of the outflow, has been detected towards the center of the cross-like envelope. The northern stream, which has properties and velocity different from those of the cross-like envelope, is likely part of the original cloud envelope, and could be either a quiescent core that would never form stars, or be in a prestellar phase.
Key Words.:
ISM: individual: L1634, HH 240/241, IRAS 057130555 – ISM: jets and outflows – stars: circumstellar matter – stars: formation – radio lines: ISM1 Introduction
The youngest protostars, which are associated with energetic molecular bipolar outflows, are deeply embedded in circumstellar gas and dust material. Theory outlines a scenario where a central object is surrounded by an infalling and rotating envelope that contains most of the mass (e.g. Larson larson69 (1969); Adams et al. adams87 (1987); see Saigo et al. saigo08 (2008) and references therein for recent simulations of rotating and collapsing cores). This infalling material is accreted onto the central protostar funneled through a circumstellar disk that grows as the system evolves (e.g. Shu et al. shu87 (1987)). Hence, infalling, outflowing and rotation motions take place simultaneously in such an extremely young environment, making the morphology and kinematics of such regions very complex.
L1634 is a bright-rimmed cloud, SFO 16, associated with Barnard’s Loop (Sugitani et al. sugitani91 (1991); De Vries et al. devries02 (2002)). It is a small, isolated dark cloud located to the west of the Orion A cloud, at a distance of 460 pc (Bohigas et al. bohigas93 (1993)). The cloud has been proposed to be either a remnant of the molecular material from which the nearby Orion OB1 association formed, or a cloud pushed to its present location by the pressure associated with energetic events accompanying the evolution of the OB association (Maddalena et al. maddalena86 (1986)). Near-infrared observations show that the cloud contains two H2 bipolar jets (Hodapp & Ladd hodapp95 (1995)). One of these jets, HH 240/241 (RNO 40), is a spectacular and powerful bipolar flow (Hodapp & Ladd hodapp95 (1995); Davis et al. davis97 (1997); Nisini et al. nisini02 (2002); O’Connell et al. oconnell04 (2004)) that extends in the east-west direction and is driven by IRAS 051730555 (17 ; Reipurth et al. reipurth93 (1993)). This molecular outflow has been mapped in CO by Lee et al. (lee00 (2000)). The other bipolar jet only has two knotty bow shocks (knots 9 and 4; Hodapp & Ladd hodapp95 (1995)), and the near-infrared source found near the center, IRS 7 (Davis et al. davis97 (1997)), is probably the powering source of this second outflow. The continuum emission towards the core of L1634 has been mapped at centimeter, millimeter, and submillimeter wavelengths (Reipurth et al. reipurth93 (1993); Chini et al. chini97 (1997); Beltrán et al. beltran02 (2002); Morgan et al. morgan08 (2008)).
Beltrán et al. (beltran02 (2002)) model the circumstellar dust emission around IRAS 051730555, and conclude that the infrared source traces an embedded young stellar object still in its infall phase. These authors classify the source as a Class 0 object, based on the infall rate estimate, the high ratio of submillimeter-to-bolometric luminosity, the circumstellar mass estimates, the non-detectability of the source at near-infrared wavelengths (Bohigas et al. bohigas93 (1993)), and the fact that is driving a powerful outflow. However, the source has been recently detected by the Infrared Array Camera (IRAC) of the Spitzer Space Telescope at 3.6, 4.5, 5.8, and 8.0 m, as shown by the Spitzer archive. Therefore, based on the classification tests proposed by Froebrich (froebrich05 (2005)), the source would be better classify as a bordeline Class 0/I object, or maybe a Class I object.
| Transition | ||||||
|---|---|---|---|---|---|---|
| Region | () | (km s-1) | (km s-1) | (K) | (K) | |
| peak position | (1, 1) | |||||
| (2, 2) | ||||||
| cross-like envelope | (1, 1) | |||||
| (2, 2) | ||||||
| northern stream | (1, 1) | |||||
| (2, 2) |
(a) Obtained from the fit, using the CLASS package, of the magnetic hyperfine components of the spectra (corrected
for the primary beam response), towards the emission peak position, averaged over an area
of arcsec2
for the cross-like envelope, and arcsec2 for the northern stream.
(b) Intrinsic line width (FWHM) of the magnetic hyperfine components.
(c) , where is the filling factor of the
emission, the
excitation temperature of the transition, the background radiation temperature and
the intensity in units of temperature, . The filling factor has been assumed
1.
(d) Optical depth of the main line. For the (1, 1) line, the optical depths have been
obtained from the hyperfine fit. For the (2, 2) line, the optical depths have been estimated
assuming that the filling factor and the excitation temperature are the same for both
transitions.
(e) Main beam brightness temperature of the (1, 1) and (2, 2) main lines.
(f) NH3(2,2) not detected.
(g) upper limit.
In this paper we present ammonia high-angular resolution observations towards the protostellar envelope surrounding IRAS 051730555 in L1634 that improve our picture of its structure. The data constrain the physical properties of the embedded IRAS 051730555 source and of its surrounding envelope. In addition, the kinematical study of the gas allows us to infer the presence of a rotating structure towards IRAS 051730555.
2 Observations
Interferometric observations were carried out in 2000 August 27 with the Very Large Array (VLA) of the National Radio Astronomy Observatory (NRAO)111NRAO is a facility of the National Science Foundation operated under cooperative agreement by Associated Universities, Inc. in the D configuration. The ammonia (J, K) = (1,1) and (2,2) inversion transitions were observed simultaneously, at rest frequencies 23.694495 GHz and 23.722633 GHz, respectively. The phase center of the observations was , . The width of the antenna primary beam response was approximately . The resulting synthesized beam was at P.A. = 6°, with natural weighting and a 20 k taper applied to the uv data. The bandwidth was 3.125 MHz and the channel separation was 24.4 kHz, corresponding to 0.31 km s-1. Absolute flux calibration was achieved by observing 3C 147, with an adopted flux density of 1.81 Jy at 1.3 cm. The bandpass calibrator was 3C 48, and phase was calibrated by observing 0501019, which has a bootstrapped flux of 1.120.04 Jy. Reduction and analysis of the data were carried out using standard procedures in the MIRIAD, AIPS, and GILDAS software packages.

3 Results and analysis
3.1 Morphology of the NH3 emission
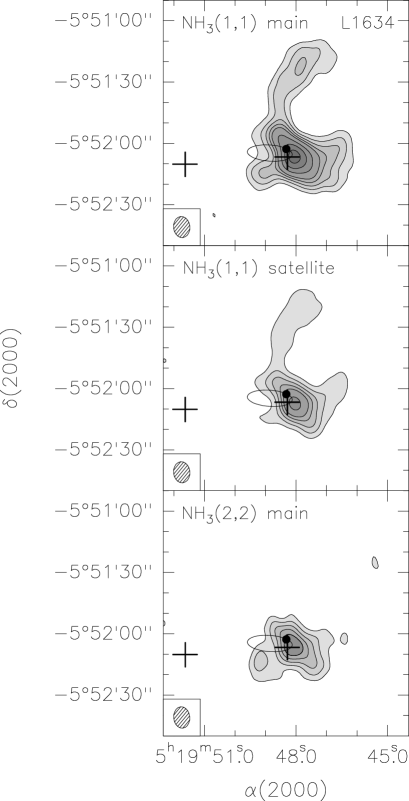
Figures 1 and 2 show the velocity channel maps respectively for the NH3 (1,1) main and inner satellite lines emission and the NH3 (2,2) main line emission around the systemic velocity, 8 km s-1 towards L1634. The emission of the NH3 (2,2) satellite lines has not been detected. The NH3 (1,1) main and inner satellite line emission averaged over the central channels, velocity interval (7, 9) km s-1, and the NH3 (2,2) main line emission averaged over the velocity interval (7.5, 8.4) km s-1 are shown in Fig. 3. As can be seen in these figures, the NH3 emission is clearly associated with the embedded source IRAS 051730555, but not with the other YSO in the region, the source IRS 7. In fact, the NH3 emission peaks at west of the submillimeter continuum position of IRAS 051730555. The submillimeter position was measured at 850 m with the James Clerk Maxwell Telescope (JCMT), and have an accuracy of 2′′. Therefore, we cannot exclude that such a displacement is due to some pointing errors of the observations. The NH3 emission peak is also displaced from the position of the 3.6 cm continuum source associated with IRAS 051730555 (Fig. 3). However, in this case, the different positions could be due to the fact that the centimeter continuum emission and NH3 are tracing different material. The NH3 (1,1) and NH3 (2,2) spectra taken at the peak position are shown in Fig. 4. Table 1 lists the fitted parameters. The fits were performed using method NH3(1,1) of the CLASS package for NH3 (1,1) and method gauss for NH3 (2,2).
The gas of the core as traced by the NH3 emission is resolved and shows two components clearly distinguishable morphologically: a cross-like structure, roughly elongated in the direction of the HH 240/241 outflow and associated with IRAS 051730555, plus an arc-like stream of material elongated towards the north. Such a northern feature, which is not visible in NH3 (2,2), has also been detected at submillimeter wavelengths as a stream of dust material emanating from the envelope surrounding IRAS 051730555 (Beltrán et al. beltran02 (2002); see Fig. 5). As can be seen in the channel maps (Fig. 1), the maximum emission of the cross-like structure is at a velocity of 7.9 km s-1, while that of the stream is at a velocity of 8.5 km s-1. In the next sections we discuss both structures in more detail.


3.1.1 The cross-like envelope
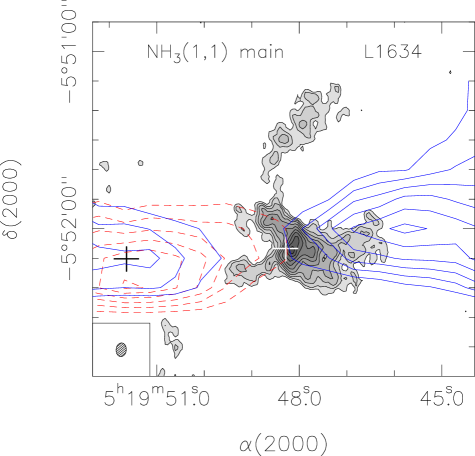
The NH3 (1,1) emission around IRAS 051730555 is not compact but extended and elongated in the direction of the CO outflow mapped by Lee et al. (lee00 (2000)), which is blueshifted towards the west and redshifted towards the east. The emission of the NH3 (1,1) main line shows a cross-like structure, clearly visible at a velocity of 8.2 and 7.9 km s-1 (see Fig. 1), and in the averaged emission map (Fig. 3), with a more prominent NE-SW arm. The deconvolved size of this cross-like structure is in the E-W direction and in the N-S direction ( and AU at the distance of the region). The cross-like structure is more evident in the maps made with higher angular resolution (see Fig. 6). Figure 6 shows the overlay of the NH3 (1,1) emission integrated over the main line, obtained with natural weighting and no taper applied to the uv data, on the blueshifted and redshifted CO (=32) integrated emission, tracing the lobes of the HH 240/241 molecular outflow. The CO (=32) data are from the JCMT archive. As can be seen in this figure, the NH3 (1,1) extended emission clearly traces the two arms of the cross, while towards the center of the cross NH3 (1,1) traces a more compact and flattened structure elongated along a north-south (NW-SE) direction. This compact structure has a deconvolved size of ( AU) at a P.A. of °. This kind of cross-like morphology has also been mapped towards other low-mass YSOs, such as L1551-IRS5 (Fuller et al. fuller95 (1995)), B5-IRS1 (Langer et al. langer96 (1996)), L1157 (Beltrán et al. beltran04 (2004)), HH 212 (Wiseman et al. wiseman01 (2001)), or RNO 43 and L1228 (Arce & Sargent arce06 (2006)).
The NE-SW arm of the cross appears more prominent than the other arm. In fact, the NH3 (1,1) satellite line and NH3 (2,2) emission traces mainly this NE-SW arm (see Figs. 1, 2 and 3), although some emission from what would be the rest of the cross-like structure is also visible at a low-emission level. As a matter of fact, the NH3 (2,2) emission shows an emission clump towards the southeast. This elongated NE-SW arm has a deconvolved length of (18400 AU at the distance of the region).
3.1.2 The northern stream
The northern arc-like stream, which is emanating from the envelope surrounding IRAS 051730555, is more diffuse than the cross-like envelope. The stream is clearly traced by the NH3 (1,1) main and satellite lines but not by the NH3 (2,2) line. This could be due to the physical conditions of the stream. As can be seen in Fig. 1, the stream is visible for velocities redshifted with respect to the systemic velocity of km s-1, which would indicate a slightly different velocity for the stream and the envelope surrounding IRAS 051730555. This stream has a deconvolved length of ( AU at the distance of the region).
The NH3 (1,1) and NH3 (2,2) spectra integrated over the contour level area ( arcsec2) towards this northern stream, which includes all the emission, are shown in Fig. 4. Table 1 lists the fitted parameters.
| Deconvolved size | Mass | ||||||
|---|---|---|---|---|---|---|---|
| Region | (arcsec) | (pc) | (K) | (K) | (1022 cm-2) | (103 cm-3) | () |
| cross-like envelope | 13 | 5.6 | 7.2 | 11 | |||
| northern stream | 8 | 9 | |||||
(a) See Sect. 3.2 for the method of derivation of the parameters.
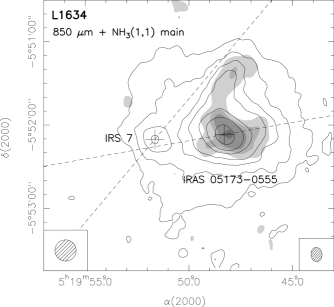
As already mentioned, such a northern feature has also been detected at 450 and 850 m wavelengths as a stream of dust material emanating from the envelope surrounding IRAS 051730555 (Beltrán et al. beltran02 (2002)). In fact, as can be seen in Fig. 5, where the NH3 (1,1) emission averaged over the main line overlaps the 850 m continuum emission (Beltrán et al. beltran02 (2002)), there is a remarkable agreement between the gas and the dust emission towards the source IRAS 051730555 and the northern stream.
3.2 Mass of the gas
The physical parameters of the cross-like envelope and the northern stream are given in Table 2. The rotational temperature, , was derived, following Ho & Townes (ho83 (1983)), from the ratio of the ammonia (1, 1) and (2, 2) column densities (derived taking into account the opacity of the lines and assuming the same excitation temperature for both NH3 (1,1) and NH3 (2,2)). The kinetic temperature, , was estimated from , following Tafalla et al. (tafalla04 (2004)). The average H2 column density was calculated from Eq. (A15) of Ungerechts et al. (unge86 (1986)), and assuming a [H2]/[NH3] abundance ratio of (see Anglada et al. anglada95 (1995) for a discussion on NH3 abundances). The H2 volume density, which is a lower limit, was derived from the two-level model (Ho & Townes ho83 (1983)), assuming a filling factor . The excitation temperature, , adopted is 5 K for the cross-like envelope, and 4.4 K for the northern stream. It should be noted that the value of could be affected by the assumption that is one. The NH3 emission of the northern stream appears more diffuse, and therefore, such an assumption is probably correct. On the other hand, the emission of the cross-like envelope could be more clumpy, which would imply that could be smaller than 1. In such a case, should be higher than the value derived for the envelope. However, the higher angular resolution map (Fig. 6), shows that the NH3 (1,1) emission is not very clumpy, which suggests that for the cross-like envelope cannot be much different of 1. The total mass of the cross-like envelope and the northern stream (see Table 2) was calculated from the average H2 column density and the observed (not deconvolved) area of each region, and assuming a mean molecular mass per H2 molecule of , which corresponds to a 10% Helium abundance.
As can be seen in Table 2, the average value of for the northern stream is 9 K. This suggests that the stream does not require an internal source of heating, and thus, it could be a quiescent structure or a prestellar core with no star(s) forming inside yet. Therefore, the different average value for the cross-like envelope and the northern stream suggests that NH3 could be tracing different material with different properties (see next section for a more detailed analysis). The mass derived from the ammonia observations is for the cross-like envelope and for the northern stream. The circumstellar mass estimated by integrating the submillimeter continuum intensity distribution over a region of 80′′ in diameter around IRAS 051730555 is quite similar, 3–9 , depending on the opacity law used (Beltrán et al. beltran02 (2002)). Such a region includes all the emission from the cross-like envelope and part of the northern stream.
4 Discussion
4.1 Properties of the emission
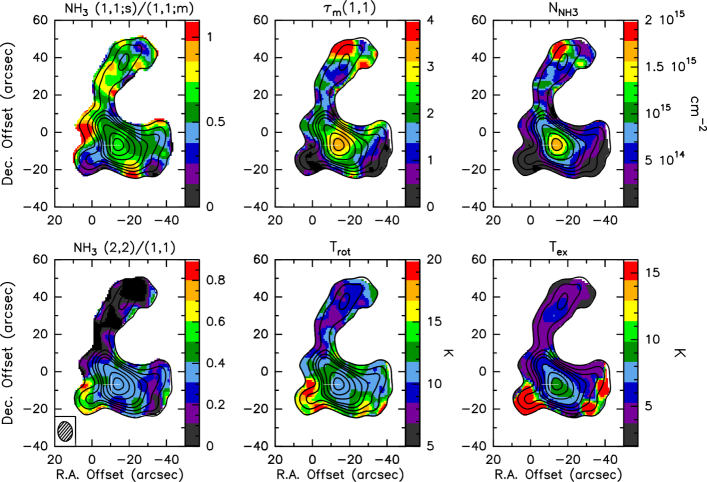
Figure 7 shows a map of the NH3 (1,1) inner satellite/main intensity ratio, the optical depth of the main quadrupole hyperfine component for the NH3 (1,1) line, , the ammonia total column density, (NH3), the (2,2)/(1,1) intensity ratio, , and towards L1634. The , (NH3), , and maps were computed by fitting the NH3 (1,1) and NH3 (2,2) spectra at each position (pixel) in the core, while the NH3 (1,1) satellite/main intensity ratio and (2,2)/(1,1) intensity ratio maps were obtained directly from the emission maps. For the sake of comparison, the NH3 (1,1) emission averaged over the main line is also shown in Fig. 7 as the underlying contours.
The properties of the cross-like envelope and of the northern stream are somewhat different. The opacity peaks at a value of 3.5 for the cross-like envelope towards the IRAS 051730555 position, while the maximum is 2 in the northern stream. This difference in opacity is also visible in the NH3 (1,1) inner satellite/main intensity ratio map. The difference between the envelope and the stream is less evident in this map. However, it is well known that the satellite hyperfine components of NH3 may exhibit non-LTE effects (e.g. Stutzki & Winnewisser stutzki85 (1985)), which would influence the satellite/main intensity ratio. There are also some differences in inside the cross-like envelope itself. The NE and NW edges of the cross appear optically thicker than the SE and SW ones. In fact, the emission towards the latter ones is the most optically thin in the whole region. It should be also noted the presence of an “optically thick spot” in the top left of the northern stream, not visible in the NH3 (1,1) inner satellite/main intensity ratio map probably due to non-LTE effects. As the spot is near the edge of the map, we checked on the quality of the spectra and the fits, which seems to be fine. The optically thicker emission in that area translates to higher values of (NH3) (see Fig.7). This enhancement of the opacity could be indicating the presence of an embedded source, a possibility already suggested by Beltrán et al. (beltran02 (2002)) based on the spectral index of the dust emission towards the northern part of the stream (see their Fig. 6). We checked the 2MASS catalog and the Spitzer MIPS and IRAC archive searching for hints of infrared embedded protostars but found none. Therefore, this suggests that this northern condensation does not contain any embedded source.
As can be seen in Fig. 7, (NH3) is also different towards IRAS 051730555 than towards the northern stream. (NH3) has a maximum value of 1.8 cm-2 towards IRAS 051730555, and of 1.1 cm-2 towards the stream. Again, there are some differences between the NE and NW edges of the cross-like envelope and the SE and SW ones. (NH3) towards the northern “optically thick spot” in the stream is 3.0 cm-2.
has a maximum value of 13 K towards the IRAS 051730555 source in the cross-like envelope, and of 10.5 K towards the northern stream. The difference in temperatures between the two structures is more evident in the NH3 (2,2)/(1,1) intensity ratio map. As can be seen in Fig. 7, this ratio is 0.4 towards the IRAS 051730555 position, and 0.09 towards the stream. The NH3 (2,2)/(1,1) ratio is very sensitive for temperatures around 10 K. For temperatures below 10 K, the (2,2) line will become very faint, because of the energy above ground for the (2,2) state. Therefore, the fact that the (2,2)/(1,1) ratio is so low for the stream, clearly indicates that it has a very cold temperature (10 K). In fact, Figs. 2 and 3 show that the NH3 (2,2) emission is not detected towards the stream at a level. As mentioned in the previous section, such a cold temperature suggests that there is no internal source of heating in the northern stream, and that the structure could be a prestellar core or a quiescent cloud formed by gas that is being dispersed. The value of estimated towards IRAS 051730555 is consistent with those found towards other low- intermediate-mass star-forming regions (e.g. Jijina et al. jijina99 (1999)). The values of towards the cross-like envelope are consistent with the kinetic temperature of 14 K, derived towards IRAS 051730555 from the CO (=10) brightness temperature averaged over a region (Lee et al. lee00 (2000); Beltrán et al. beltran02 (2002)). Note that such a large region includes emission from the northern stream as well. In Fig. 7 a considerable enhancement of is also visible towards the SE (peak 24 K) and SW (peak 23 K) edges of the cross. These areas correspond with the most optically thin regions, and hence, where the best estimate of is obtained. It should be mentioned that we checked that the signal-to-noise ratio of the spectra was high enough to properly estimate .
Finally, has a peak value of 9.3 K towards the IRAS 051730555 source in the cross-like envelope, and of 6.5 K towards the northern stream. Therefore, also appears to be different in both structures. The estimated in both regions is slightly lower than . As already mentioned in Sect. 3.2, this could mean that the gas is beam diluted. Figure 7 shows that is –15 K towards the SE edge and the western side of the cross-like envelope.
4.2 Kinematics of the gas
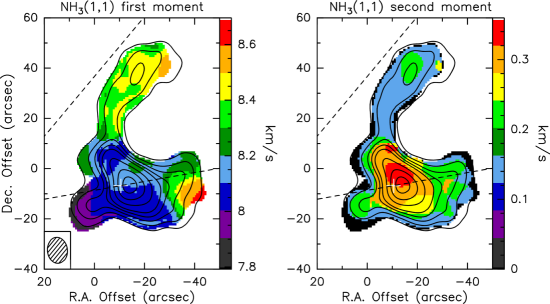
Figure 8 shows the first-order moment map (intensity weighted mean ), and the second-order moment (velocity dispersion) of the NH3 (1,1) main line towards L1634. As can be seen in this figure, the velocity towards the cross-like envelope is quite different from that towards the northern stream. The northern stream seems to have a velocity of 8.3–8.5 km s-1. On the other hand, the cross-like envelope, or at least the gas towards the IRAS 051730555 source position, seems to have a lower velocity of 8–8.2 km s-1. In addition, the velocity is different for different parts of the cross-like envelope. In particular, the SE cross arm and the western side of the envelope are clearly at a velocity different from the rest of the envelope. Notice that these areas are the same that show different properties, such as (1,1), , or . A possible explanation for this could be that these parts of the envelope are tracing material that is being swept up or disturbed by the molecular outflow powered by IRAS 051730555. As can be seen in Fig. 6, the NH3 (1,1) integrated emission, especially the eastern side of the cross-like envelope, seems to be associated with the edges of the HH 240/241 outflow. However, one should notice that while the cross-like envelope emission is blueshifted towards the SE and redshifted towards the west (see Fig. 8), the outflow emission is blueshifted towards the west and redshifted towards the east (see Fig. 6). If the velocity of the NH3 material is caused by the molecular outflow, dragging out the gas of the envelope, one would expect to have increasing (or decreasing) in the same direction for the outflow and for the envelope. The high elongation of the outflow, the spatial and velocity separation of the outflow lobes, and the relatively small velocity width of the outflow suggest that the system is in the plane of the sky. Therefore, one can rule out a possible face-on orientation of the envelope to explain the fact that increases (or decreases) in opposite directions for the outflow and the envelope. The most likely explanation for this is a combined effect of a large scale velocity gradient and the pushing by the outflow.
The second-order moment map (Fig. 8) shows that the velocity dispersion increases towards the position of the IRAS 051730555 source at the center of the cross-like envelope. As can be seen in this map, the northern stream is hardly perturbed, as the line width of NH3 (1,1) is km s-1 across it. The maximum velocity dispersion of the northern stream is km s-1, compared to km s-1, which is the value measured towards the IRAS 051730555 position. This clearly suggests that the northern arc-like stream is not material that is being entrained by the H2 SE-NW outflow (Hodapp & Ladd hodapp95 (1995)) detected in the region. Most likely this northern stream is part of the original cloud envelope, within which the embedded IRAS 051730555 source has formed (see discussion in Sect. 4.4).
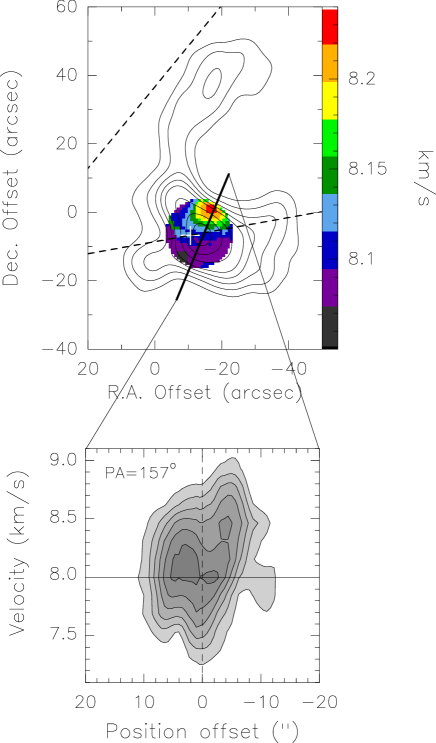
Wiseman et al. (wiseman01 (2001)) have detected in NH3 a rotating envelope perpendicular to the jet in the HH 212 region, which is quite similar to L1634. Therefore, we checked for possible rotation towards the position of the embedded IRAS 051730555 source. The presence of rotation towards IRAS 051730555 is not evident in Fig. 8. However, its signature could be masked by the kinematics of the large envelope. We searched for rotation in a region of 10′′ in radius around the NH3 peak, which corresponds to a radius of 5000 AU at the distance of the source. Figure 9 shows the first-order moment map of the NH3 (1,1) inside this region. As can be seen in this figure, there is a clear velocity gradient along a well defined direction, P.A. 157, coincident with the direction of the compact and flattened structure detected with the higher angular resolution maps (see Sect. 3.1.1 and Fig. 6). Figure 9 also shows the position-velocity (PV) diagram of the NH3 (1,1) main line emission, for the maps made with natural weighting without tapering and with the highest spectral resolution, along the direction with P.A. = 157°. The velocity gradient is of about 3.4 km s-1 pc-1, which is slightly smaller than that of 4–5 km s-1 pc-1 found by Wiseman et al. (wiseman01 (2001)) in HH 212. This velocity gradient could be indicative of rotation of the compact core.
The dynamical mass, , is the minimum mass for the system to be gravitationally bound. can be derived from the expression , where is the rotational velocity, is the radius of the envelope, and is the inclination angle assumed to be 90 for an edge-on envelope. In this case, is (5000 AU), is 0.075 km s-1 (assumed to be half of the velocity shift measured over the extent of 104 AU), and the value of is 0.03/ . The mass of the gas inside this region of 10′′ in radius is 4 . Regarding the stellar mass, Beltrán et al. (beltran02 (2002)) estimated a mass of 2.5 by assuming that IRAS 051730555 is on the birth line, that its bolometric luminosity (17 ) is only stellar, and by using Palla & Stahler (palla93 (1993)) evolutionary tracks. Therefore, the fact that is much lower (unless the inclination angle is ) than the total mass (stellar+gas) of 6.5 suggests that the motion is gravitationally bound. The virial mass, , has been estimated from the line width of 0.53 km s-1inside an area of in radius, assuming a spherical envelope with a power-law density distribution , with –1.5, and neglecting contributions from magnetic field and surface pressure (see Eq. 5 of Beltrán et al. beltran06 (2006)). is 0.8–1.0 , which is also much smaller than the mass of the gas inside this 10′′ central region. This suggests that the material of the envelope is sub-virial, and therefore, that the central part of the envelope might be unstable and undergoing collapse. This is in agreement with the model of the envelope around IRAS 051730555, based on dust emission, proposed by Beltrán et al. (beltran02 (2002)). These authors model the radial intensity profiles of the extended dust emission at 850 and 450 m by adopting power-law temperature and density distributions, and find that the best fit is achieved with a multiple-power law that for has , that is, a free-fall collapse density distribution. Therefore, both the estimated dynamical parameters and the dust emission indicate that the envelope surrounding IRAS 051730555 seems to be still collapsing.
Following Ohashi et al. (ohashi97 (1997)), we calculated the specific angular momentum , defined as , where is the velocity of rotation at the radius . For the IRAS 051730555 envelope, we considered 0.075 km s-1 at = (0.022 pc). The estimated specific angular momentum, km s-1 pc, is consistent with the constant value of 10-3 km s-1 pc found by Ohashi et al. (ohashi97 (1997)) at radii smaller than 0.03 pc for dynamically infalling envelopes and rotationally supported disks. Therefore, as suggested by the estimated dynamical parameters and the dust emission (see previous paragraph), the inner regions of the IRAS 051730555 envelope (0.022 pc), which show conserved specific angular momentum, are probably undergoing collapse.
One thing to notice in Fig. 9 is that the direction of the velocity gradient is not exactly perpendicular to the axis of the molecular outflow (P.A. 100°), which is what one expects if the core is rotating about the axis of the outflow. Nevertheless, as can be seen in the CO maps of Fig. 3 of Lee et al. (lee00 (2000)), the direction of the molecular outflow is quite difficult to determine, as it has a different position angle depending on the velocity and the distance to the powering source. In fact, as pointed out by Davis et al. (davis97 (1997)), the flow might be slowly changing direction (wiggling), since the HH 240 and HH 241 knots do not lie on the same axis. Thus, the outflow could be precessing. Therefore, although at a large scale the outflow shows a P.A. 100°, one cannot discard the possibility that the outflow closer to the powering source has a different direction and that the velocity gradient observed in NH3 is perpendicular to the outflow axis close to the IRAS 051730555 source.
4.3 Origin of the cross-like envelope
As mentioned in the previous sections, the morphology of the envelope surrounding IRAS 051730555 clearly resembles a cross, that is suggestive of interaction between the outflow and the envelope. In such a scenario, the outflow would be sweeping up envelope material, in this case traced in NH3, which would outline the beginning of the outflow conical lobes; that is, the walls of the cavity excavated by the outflow. This scenario seems to be supported by the properties and the kinematics of the gas in the cross-like envelope. In fact, the SE and SW edges of the cross have the most optically thin emission, which would be consistent with more diffuse envelope material (located farther from the embedded source) being dragged out by the outflow. is also considerably enhanced towards the SE and SW edges as compared to the temperature towards the IRAS 051730555 position (see Sect. 4.1), which also suggests interaction between the outflow and the envelope. Note that as seen in the previous section, the central part of the envelope might be unstable and undergoing collapse. Therefore, this suggests that while the envelope material located farther from the embedded IRAS 051730555 source could be being dispersed by the molecular outflow, the central part of the envelope could still be collapsing.
4.4 Origin of the northern stream
The properties and kinematics of the gas towards the northern arc-like stream suggest that it might be tracing material different from that of the cross-like envelope, or material that is being perturbed in a different way (see Sects. 4.1 and 4.2). The velocity dispersion and the low and of the gas rule out the possibility that the northern stream is material of the envelope surrounding IRAS 051730555 that has been entrained by the SE-NW H2 flow.
On the other hand, the stream could be part of the original cloud envelope. The spectral index map of the dust emission (see Fig. 6 of Beltrán et al. beltran02 (2002)) has similar values for the cross-like envelope and the northern stream, which suggests that the material in the stream has the same dust properties as the material surrounding the IRAS 051730555 source. In addition, the shape of the NH3 and the dust emission (see Fig. 5) resembles that of the cloud at a larger scale as traced in CO, C18O, and HCO+ (De Vries et al. devries02 (2002)). According to these authors, the cloud seems to be shaped by the ionizing radiation coming from Barnard’s Loop, which could also be responsible for the morphology of the NH3 and dust emission, and in particular, for the arc-like northern stream. Therefore, the stream could be a remnant of the star-formation process in L1634, which might be in a prestellar phase. Or, it could be a quiescent core, as suggested by the cold , that might never form stars and that will be finally dispersed.
5 Conclusions
We studied with the VLA at 1.3 cm, the ammonia emission towards the core of L1634, a region that contains two embedded YSOs, IRAS 051730555 and IRS 7, powering two outflows.
The NH3 emission has clearly been detected towards the young stellar object IRAS 051730555 but not towards IRS 7. The gas of the core as traced by the NH3 emission is resolved and shows two components clearly distinguishable morphologically: a cross-like structure, roughly elongated in the direction of the HH 240/241 outflow and associated with IRAS 051730555, plus an arc-like stream elongated towards the north.
The NH3 (1,1) emission clearly traces the two arms of the cross-like envelope. The deconvolved size of this cross-like structure is ( AU). The mass derived from the ammonia observations is , and 13 K. The emission of the cross-like structure is maximum at a velocity of 7.9 km s-1. The properties of the gas vary across the envelope, with two parts of the cross-like envelope clearly differentiated from the rest, the SE and the SW edges of the cross. The morphology, properties and kinematics of the gas suggest that the origin of the cross-like morphology could be the interaction between the outflow and the envelope. The outflow could be sweeping up envelope material, which would outline the beginning of the outflow conical lobes.
A more compact and flattened structure, with a deconvolved size of ( AU), has been detected towards the center of the cross-like envelope and orientated perpendicular to it, P.A. °. This structure could be undergoing rotation about the axis of the outflow, as suggested by the velocity gradient detected and the PV plot along the gradient direction. The fact that the virial mass is much smaller than the mass of the gas suggests that this flattened envelope might be unstable and undergoing collapse. The collapse is also suggested by the modeling of the dust emission and the the specific angular momentum of the inner region of the IRAS 051730555 envelope. Therefore, this suggests that while the envelope material located farther from the embedded IRAS 051730555 source could be being dispersed by the molecular outflow, the central part of the envelope could still be collapsing.
The northern stream is clearly traced by the NH3 (1,1) main and satellite lines but not by the NH3 (2,2) line. This stream has a deconvolved length of ( AU). The mass derived from the ammonia observations is , and K. The stream is visible for velocities redshifted with respect to the systemic velocity of km s-1, which would indicate a velocity for the stream slightly different from that of the envelope surrounding IRAS 051730555. The velocity dispersion of the stream is very small indicating that the gas is hardly perturbed. This arc-like stream of material, which has properties different from those of the cross-like envelope, could be a remnant of the star-formation process in L1634, and might be in a prestellar phase. Or, it could be a quiescent core, as suggested by the cold , that might never form stars and that will be finally dispersed.
Acknowledgements.
We acknowledge the anonymous referee for his/her useful comments. MTB and RE are supported by MEC grant AYA2005-08523-C03. This research has made use of the NASA/IPAC Infrared Science Archive, which is operated by the Jet Propulsion Laboratory, California Institute of Technology, under contract with the National Aeronautics and Space Administration (NASA).References
- (1) Arce, H. G., & Sargent, A. I. 2006, ApJ, 646, 1070
- (2) Adams, F. C., Lada, C. J., & Shu, F. H. 1987, ApJ, 312, 788
- (3) Anglada, G., Estalella, R., Mauersberger, R., Torrelles, J. M., et al. 1995, ApJ, 443, 682
- (4) Beltrán, M. T., Estalella, R., Ho, P. T. P., Calvet, N., Anglada, G., & Sepúlveda, I. 2002, ApJ, 565, 1069
- (5) Beltrán, M. T., Girart, J. M., & Estalella, R. 2006, A&A, 457, 865
- (6) Beltrán, M. T., Gueth, F., Guilloteau, S., & Dutrey, A. 2004, A&A, 416, 631
- (7) Bohigas, J., Persi, P., & Tapia, M. 1993, A&A, 267, 168
- (8) Chini, R., Reipurth, B., Sievers, A., Ward-Thompson, D., Haslam, C. G. T., Kreysa, E., & Lemke, R. 1997, A&A, 325, 542
- (9) Davis, C. J., Ray, T. P., Eislöffel, J., & Corcoran, D. 1997, A&A, 324, 263
- (10) De Vries, C. H., Narayanan, G., Snell, R. L. 2002, ApJ, 577, 798
- (11) Froebrich, D. 2005, ApJSS, 156, 169
- (12) Fuller, G. A., Ladd, E. F., Padman, R., Myers, P. C., & Adams, F. C. 1995, ApJ, 454, 862
- (13) Ho, P. T. P., & Townes, C. H. 1983, ARA&A, 21, 239
- (14) Hodapp, K.-W., & Ladd, E. F. 1995, ApJ, 453, 715
- (15) Jijina, J., Myers, P. C., & Adams, F. C. 1999, ApJSS, 125, 161
- (16) Langer, W. D., Velusamy, T., & Xie, T. 1996, ApJ, 468, L41
- (17) Larson, R. B. 1969, MNRAS, 145, 271
- (18) Lee, C.-F., Mundy, L. G., Reipurth, B., Ostriker, E. C., & Stone, J. M. 2000, ApJ, 542, 925
- (19) Maddalena, R. J., Morris, M., Moscowitz, J., & Thaddeus, P. 1986, ApJ, 303, 375
- (20) Morgan, L. K., Thompson, M. A., Urquhart, J. S., & White, G. J. 2008, A&A, 477, 557
- (21) Nisini, B., Caratti o Garatti, A., Giannini, T., & Lorenzetti, D. 2002, A&A, 393, 1035
- (22) O’Connell, B., Smith, M. D., Davis, C. J., Hodapp, K. W., Khanzadyan, T., & Ray, T. 2004, A&A, 419, 975
- (23) Ohashi, N., Hayashi, M., Ho, P. T. P., Momose, M. T. et al. 1997, ApJ, 488, 317
- (24) Palla, F., & Stahler, S. W. 1993, ApJ, 418, 414
- (25) Reipurth, B., Chini, R., Krügel, E., & Sievers, A. 1993, A&A, 273, 221
- (26) Saigo, K., Tomisaka, K., & Matsumoto, T. 2008, ApJ, 674, 997
- (27) Shu, F. H., Adams, F. C. & Lizano, S. 1987, ARA&A, 25, 23
- (28) Stutzki, J., & Winnewisser, G. 1985, A&A, 144, 13
- (29) Sugitani, K., Fukui, Y., & ogura, K. 1991, ApJS, 77, 59
- (30) Tafalla, M., Myers, P. C., Caselli, P., & Walmsley, C. M. 2004, A&A, 416, 191
- (31) Ungerechts, H., Walmsley, C. M., & Winnewisser, G. 1986, A&A, 157, 207
- (32) Wiseman, J., Wootten, A., Zinnecker, H., & McCaughrean. M. 2001, ApJ, 550, L87