Two characteristic energies in the low-energy antiferromagnetic response of the electron-doped high-temperature superconductor Nd2-xCexCuO4+δ
Abstract
Inelastic neutron scattering for Nd2-xCexCuO4+δ near optimal doping (, ) reveals that the dynamic magnetic susceptibility at the antiferromagnetic zone center exhibits two characteristic energies in the superconducting state: and . These two magnetic energies agree with the / and features previously observed in electronic Raman scattering, where the former is believed to indicate the maximum electronic gap and the origin of the smaller feature has remained unexplained. The susceptibility change upon cooling into the superconducting state is inconsistent with previous claims of the existence of a magnetic resonance mode near 10 meV, but consistent with a resonance at .
pacs:
74.72.Jt,74.25.Ha,78.70.NxAntiferromagnetic (AF) fluctuations might contribute to the superconducting (SC) pairing in the cuprate high-temperature superconductors. The most prominent magnetic feature observed in the SC state is the , an unusual spin-triplet () collective mode centered at the two-dimensional AF zone center r.l.u. M. Eschrig (2006). The resonance has been observed in inelastic neutron scattering (INS) experiments on several families of hole-doped cuprates: YBa2Cu3O6+δ J. Rossat-Mignod et al. (1991) and Bi2Sr2CaCu2O8+δ H. Fong et al. (1999), which are comprised of two CuO2 layers per unit cell, as well as in single-layer Tl2Sr2CuO6+δ H. He et al. (2002) and HgBa2Cu2O4+δ Gui . The origin of the resonance and of its unusual dispersion has been a topic of much recent debate M. Eschrig (2006); E. W. Carlson, D. X. Yao and D. K. Campbell (2004); F. Krüger and S. Scheidl (2004); Pre ; G. Seibold and J. Lorenzana (2006); G. S. Uhrig, K. P. Schmidt and M. Grüninger (2004); M. Vojta, T. Vojta and R. K. Kaul (2006).
Magnetic INS measurements of the electron-doped compounds have become possible only in recent years. For Nd2-xCexCuO4+δ (NCCO), such measurements have revealed a gap below K. Yamada et al. (2003), the effect of a magnetic field on this gap E. M. Motoyama et al. (2006), and the evolution with doping and temperature of the spin-correlations in the Cu-O layers P. K. Mang et al. (2004a); E. M. Motoyama et al. (2007). These measurements were possible in crystals of sufficiently large size and quality, despite the fact that the SC compounds exhibit chemical inhomogeneities and a secondary chemical phase P. K. Mang et al. (2004b). Results for electron-doped Pr0.88LaCe0.12CuO4 () S. D. Wilson et al. (2006) and NCCO () J. Zhao et al. (2007) were interpreted as indicative of a magnetic resonance with an energy of about 10 meV, suggesting that the resonance may be a universal feature of the cuprates, independent of the type of carriers.
In contrast to INS, which provides information about the magnetic degrees of freedom, electronic Raman scattering yields information about the charge dynamics. Polarization analysis has led to the identification of several characteristic energies in both hole- and electron-doped cuprates T. P. Devereaux and R. Hackl (2007); M. M. Qazilbash et al. (2005). Features observed in and symmetry have been associated with the normal state pseudogap or the SC gap, whereas the unexpected observation of a feature in symmetry has found no widely-accepted explanation. One suggestion for the hole-doped compounds is that the latter may be associated with the magnetic resonance Y. Gallais et al. (2002); M. Le Tacon, A. Sacuto, and D. Colson (2005); M. Le Tacon, Y. Gallais, A. Sacuto, and D. Colson (2006).
In this Letter, we report a detailed INS study of the low-energy dynamic magnetic susceptibility of NCCO near optimal doping (onset ). As the system is cooled into the SC state, exhibits a spectral weight shift from below to above meV, which can be described as the opening of a gap, as well as a local maximum at meV, below the gap. Remarkably, these two energies agree with those obtained from Raman scattering in / and symmetry, respectively M. M. Qazilbash et al. (2005). The larger of the two corresponds to the maximum of the non-monotonic electronic -wave gap M. M. Qazilbash et al. (2005); H. Matsui et al. (2005), whereas the lower energy scale likely indicates the presence of a resonance, consistent with the situation for the hole-doped cuprates for which the resonance is always found below . This is supported by our measurement of the temperature dependence of the susceptibility at , which reveals a monotonic increase upon cooling into the SC state. The present results, while overall consistent with prior data for electron-doped compounds, do not support the claim of the existence of a magnetic resonance at higher energies S. D. Wilson et al. (2006); J. Zhao et al. (2007).
Two NCCO crystals were grown in a traveling-solvent floating-zone furnace in an oxygen atmosphere of . To remove the excess oxygen and achieve superconductivity, the crystals were annealed for 10 h in flowing argon at , followed by 20 h in flowing oxygen at . The Ce concentration was carefully measured by inductively coupled plasma (ICP) atomic emission spectrometry on several parts cut from the crystals. The Ce concentration was found to vary both along the diameter of the sample and along the growth direction. For the primary crystal used in this study (diameter: 4 mm; mass: 6.2 g), we estimate the overall composition to be . As discussed below, the chemical inhomogeneity manifests itself as a broadening of the features observed in our experiment. The value of was determined from magnetic susceptibility measurements of two small pieces (with compositions and 0.164) cut from the ends of the crystal. Despite the somewhat different composition of the end pieces, the onset temperature of the transition is nearly the same, consistent with the maximum value of generally obtained at and near optimal doping. The second crystal was smaller (mass: 5 g) and has a nearly identical composition [ and the same value of .
The INS experiment was performed on the thermal triple-axis instrument PUMA at the FRM-II in Garching, Germany. The two samples were mounted in separate measurements inside a low-temperature displex such that the plane was parallel to the horizontal scattering plane. We used a double-focusing PG(002) monochromator, a focusing PG(002) analyzer, and a fixed final energy of with a PG filter after the sample. The energy resolution ranged from about 0.8 to 1.4 meV (FWHM) between and 12 meV. The room temperature lattice constants are , . Using a horizontally flat monochromator and analyzer, a rocking scan at the reflection indicated a mosaic of (FWHM).
Figure 1(a)-(c) shows representative transverse momentum scans below () and above () . At all energy transfers, the magnetic response remained centered at . Figure 1(a) demonstrates that at meV the normal state response is resolution-limited and the magnetic scattering disappears completely deep in the SC state, signaling the opening of a gap. On the other hand, at meV, in addition to an overall change in background scattering, a clear enhancement at is observed in the SC state [Fig. 1 (c) and (d)]. Between 3.75 and 7 meV, the intensity difference is featureless, as seen from Fig. 1(d).
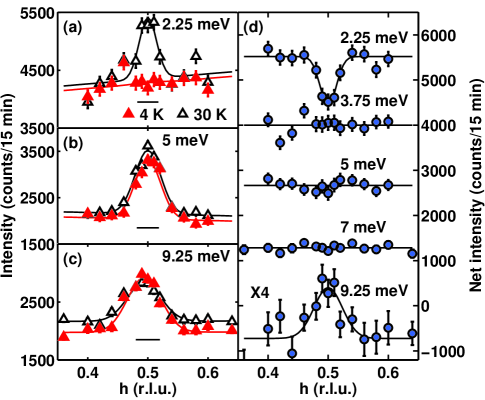
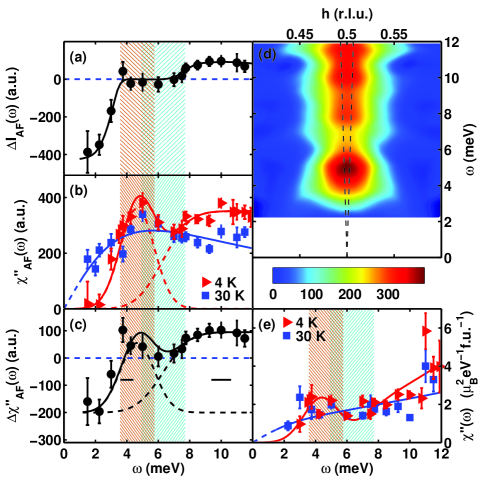
Figure 2(a) reveals a clear shift of the intensity from below 4 to above 7 meV upon cooling. The peak susceptibility at 4 and 30 K and the susceptibiliy difference between the two temperatures are shown in Fig. 2(b) and (c), respectively. Due to the change in Bose factor, the local maximum in the susceptibility difference directly results from the observed zero (within error) net peak intensity between 3.75 and 7 meV. The normal state response at 30 K is quite well described by a Lorentzian, , with relaxation rate meV. In contrast, the excitation spectrum in the SC state exhibits two characteristic energies: a maximum at 4-5 meV and a minimum at 6-7 meV. This can also be seen from the susceptibility difference in Fig. 2(c) and from the low-temperature contour plot in Fig. 2(d).
Raman scattering results for both NCCO and Pr2-xCexCuO4+δ M. M. Qazilbash et al. (2005) demonstrate a nearly linear decrease above of the energy scales in , and symmetry. Unlike for the hole-doped compounds, the energy scales and symmetry are nearly identical, suggesting that in both cases one effectively measures the maximum SC gap at the intersection of the underlying Fermi surface with the AF Brillouin zone, in between nodal and anti-nodal directions M. M. Qazilbash et al. (2005); H. Matsui et al. (2005). The chemical composition of our main NCCO sample ranges from to 0.164, which corresponds to a range of about 3 meV of these two energy scales, as indicated by the two vertical bands in Fig. 2. These ranges are in good agreement with the positions of the extrema in the low-temperature magnetic susceptibility. In order to quantify this observation of a correspondence of magnetic and electronic energy scales, we describe the 4 K data for in Fig. 2(b) by the sum of two terms: a step function centered at , describing the electronic gap, and a Gaussian centered at , describing the peculiar excitation below the gap energy. The widths of the two features are fixed, chosen to correspond to a (Gaussian) broadening due to the Ce inhomogeneity, and the fit therefore contains only two adjustable parameters: the amplitudes of the Gaussian [ (a.u.)] and of the step function [ (a.u.)]. As can be seen from Fig. 2(b), in the SC state is described in an excellent fashion based on the knowledge of electronic energy scales from Raman scattering and the sample inhomogeneity from chemical analysis. A similarly good fit is obtained for the difference data in Fig. 2(c). We note that a separate five-parameter fit of the K data yields meV, meV, and a Gaussian broadening of meV (FWHM).
The magnetic response upon entering the SC state consists of two components: a broad rearrangement of spectral weight from low energies to energies above , and an additional new component centered at . We offer two possible explanations for this second energy scale: it could either be related to the observation of a non-monotonic -wave gap M. M. Qazilbash et al. (2005); H. Matsui et al. (2005), or it may be the magnetic resonance. The non-monotonic -wave gap is characterized by a maximum away from the antinodal direction. Photoemission work on Pr1-xLaCexCuO4+δ near optimal doping suggests that the antinodal gap value is approximately 80% of the maximum gap, whereas our data give . However, it seems unlikely that a significant contribution to the low-energy magnetic response stems from the antinodal regions, since they are not spanned by the wavevector N. P. Armitage et al. (2002).
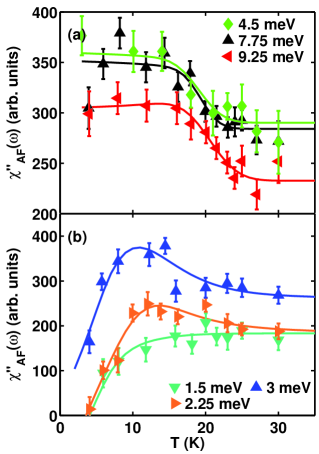
On the other hand, the low-energy feature may be the magnetic resonance. Figure 3(a) demonstrates that that a continuous enhancement of upon cooling into the SC state already exists around meV. While our data are overall consistent with Refs. S. D. Wilson et al. (2006); J. Zhao et al. (2007), these earlier results were interpreted as indicative of a resonance mode at -11 meV. This conclusion was supported by the observation that the ratio is in good agreement with results for hole-doped cuprates. However, recent work for Hg1201 revealed that the ratio is not universal Gui . Furthermore, the interpretation of the susceptibility enhancement around 10 meV as the resonance is inconsistent with the fact that the resonance in the hole-doped compounds lies below M. Eschrig (2006).
Recent STM work on Pr0.88LaCe0.12CuO4+δ () F. C. Niestemski et al. (2007) indicated that meV, significantly larger than in NCCO S. Kashiwaya et al. (1998); M. M. Qazilbash et al. (2005). Therefore, while our results are inconsistent with the existence of a resonance near 10 meV in NCCO J. Zhao et al. (2007), they are not necessarily inconsistent with the original observations of Ref. S. D. Wilson et al. (2006). It will be important to confirm the observation of a relatively large electronic gap in Pr0.88LaCe0.12CuO4+δ with other experimental methods. Furthermore, STM revealed a bosonic mode at about 10.5 meV, consistent with the enhancement of magnetic susceptibility around 10 meV in Pr0.88LaCe0.12CuO4+δ F. C. Niestemski et al. (2007). If the bosonic mode is indeed magnetic in origin, STM should locate it at in optimally-doped NCCO.
The interpretation of the feature as the resonance implies that the resonance energy agrees well with the Raman response, consistent with the suggestion for the hole-doped compounds that the latter may be associated with the magnetic resonance Y. Gallais et al. (2002); M. Le Tacon, A. Sacuto, and D. Colson (2005); M. Le Tacon, Y. Gallais, A. Sacuto, and D. Colson (2006). However, this connection is not conclusive and the origin of the peak is still unclear.
Figure 3(b) reveals a non-trivial non-monotonic temperature dependence at lower energies. The enhancement of at meV and the non-monotonic temperature dependece at and 3 meV appear to be the joint effect of the opening of the gap and the formation of a new excitation below in the SC state. We note that the interpretation of the low-energy response in terms of a gap and an in-gap excitation requires a reinterpretation of the results of Refs. K. Yamada et al. (2003); E. M. Motoyama et al. (2006) in which the low-energy edge of the magnetic susceptibility in the SC state was directly associated with a gap.
Figure 2(e) shows the local susceptibility, . In the normal state, increases monotonically from zero at meV to about eV-1f.u.-1 at 12 meV. In the SC state, exhibits a local maximum of eV-1f.u.-1 at and reaches eV-1f.u.-1 at 12 meV. The estimated mean-square fluctuating moment integrated up to 12 meV is 0.019 and 0.021 f.u.-1 at 30 and 4 K, respectively. Although the difference is only 10%, the data indicate that integration somewhat beyond 12 meV would lead to a larger difference. Unfortunately, the regime just above 12 meV is inaccessible due to high background scattering from Nd3+ crystal field excitations. This suggets that the susceptibility enhancement above and the feature cannot both be compensated for by the low-energy spectral weight loss in the superconducting state, and that some high-energy (above 12 meV) spectral weight must shift to lower energy to satisfy the total moment sum rule. If the meV feature were not present, the superconductivity-induced local susceptibility enhancement above (f.u.-1 up to 12 meV) would be fully covered by the spectral weight depletion in the gap (f.u.-1). We estimate the momentum- and energy-integrated weight of the low-energy feature to be f.u. This value is somewhat smaller (by a factor of 3-10) than the weight of the resonance in the hole-doped compounds M. Eschrig (2006).
While the magnitude of is consistent with work on Pr0.88LaCe0.12CuO4+δ S. D. Wilson et al. (2006); F. Krüger et al. (2007), the SC and normal state responses [both and ] of the latter system do not approach zero at low energies. The magnetic gap is an expected feature of the excitation spectrum, and it is also observed in hole-doped YBa2Cu3O6+δ YBC and La2-xSrxCuO4 K. Yamada et al. (1995) near optimal doping. We speculate that, as in early measurements on hole-doped La2-xSrxCuO4 Ear , disorder effects might mask the underlying low-energy response of Pr1-xLaCexCuO4+δ.
In summary, careful analysis of new neutron scattering data for electron-doped Nd2-xCexCuO4+δ reveals quantitative agreement for the low-energy magnetic response at the antiferromagnetic wave vector with electronic energy scales from Raman scattering. The larger of the two magnetic energies corresponds to the electronic gap maximum, while the smaller scale might possibly be the magnetic resonance.
This work was supported by the DOE under Contract No. DE-AC02-76SF00515 and by the NSF under Grant. No. DMR-0705086.
References
- M. Eschrig (2006) M. Eschrig, Adv. Phys. 55, 47 (2006).
- J. Rossat-Mignod et al. (1991) J. Rossat-Mignod et al., Physica C 185, 86 (1991).
- H. Fong et al. (1999) H. Fong et al., Nature 398, 588 (1999).
- H. He et al. (2002) H. He et al., Science 295, 1045 (2002).
- (5) G. Yu et al., arXiv:0810.5759.
- E. W. Carlson, D. X. Yao and D. K. Campbell (2004) E. W. Carlson, D. X. Yao and D. K. Campbell, Phys. Rev. B 70, 064505 (2004).
- F. Krüger and S. Scheidl (2004) F. Krüger and S. Scheidl, Phys. Rev. B 70, 064421 (2004).
- (8) I. Sega and P. Prelovšek, Phys. Rev. B 73, 092516 (2006); P. Prelovšek and I. Sega, Phys. Rev. B 74, 214501 (2006).
- G. Seibold and J. Lorenzana (2006) G. Seibold and J. Lorenzana, Phys. Rev. B 73, 144515 (2006).
- G. S. Uhrig, K. P. Schmidt and M. Grüninger (2004) G. S. Uhrig, K. P. Schmidt and M. Grüninger, Phys. Rev. Lett. 93, 267003 (2004).
- M. Vojta, T. Vojta and R. K. Kaul (2006) M. Vojta, T. Vojta and R. K. Kaul, Phys. Rev. Lett. 97, 097001 (2006).
- K. Yamada et al. (2003) K. Yamada et al., Phys. Rev. Lett. 90, 137004 (2003).
- E. M. Motoyama et al. (2006) E. M. Motoyama et al., Phys. Rev. Lett. 96, 137002 (2006).
- P. K. Mang et al. (2004a) P. K. Mang et al., Phys. Rev. Lett. 93, 027002 (2004a).
- E. M. Motoyama et al. (2007) E. M. Motoyama et al., Nature 445, 186 (2007).
- P. K. Mang et al. (2004b) P. K. Mang et al., Phys. Rev. B 70, 094507 (2004b).
- S. D. Wilson et al. (2006) S. D. Wilson et al., Nature 442, 59 (2006).
- J. Zhao et al. (2007) J. Zhao et al., Phys. Rev. Lett. 99, 017001 (2007).
- T. P. Devereaux and R. Hackl (2007) T. P. Devereaux and R. Hackl, Rev. Mod. Phys. 79, 175 (2007).
- M. M. Qazilbash et al. (2005) M. M. Qazilbash et al., Phys. Rev. B 72, 214510 (2005).
- Y. Gallais et al. (2002) Y. Gallais et al., Phys. Rev. Lett. 88, 177401 (2002).
- M. Le Tacon, A. Sacuto, and D. Colson (2005) M. Le Tacon, A. Sacuto, and D. Colson, Phys. Rev. B 71, 100504(R) (2005).
- M. Le Tacon, Y. Gallais, A. Sacuto, and D. Colson (2006) M. Le Tacon, Y. Gallais, A. Sacuto, and D. Colson, J. Phys. and Chem. Solids 67, 503 (2006).
- H. Matsui et al. (2005) H. Matsui et al., Phys. Rev. Lett. 95, 017003 (2005).
- P. Bourges, H. Casalta, A. S. Ivanov, and D. Petitgrand (1997) P. Bourges, H. Casalta, A. S. Ivanov, and D. Petitgrand, Phys. Rev. Lett. 79, 4906 (1997).
- N. P. Armitage et al. (2002) N. P. Armitage et al., Phys. Rev. Lett. 88, 257001 (2002).
- F. C. Niestemski et al. (2007) F. C. Niestemski et al., Nature 450, 1058 (2007).
- S. Kashiwaya et al. (1998) S. Kashiwaya et al., Phys. Rev. B 57, 8680 (1998).
- F. Krüger et al. (2007) F. Krüger et al., Phys. Rev. B 76, 094506 (2007).
- (30) P. Bourges et al., Science 288, 1234 (2000); P. Dai et al., Phys. Rev. B 63, 054525 (2001).
- K. Yamada et al. (1995) K. Yamada et al., Phys. Rev. Lett. 75, 1626 (1995).
- (32) See Ref. [31], and references therein.