TURBULENT DYNAMICS IN ROTATING HELIUM SUPERFLUIDS
Abstract
New techniques, both for generating and detecting turbulence in the helium superfluids 3He-B and 4He, have recently given insight in how turbulence is started, what the dissipation mechanisms are, and how turbulence decays when it appears as a transient state or when externally applied turbulent pumping is switched off. Important simplifications are obtained by using 3He-B as working fluid, where the highly viscous normal component is practically always in a state of laminar flow, or by cooling 4He to low temperatures where the normal fraction becomes vanishingly small. We describe recent studies from the low temperature regime, where mutual friction becomes small or practically vanishes. This allows us to elucidate the mechanisms at work in quantum turbulence on approaching the zero temperature limit.
, ,
1 Introduction
The transition to turbulence is the most well known example of all hydrodynamic transitions. It has been marveled for centuries, since dramatic demonstrations can be seen everywhere where a sudden change in the flow occurs, owing to a constriction in the flow geometry, for instance. For fifty years it has been known that turbulence also exists in superfluids (Vinen and Donnelly 2007), although by its very nature a superfluid should be a dissipation-free system. In many situations it is found that on the macroscopic level superfluid vortex dynamics mimics the responses of viscous hydrodynamics. This is one of the reasons why it has been thought that superfluid turbulence might provide a short cut to better understanding of turbulence in general. From the developments over the past fifty years we see that this has not become the case, superfluid turbulence is a complex phenomenon where experiments have often been clouded by other issues, especially by vortex formation and vortex pinning. Nevertheless, the topic is fascinating in its own right: When the flow velocity is increased, the inherently dissipation-free superfluid is observed to become dissipative and eventually turbulent. This is particularly intriguing in the zero temperature limit where the density of thermal excitations approaches zero and vortex motion becomes undamped down to very short wave lengths (of the order of the vortex core diameter).
There are two isotropic helium superfluids in which turbulence has been studied, namely the B phase of superfluid 3He (3He-B) and superfluid 4He (4He II). In the anisotropic A phase of superfluid 3He (3He-A) dissipation is so large that conventional superfluid turbulence is not expected at the now accessible temperatures above (Finne et al. 2003). Instead rapid dynamics and large flow velocities promote in 3He-A a transition in the topology and structure of the axially anisotropic superfluid order parameter field, a transition from linear line-like vortices to planar sheet-like vortices (Eltsov et al. 2002). Turbulence has also been studied in laser-cooled Bose-Einstein condensed cold atom clouds, although so far only theoretically (Parker and Adams 2005, Kobayashi and Tsubota 2008), but it is expected that experiments will soon follow. Here we are reviewing recent work on turbulence in rotating flow in both 3He-B and 4He II, emphasizing similarities in their macroscopic dynamics.
A number of developments have shed new light on superfluid turbulence. Much of this progress has been techniques driven in the sense that novel methods have been required, to make further advances in a field as complex as turbulence, where the available techniques both for generating and detecting the phenomenon are not ideal. Three developments will be discussed in this review, namely (i) the use of superfluid 3He for studies in turbulence, which has made it possible to examine the influence of a different set of superfluid properties in addition to those of superfluid 4He, (ii) the study of superfluid 4He in the zero temperature limit where the often present turbulence of the normal component does not complicate the analysis, and (iii) the use of better numerical calculations for illustration and analysis.
From the physics point of view, three major advances can be listed to emerge: In superfluid 3He one can study the transition to turbulence as a function of the dissipation in vortex motion (Eltsov et al. 2006a), known as mutual friction. The dissipation arises from the interaction of thermal excitations with the superfluid vortex, when the vortex moves with respect to the normal component. In classical viscous flow such a transition to turbulence would conceptually correspond to one as a function of viscosity. This is a new aspect, for which we have to thank the 3He-B Fermi superfluid where the easily accessible range of variation in mutual friction dissipation is much wider than in the more conventional 4He II Bose superfluid. We are going to make use of this feature in Sec. 2, where we examine the onset of superfluid turbulence as a function of mutual friction dissipation (Finne et al. 2006a).
Secondly, in Sec. 3 we characterize the total turbulent dissipation in superfluid 3He as a function of temperature, extracted from measurements of the propagation velocity of a turbulent vortex front (Eltsov et al. 2007). A particular simplification in this context is the high value of viscosity of the 3He normal component, which means that in practice the normal fraction always remains in a state of laminar flow.
Finally, our third main topic in Sec. 4 are the results from recent ion transmission measurements in superfluid 4He (Walmsley et al. 2007a, Walmsley and Golov 2008a), where the decay of turbulence is recorded from 1.6 to 0.08 K. Here turbulent dissipation can be examined in the true zero temperature limit with no normal component. As a result we now know that turbulence and dissipation continue to exist at the very lowest temperatures. Although the dissipation mechanisms of 4He or 3He-B in the limit are not yet firmly established (Vinen 2000, 2001, Kozik and Svistunov 2005b), it is anticipated that these questions will be resolved in the near future (Vinen 2006, Kozik and Svistunov 2008b).
Phrased differently, our three studies address the questions (i) how turbulence starts from a seed vortex which is placed in applied vortex-free flow in the turbulent temperature regime (Sec. 2), (ii) how vortices expand into a region of vortex-free flow (Sec. 3), and (iii) how the vorticity decays when the external pumping is switched off (Sec. 4). The common feature of these three studies is the use of uniformly rotating flow for creating turbulence and for calibrating the detection of vorticity. Turbulence can be created in a superfluid in many different ways, but a steady state of constant rotation does generally not support turbulence. Nevertheless, at present rotation is the most practical means of applying flow in a controlled manner in the millikelvin temperature range. In this review we describe a few ways to study turbulence in a rotating refrigerator. Superfluid hydrodynamics supports different kinds of flow even in the zero temperature limit, so that turbulent losses can vary greatly both in form and in magnitude, but generally speaking, the relative importance of turbulent losses tends to increase with decreasing temperature. Two opposite extremes will be examined: highly polarized flow of superfluid 3He-B, when a vortex front propagates along a rotating cylinder of circular cross section (Sec. 3), and the decay of a nearly homogeneous isotropic vortex tangle in superfluid 4He (Sec. 4), created by suddenly stopping the rotation of a container with square cross section.
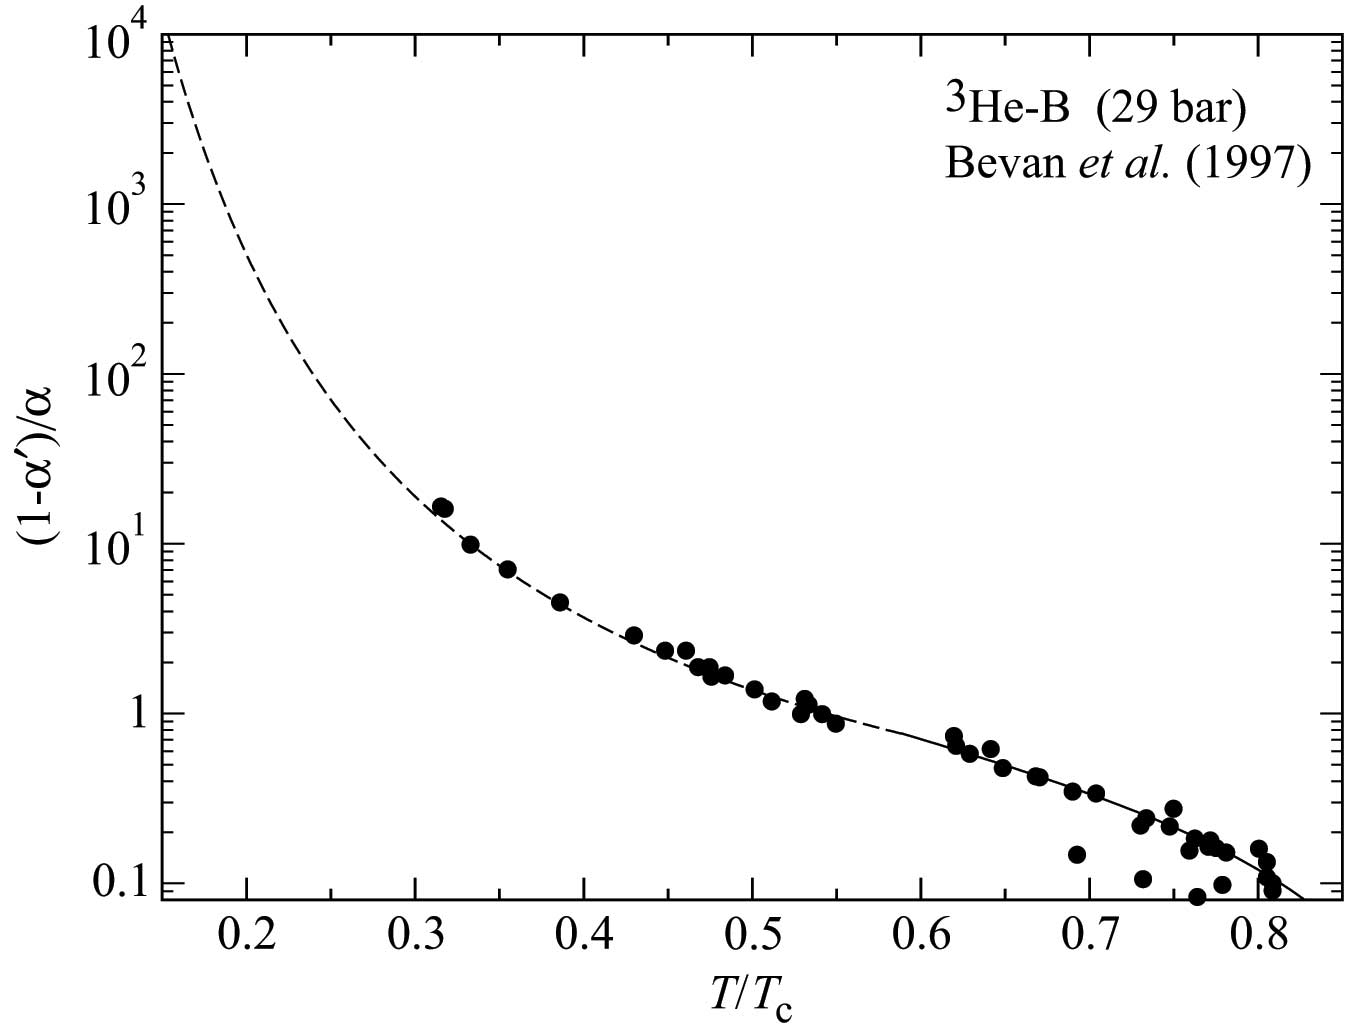
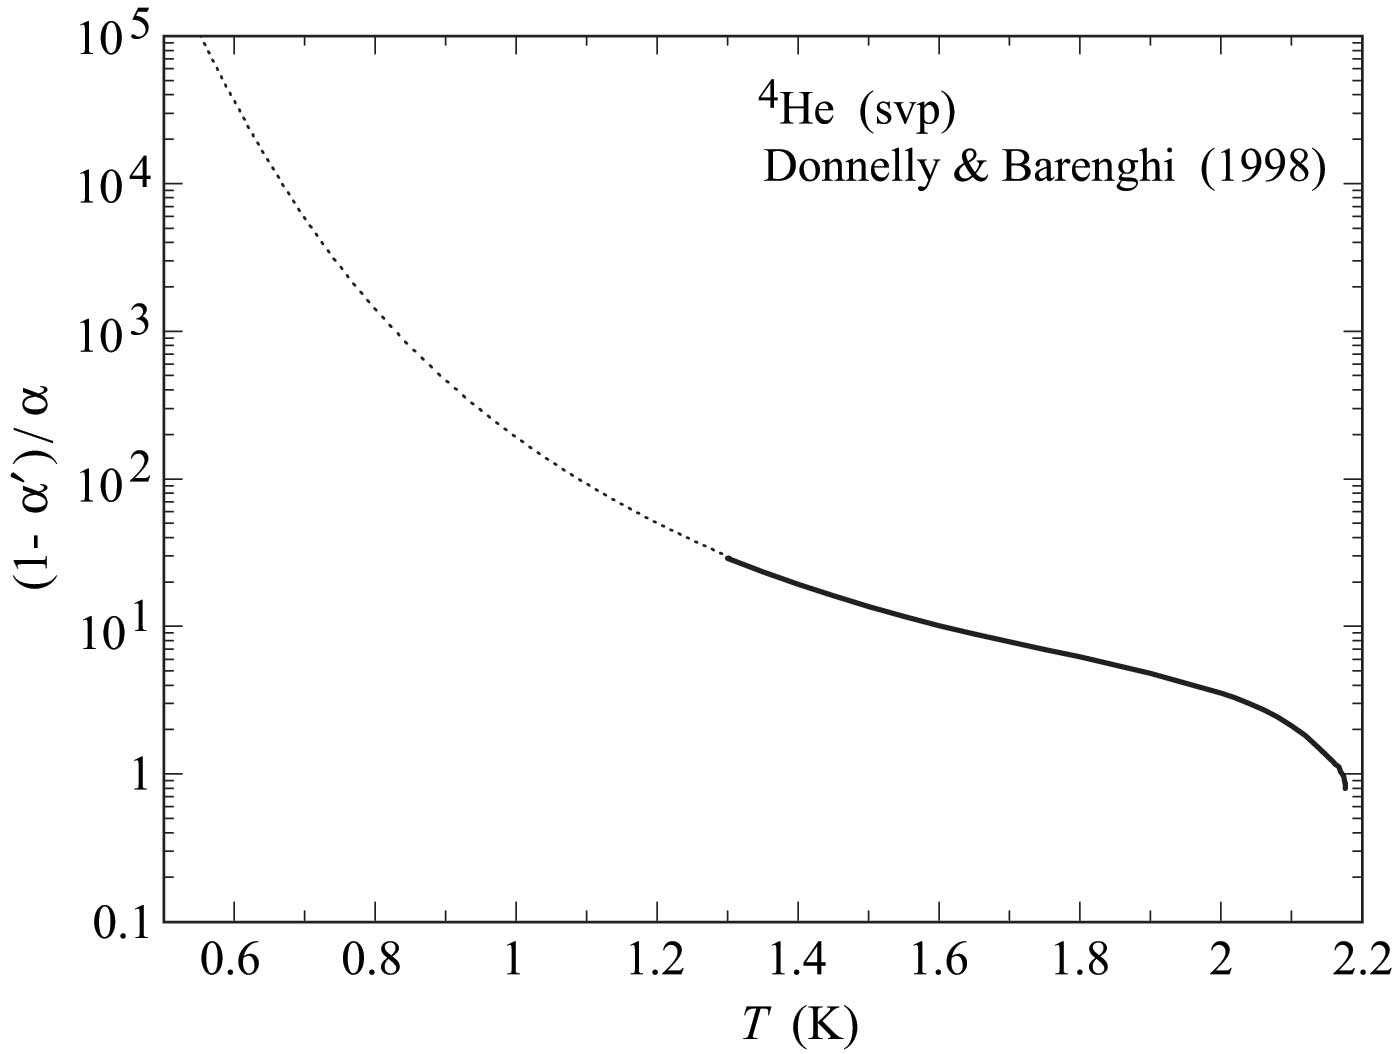
Turbulent flow in superfluid 3He-B and 4He is generally described by the same two-fluid hydrodynamics of an inviscid superfluid component with singly-quantized vortex lines and a viscous normal component. The two components interact via mutual friction. There are generic properties of turbulence that are expected to be common for both superfluids. However, there are also interesting differences which extend the range of the different dynamic phenomena which can be studied in the He superfluids:
- •
-
•
The viscosity of the normal component in 3He-B is four orders of magnitude higher than in 4He, hence the normal component in 3He-B is rarely turbulent, which amounts to a major simplification at finite temperatures (but not in the limit with a vanishing normal component);
-
•
While the critical velocity for vortex nucleation is much smaller in 3He-B, pinning on wall roughness is also weaker; this makes it possible to create vortex-free samples, which are instrumental in the transitional processes studied in Secs. 2 and 3; on the other hand, the ever-present remanent vortices in superfluid 4He are expected to ease the production of new vortices, which becomes important in such experiments as spin-up from rest;
-
•
The vortex core diameter in both liquids is small (which allows us to use the model of one-dimensional line filaments), but in 3He-B it is up to three orders of magnitude larger than in 4He; hence the dissipation mechanisms in the regime, which ultimately rely on the emission of excitations, are expected to work in 3He-B at larger length scales and to lead to more significant energy loss in vortex reconnections.
A comparison of the turbulent dynamics in these two superfluids allows one to identify generic properties that are common for both superfluids, and also to pinpoint specific reasons when there are differences. The main quantity controlling dissipation is the mutual friction dissipation , which dominates the temperature dependence of the dynamic mutual friction parameter , shown in Fig. 1. Experimental values are plotted with filled symbols for 3He-B (Bevan et al. 1997) and with a solid line for 4He (Donnelly and Barenghi 1998). At low temperatures, the following extrapolations are used (shown as dashed lines): For 3He-B at a pressure bar, we use , where the value for the superfluid gap is a linear interpolation as a function of density between the weak coupling value at zero pressure and that measured by Todoshchenko et al. (2002) at melting pressure. For 4He at saturated vapour pressure (svp), we follow Kozik and Svistunov (2008b) and use , where is in K.
2 Dynamic instability – precursor to turbulence
2.1 Introduction
In practice, superfluid flow remains dissipation-free only as long as there are no quantized vortices (or the existing vortices do not move, which is more difficult to arrange). The classic question in superfluid hydrodynamics is therefore: How is the quantized vortex formed (Feynman 1955, Vinen 1963)? In flow measurements with bulk liquid the understanding about the origin of the first vortex has been improving in recent times. Whether it is created in an intrinsic nucleation process (Ruutu et al. 1997) or from remanent vortices (Solntsev et al. 2007), which were created earlier in the presence of flow or while cooling the sample to the superfluid state (Hashimoto et al. 2007), these questions we are not going to address here. Instead we assume that the first vortex is already there, for instance as a remanent vortex. We then ask the question: How is turbulence started when the flow velocity is suddenly increased by external means? After all a turbulent vortex tangle is created through the interaction of many vortices: So how can turbulence start from a single seed vortex?
In rotating 3He-B one can create reliably a meta-stable state of vortex-free flow. It is then possible to inject a single vortex ring into the flow with neutron irradiation. When a slow thermal neutron undergoes a capture reaction in liquid 3He with a 3He nucleus, a vortex ring may escape from the overheated reaction bubble into the flow if the flow velocity is above a critical value (Eltsov et al. 2005). Making use of this phenomenon one can inject a single vortex ring in vortex-free flow at different temperatures. At low temperatures it is observed that a turbulent vortex tangle is spontaneously formed from the injected ring (Finne et al. 2004a), while at high temperatures only a single vortex line results (Ruutu et al. 1998a). What is the explanation?
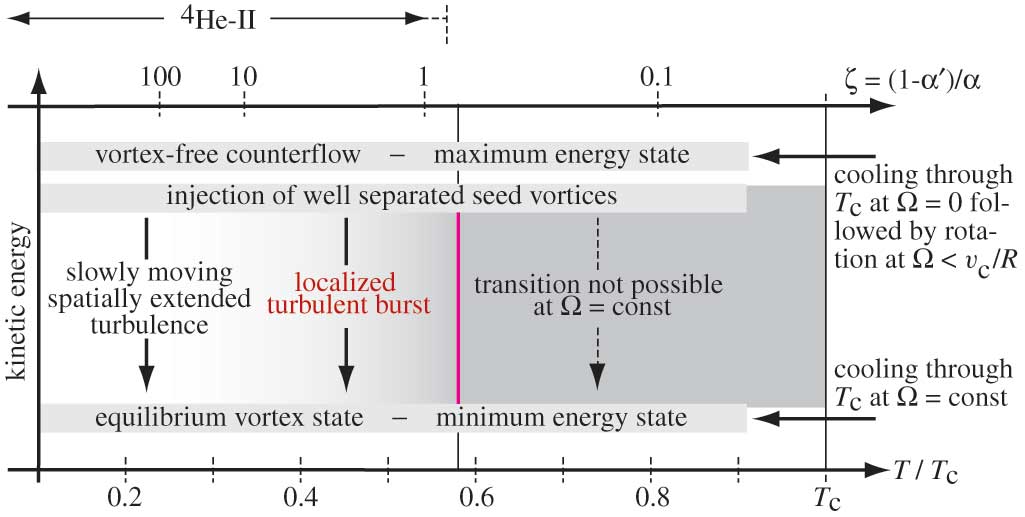
This demonstration in 3He-B shows that in addition to the applied flow velocity also mutual friction matters importantly in the formation of new vortices, in their expansion, and in the onset of turbulence. In 3He-B, mutual friction dissipation is strongly temperature dependent (Fig. 1) and it so happens that drops to sufficiently low value for the onset of turbulence in the middle of the accessible temperature range. The principle of seed vortex injection experiments is summarized in Fig. 2. In these measurements the number and configuration of the injected vortex loops can be varied. It turns out that the highest transition temperature is observed when turbulence starts in bulk volume from many small vortex loops in close proximity of each other. This transition has been found to be at (Finne et al. 2004b) and to be independent of flow velocity over a range of velocities (3 – 6 mm/s). In viscous hydrodynamics the Reynolds number is defined as , where is the characteristic flow velocity, the relevant length scale of the flow geometry, and the kinematic viscosity. In an isotropic superfluid the equivalent of the Reynolds number proves to be . It defines the boundary between laminar and turbulent flow as a function of dissipation and is independent of flow velocity or geometry (Finne et al. 2006b).
However, if we inject instead of several closely packed vortex loops only one single seed loop in vortex-free flow (or several loops but so far apart that they do not immediately interact) then the transition to turbulence is found to be at a lower temperature and to depend on the flow velocity. Thus the onset of turbulence must also have a velocity dependent boundary.
To explain all these observations, one has to assume that an independent precursor mechanism exists which creates more vortices from a seed vortex evolving in externally applied flow. The characterization of this instability is the topic of this section. It turns out that this can be done in 3He-B in the temperature regime close to the onset of turbulence in the bulk volume. Here the precursor often progresses sufficiently slowly so that it can be captured with present measuring techniques, while at lower temperatures turbulence starts too rapidly. This latter case is exactly what happens in 4He II: mutual friction dissipation is always so low in the usual experimental temperature range that the instability has not been explicitly identified.
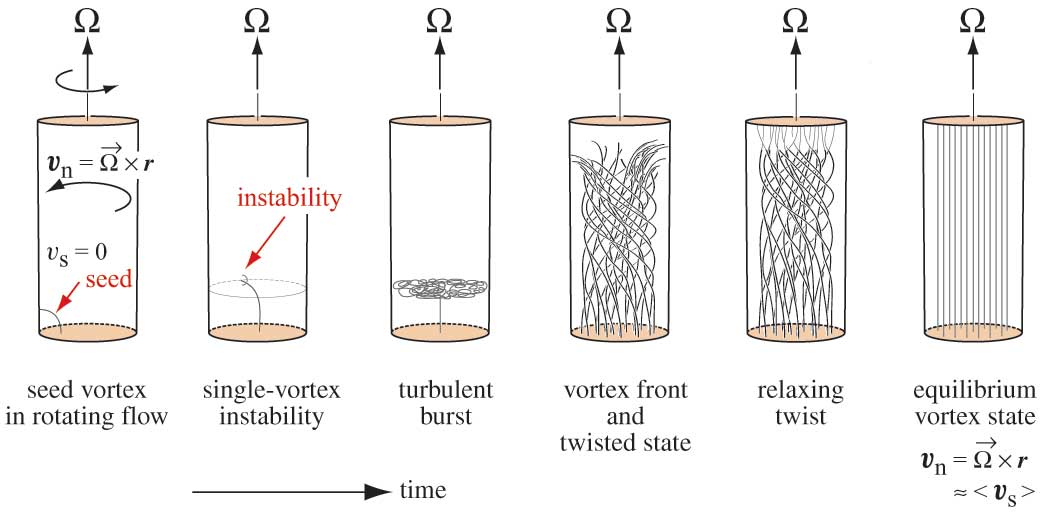
The central question is the reduced stability of the evolving seed vortex loop when mutual friction dissipation is decreasing on cooling to lower temperature: At sufficiently low an evolving vortex becomes unstable with respect to loop formation, so that one or more new vortex loops are split off, before the seed vortex has managed to reach its stable state as a rectilinear line parallel to the rotation axis. The evolution during this entire process, from injection to the final state, is depicted in Fig. 3 in a rotating cylindrical sample. The final state is the equilibrium vortex state, with an array of rectilinear vortex lines, where their areal density in the transverse plane is given by the rotation velocity : . Here mm2/s is the superfluid circulation quantum of the condensate with Cooper-pairs of mass . In this equilibrium state at constant rotation the superfluid component is locked to solid-body rotation with the normal component, when averaged over lengths exceeding the inter-vortex distance . In the ideal case all vortices are here rectilinear, while in the transient states in Fig. 3 vortices can exist in many different configurations.
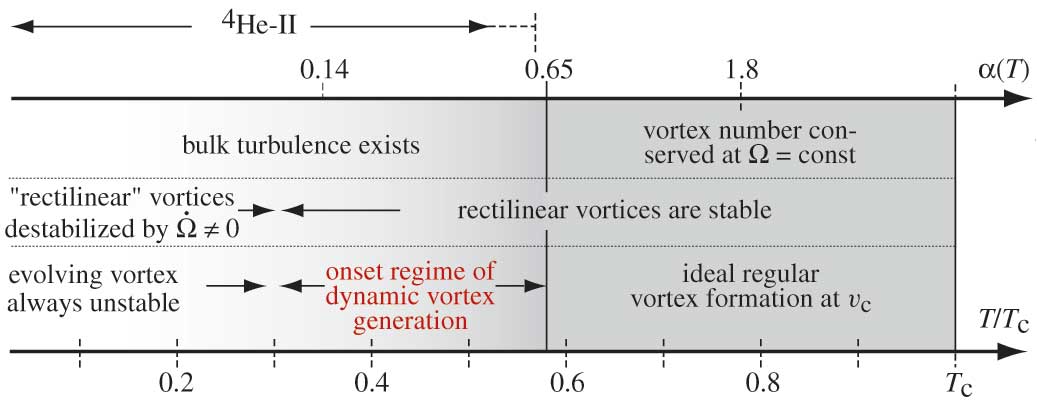
In Fig. 4 a rough classification is provided of the stability of vortices as a function of temperature (or more exactly mutual friction) in different configurations and rotating situations. The lowest temperatures below are in the focus of current research and have by now been probed with a few different types of measurements. The most extensive work has been performed by the Lancaster group. They create with various vibrating oscillators in a quiescent 3He-B bath a vortex tangle and then monitor the decay of the tangle with a vibrating wire resonator (Bradley et al. 2006). The total turbulent dissipation in a vortex front propagating along a rotating column (see Fig. 3) has recently been measured (Eltsov et al. 2007) and will be discussed in Sec. 3. Also the response of the superfluid component has been studied to rapid step-like changes in rotation, when is changed from one constant value to another. This type of measurement is commonly known as spin up or spin down of the superfluid fraction and will be extensively described for spin down in the case of superfluid 4He later in this review.
2.2 Seed vortex evolution in rotating column
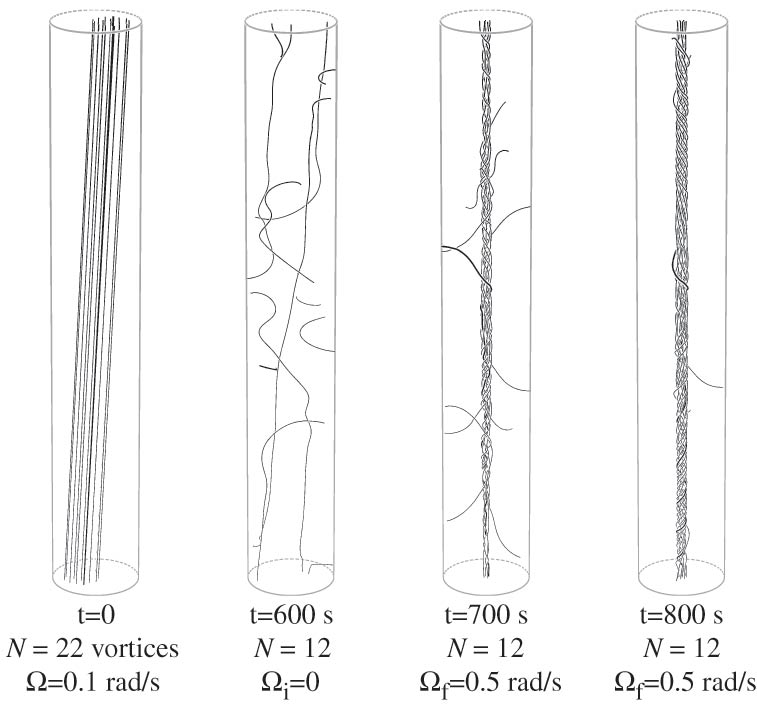
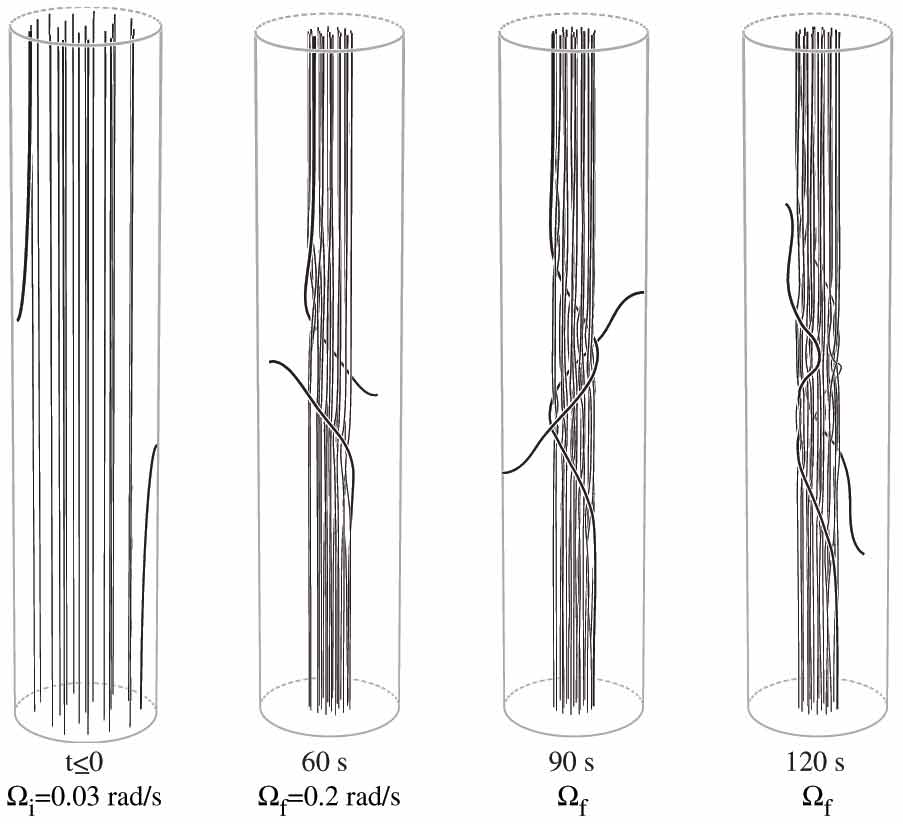
The motion of a seed vortex follows a distinctive pattern, while it expands in a rotating cylinder. Numerically calculated illustrations are shown in Figs. 5 and 6 which depict the evolution of the seeds to stable rectilinear lines. In Fig. 5 an example with remanent vortices is examined, while in Fig. 6 the initial configuration is an equilibrium vortex state in the usual situation that the rotation and cylinder axes are inclined by some small residual angle . These calculations (in a rotating circular cylinder with radius and length ) describe the situation at intermediate temperatures when the vortex instability does not yet occur. The purpose is to focus on the motion of the expanding vortices and the transient configurations which thereby evolve. The characteristic property is the spiral trajectory of a vortex end along the cylindrical wall and the strong polarization on an average along the rotation axis. The calculations have been performed using the numerical techniques described in Sec. 2.5 (de Graaf et al. 2007).
In Fig. 5 the remnants are obtained from an equilibrium vortex state rotating at 0.1 rad/s, by reducing rotation to zero in a sudden step-like deceleration. The vortices are then allowed to annihilate at zero rotation for a period . Some left-over remnants, which have not yet managed to annihilate, still remain after this annihilation time. Ideally smooth walls are assumed without pinning. By suddenly increasing rotation from zero to a steady value rad/s, the remaining remnants are forced to expand. The configuration 100 s later shows how the spiral vortex motion has created a twisted vortex cluster in the center, with a few vortex ends still traveling in circular motion around the cluster. This motion thus winds the evolving vortex around the straighter vortices in the center. On the far right 200 s after the start of the expansion the cluster is almost completed. Nevertheless, this state is still evolving since ultimately also the helical twist relaxes to rectilinear lines, while the vortex ends slide along the end plates of the container.
In Fig. 6 a calculation is presented with 20 rectilinear vortex lines and two short vortices which connect at one end to the cylindrical wall. This configuration mimics the equilibrium vortex state in a real rotating experiment where there exists some residual misalignment between the rotation and sample cylinder axes. Depending on the angle of misalignment and the angular velocity of rotation , some of the peripheral vortices may then end on the cylindrical side wall in the equilibrium vortex state, as shown on the far left. At rotation is increased in step-like manner from to a higher value . Two types of vortex motion are started by the rotation increase. First, the rectilinear vortices are compressed to a central cluster with an areal density by the surrounding azimuthally flowing counterflow. Outside the vortex cluster the counterflow has the velocity
| (1) |
The normal excitations are in solid-body rotation and thus , while the superflow velocity around a cluster of circulation quanta is decaying as , where and the cluster radius . Experimentally it is convenient to define the number of vortices via the initial equilibrium vortex state: , where the externally adjusted rotation velocity uniquely defines in a given experimental setup. It is customary to denote this specially prepared calibration value with . The maximum counterflow velocity at at the cylinder wall is then given by . This definition has been used in Fig. 7 to characterize the number of vortices in the central cluster.
The second type of vortex motion, which is enforced by the increased rotation in Fig. 6, is the spiral motion of the two short vortices, as they become mobile and start expanding towards the top and bottom end plates, respectively. Let us now examine this motion in more detail.
A vortex moving with respect to the superfluid component is subject to the influence from the Magnus lift force. This force can be written as (Donnelly 1991) ( is the density of the superfluid fraction)
| (2) |
which acts on a vortex element with a tangent unit vector moving with velocity with respect to the superfluid component, which locally has the velocity . The motion from the Magnus force is damped by mutual friction which arises when the vortex moves with respect to the surrounding cloud of normal excitations:
| (3) |
The mutual friction force has dissipative and reactive components, which here are expressed in terms of the two parameters and . Balancing the two hydrodynamic forces, , one gets the equation of motion for the vortex line element, which when expressed in terms of the superfluid counterflow velocity has the form
| (4) |
Here the dissipative and reactive mutual friction coefficients and appear. Conversion formulae between different sets of friction parameters are listed by Donnelly (1991). Evidently solutions of the equation of motion can be classified according to the ratio of the two components. The important parameter proves to be (Fig. 1), which is the equivalent of the Reynolds number of viscous fluid flow (Finne et al. 2003).
Two elementary examples are useful to consider. A single rectilinear vortex in rotating counterflow at moves such that its velocity components in the transverse plane consist of the radially oriented dissipative part and the azimuthally oriented reactive part , when expressed in the rotating coordinate frame. The former is responsible for the contraction of the rectilinear vortices to a central cluster in Figs. 5 and 6. The latter causes the rectilinear vortex to rotate with the azimuthal flow with respect to the cylindrical wall.
The second simple consideration concerns the end point motion of an evolving vortex along the cylindrical wall. Since the vortex end is perpendicular to the cylindrical wall, it has from Eq. (4) a longitudinal velocity and an azimuthal component . Evidently other parts of the vortex also contribute to its motion, in particular its curvature where it connects to the cylindrical wall. However, it turns out that the end point velocity is an approximate guide for the expansion of a single vortex in vortex-free rotation. For comparison, the calculated velocities of the two vortex ends in Fig. 6 are and . The wave length of the spiral trajectory is mm and the period s. Thus the end point motion can be used to construct a simplified model of the motion of the two short vortices in Fig. 6.
As seen in Fig. 6, the spiral motion of the vortex end point along the cylindrical wall winds the rest of the evolving vortex around the central vortex cluster with a wave vector , such that . The other almost straight end of the evolving vortex is fixed to a flat end plate of the cylinder and resides there at the edge of the vortex cluster, where the counterflow velocity is close to zero. Therefore the helical twist is removed only by a slow sliding of the vortex end along the end plate. As seen in Fig. 6, occasional reconnections between the twisted evolving vortex and a straight outer vortex in the cluster or with a second oppositely twisted vortex can help to reduce the twist. Finally, we see in Fig. 6 that while the evolving vortex is wound tightly around the cluster this induces Kelvin wave oscillations which propagate vertically along the vortices in the cluster (Hänninen et al. 2007a).
2.3 Onset temperature of turbulence
When the dynamics calculated in Figs. 5 and 6 is probed with measurements, the final state proves to depend crucially on temperature: At temperatures above the transition to turbulence, , the calculations are confirmed and the number of vortices remains constant. At low temperatures, in contrast, evolving vortices may become unstable in applied counterflow and trigger a turbulent burst. The evolution after the burst continues as illustrated in Fig. 3. The final state is then consistently close to the equilibrium vortex state. Interestingly, it turns out that for each initial configuration, such as those in Figs. 5 or 6, there exists a specific temperature , which characterizes the onset of turbulence: well above no turbulent burst occurs while well below a burst always occurs.
In these onset measurements only two different types of final states are observed: sufficiently far above the number of vortices is conserved, while well below close to the equilibrium number of vortices is formed. The change over takes place within a narrow temperature interval around , typically within . Within this interval either of the two final states can emerge. The reason for the narrow width is the strong, nearly exponential temperature dependence of the mutual-friction parameter , which controls the dynamic instability of seed vortices evolving in the applied counterflow (Fig. 1). As sketched in Fig. 3, two sequential processes are needed to start the low-temperature evolution: First the single-vortex instability (Finne et al. 2006a), the precursory process which becomes possible only at temperatures below and which is responsible for generating a bunch of new evolving vortices. Secondly, the turbulent burst has to be triggered as a collective process in which several evolving vortices interact and generate a sudden localized event of turbulence, which expands across the entire cross section of the rotating column, but only over a short section of its length (of order ).
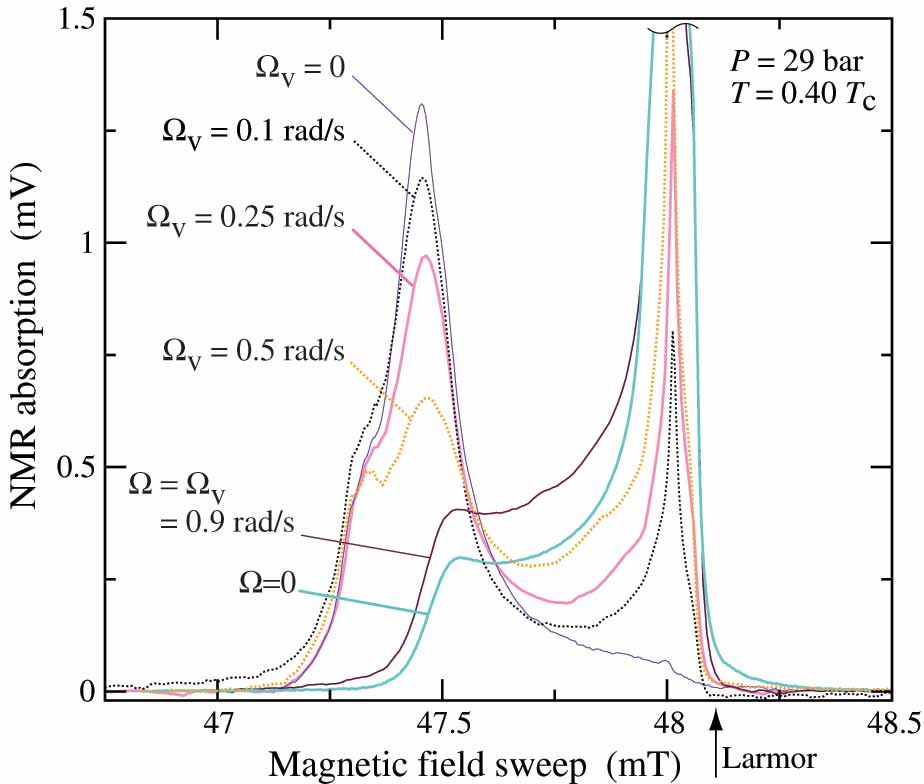
The experimental confirmation of this scenario is obtained by examining the final state as a function of temperature. By recording the line shape of the NMR absorption profile, when the magnitude of the magnetic polarization field is swept across the resonance region, the number of vortices in the final state can be determined. The line shapes of the two types of final states differ drastically, as seen in Fig. 7, where all the spectra have been recorded at the same temperature of and where thus the integrated area under each line shape is the same. The characteristic feature are the large NMR shifts. These are controlled by the temperature and pressure dependent spin-orbit coupling. If the central vortex cluster is surrounded by applied counterflow at some sizeable velocity, a large sharp peak is formed which is shifted down field from the Larmor value. The number of vortices in the central cluster can be determined from the height of this so-called counterflow peak. At small vortex numbers (), the reduction in the counterflow peak height is directly proportional to the number of rectilinear vortices in the cluster. At larger the dependence becomes nonlinear and ultimately the peak height drops to zero well before is reached, in practice around mm/s (Kopu 2006). Accordingly, in the equilibrium vortex state the line shape is radically different and easily distinguished from a state with sizeable counterflow.
A measurement of for any particular initial setup, such as in Fig. 5 for remanent vortices, requires repeating the measurement at different temperatures and recording the line shape in the final state. Surprisingly, it turns out that in the final state the vortex number is either preserved or it has increased close to that in the equilibrium vortex state. Practically no intermediate cases are observed. As a result, in practice a measurement of requires simply a visual check of the measured line shape in the final state. This feature about the turbulent burst is similar to recent observations from measurements with a closely spaced pair of vibrating wires in superfluid 4He (Goto et al. 2007). One of the wires is driven at high oscillation amplitude as generator while the second is operated at low amplitude as detector. Once turbulence has been switched on by running the generator at high drive, the generator can be switched off and turbulent flow will still be maintained around the detector. Only if the detector drive is reduced to sufficiently low level, turbulence ceases and the flow around the detector returns to the laminar state. This shows that once turbulence has been switched on it can be sustained at much lower flow velocities. Similarly, once the turbulent burst is started in the rotating column, turbulent vortex formation will continue until the counterflow velocity has dropped close to zero in a section of the column of height .
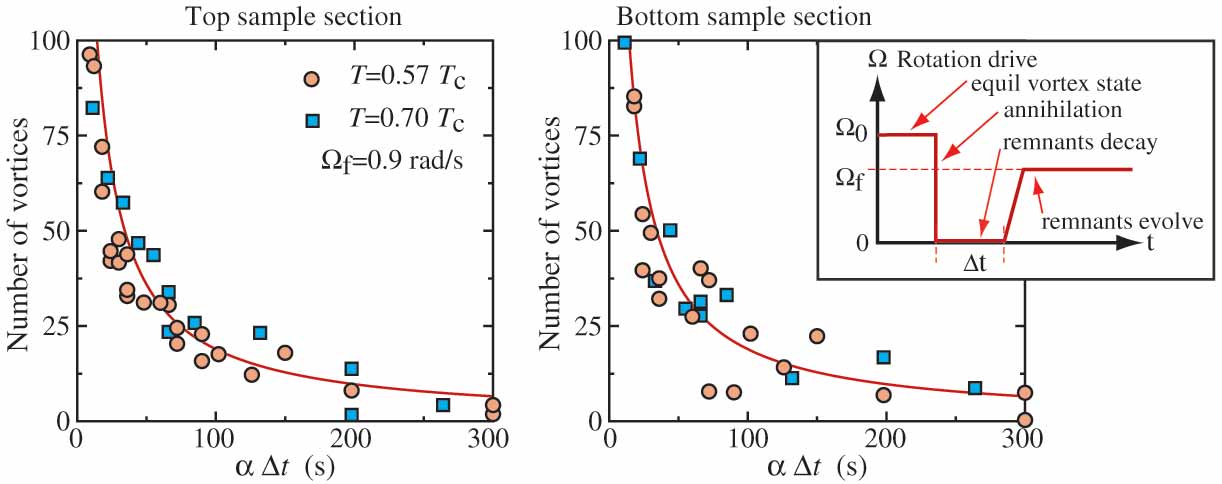
The situation at temperatures above is illustrated by the measurements on vortex remanence in Fig. 8 (Solntsev et al. 2007). These measurements have been performed at two different temperatures above onset, where no increase in the number of vortices is expected. This is confirmed by extracting from the counterflow peak height the number of vortex lines in the final state. The measurement proceeds as sketched in the inset on the top right of Fig. 8: An equilibrium vortex state is decelerated to zero and the vortices are allowed to annihilate for a time interval before rotation is turned back on. The measurement is repeated many times by varying the annihilation time at zero rotation. The annihilation time is found to govern the number of rectilinear vortex lines in the final state and thus the number of remnants at the end of the annihilation period: , where the mutual-friction-controlled time constant is and . This is exactly as expected for the mutual-friction damped motion of vortices in the radial direction, when straight vortices move outward to annihilate on the cylindrical wall at zero rotation. For this to apply, the vortices have to be polarized along the cylindrical symmetry axis (Krusius et al. 1993). As seen in Fig. 5 (second from left, at s) this is the case: The polarization remains at high level even in the remanent state at zero rotation. Consequently, the measurements in Fig. 8 confirm that at constant temperature above the number of vortices in this experiment is controlled by the annihilation period and no uncontrolled increase occurs.
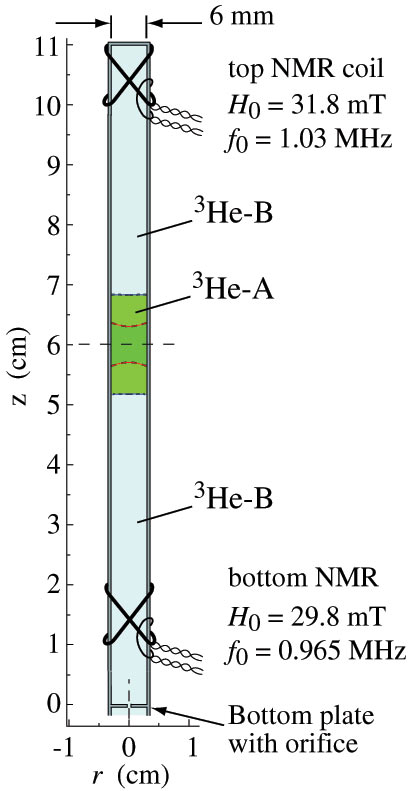
It is useful to note some additional features about vortex remanence in the measurements of Fig. 8. Let us denote the number of remnants after the annihilation period with and the number of rectilinear lines in the final state with . Although the annihilation time controls the number of remnants , the result is independent of . It is also to a large extent independent of how the measurement is performed, i.e. what the rotation velocity in the final state is or what acceleration is employed to reach (as long as or the critical velocity for vortex formation, , is not exceeded). Furthermore, the result is established separately both for the top and bottom sections of the cylinder, when these are separated by a magnetic-field stabilized A-phase barrier layer (cf. Fig. 7), and for the entire cylinder without A-phase barrier. The A-phase barrier layer prevents vortices from traversing across the AB interfaces at low counterflow velocity (Blaauwgeers et al. 2002). In this way the number of remanent vortices has been found to be proportional to the length of the cylinder (as long as ). All these properties are consistent with the conclusions that when , the vortex number is conserved in dynamical processes, the annihilation decay of remnants is a laminar process regulated by mutual friction damping, and that pinning is weak. For simplicity, we neglect vortex pinning altogether and assume ideal wall properties throughout this review.
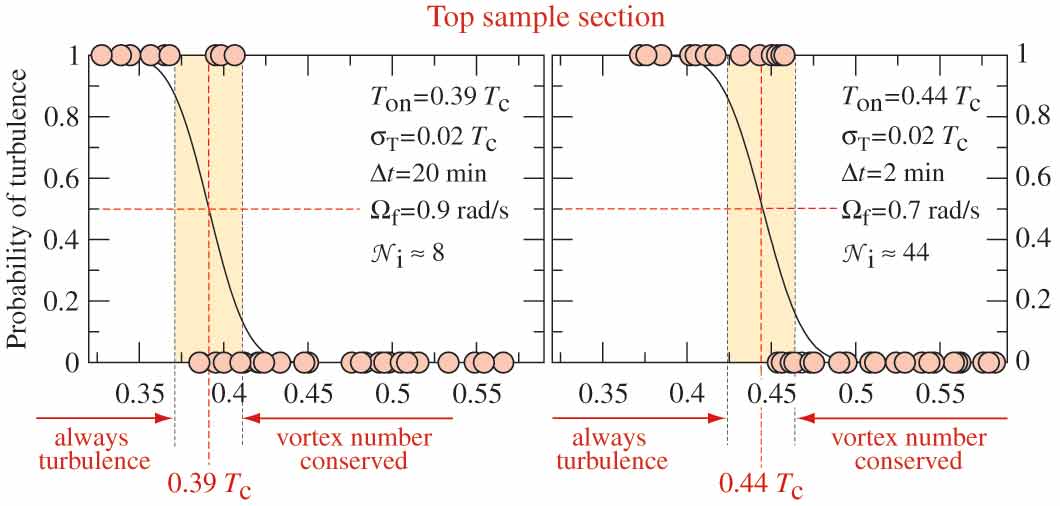
The situation at temperatures around is illustrated by the measurements in Fig. 9 which determine for this particular choice of initial state (Solntsev et al. 2007, de Graaf et al. 2007). The probability of the turbulent burst is plotted as a function of temperature, when the annihilation time min (on the left) and min (on the right). The striking feature is the abrupt change over from the laminar behaviour, where the vortex number is conserved, to turbulence, where the vortex number surges close to and the system relaxes to its minimum energy state. The center of the narrow transition defines the onset temperature of turbulence , which proves to be different for the two cases studied in Fig. 9.
As seen in Fig. 9, depends on the annihilation time and thus on the initial number and configuration of evolving remnants at the moment when the step increase in rotation from zero to is applied. Calculating from the results in Fig. 8 one finds that the number of remnants at the start of acceleration is , when min and , and , when min and . Thus at a higher temperature a larger number of remnants is needed to achieve the turbulent burst. Both panels in Fig. 9 refer to the top sample half where, with no orifice, there is no preferred site for the remnants to accumulate and the turbulent burst occurs randomly at any height in the column (de Graaf et al. 2007). Similar measurements at different values of and final rotation velocity show that the onset temperature depends weakly on both the initial number of remnants and the applied flow velocity. These dependences can be summarized in the form
| (5) |
Thus the onset temperature depends primarily on the mutual friction parameter , but also weakly on other factors which influence the likelihood of achieving locally somewhere in the maximum available counterflow velocity a density of evolving vortices which allows to trigger the turbulent burst. Among these additional factors most important are (i) the applied counterflow velocity , (ii) the number and configuration of the injected seed vortices, and (iii) the sample geometry. In Figs. 8 and 9 we examined the response of remanent vortices to a step-like increase in rotation. The same measurements can also be performed by starting from the equilibrium vortex state at finite rotation, as discussed in the context of Fig. 6. In fact, the most extensive study of the scaling law in Eq. (5) was performed using this approach.
Finally we note that in the rotating container all measured onset temperatures, which depend on the presence of the precursor, are found to be below the transition to turbulence in the bulk: . Furthermore, since the onset also depends on the applied counterflow velocity in Eq. (5), the instability is expected to occur first close to the cylinder wall, where the applied velocity reaches its maximum value at . Thus the reconnection of the expanding loop will most likely occur with the wall. Surprisingly it is also found that once the instability is triggered, the turbulent burst essentially always follows next, since little if no increase in the vortex number is detected at in such cases where the turbulent burst does not switch on (cf. Fig. 9). To provide more understanding on the role of the single-vortex instability as the precursor mechanism to turbulence, we next examine it in the onset temperature regime, , where the instability proceeds sufficiently slowly in time so that it can be monitored with continuous-wave NMR measurement.
2.4 Single-vortex instability in applied flow
Since the time when it was first understood that superfluid turbulence is made up of tangled quantized vortices (Hall and Vinen 1956, Vinen 1961), the most basic question has been its onset as a function of applied counterflow velocity: How is turbulence started and what defines its critical velocity? An important clue was provided by the rotating experiments of Cheng et al. (1973) and Swanson et al. (1983), who found that rectilinear vortex lines in rotation are broken up in a turbulent tangle if a heat current is applied parallel to the rotation axis. The thermal current is transported as a counterflow of the normal and superfluid components along the rotation axis. Rectilinear vortices become unstable in this parallel flow and above a low critical velocity transform to a tangle which tends to be aligned in the plane transverse to the heat current.
This phenomenon was explained by Glaberson and his coworkers (Glaberson et al. 1974) who showed that an array of rectilinear vortices becomes unstable in longitudinal counterflow above the critical velocity , where is an effective circulation quantum (supplemented with the logarithmic cutoff term: , where the average inter-vortex distance is and the vortex core radius ). The instability appears when a Kelvin-wave mode with wave vector starts to build up, whose amplitude then grows exponentially in time. The Glaberson instability has also been examined in numerical calculations which qualitatively confirm the instability and the vortex tangle in the transverse plane which starts to form above a first critical velocity (Tsubota et al. 2003).
In general, the dispersion relation of a helical Kelvin wave disturbance exp[-i] can be written as (Donnelly 1991, Finne et al. 2006b)
| (6) |
In the absence of flow , these Kelvin modes are always damped, at high temperatures they are actually overdamped, but at low temperatures this is not the case. In applied flow , the long wave length modes with become exponentially unstable. If an evolving vortex accumulates enough length parallel to the applied flow, then a disturbance with wave length may start to grow. The expanding loop may reconnect, either with the wall of the container, with itself, or with another vortex. This leads to a growing number and density of evolving vortices, which ultimately start interacting and trigger the onset of turbulence in the bulk.
No rigorous analytical calculation has been presented of the single-vortex instability in the rotating container, but a simple scaling model illustrates the problem. Consider a vortex ring in vortex-free counterflow, which is initially perpendicular to the plane of the ring in a rotating cylinder of radius . If the ring is large enough, then it expands until it reaches the container size . The time needed for this expansion is of order , where is the average normal velocity through the ring. The ring also has a self-induced velocity component , which arises from its own curvature and is directed along the normal of the plane of the ring. Because of this velocity component, the plane of the ring is rotated away from being perpendicular to the azimuthal flow in the cylinder, while it drifts in the flow. During the time , the vortex length parallel to the flow becomes of order . Equating this to , it is seen that the instability condition leads to the requirement . This condition is virtually independent of velocity; the only restriction is imposed by the finite container radius, , which defines a critical velocity . Typically the time spent by a vortex in radial motion before reaching the sample boundary is of order . At and rad/s, the inverse of this quantity equals 0.20 s-1, which fits with the measured vortex generation rate of s-1 in Fig. 10. However, numerical calculations confirm that the presence of surfaces is required to demonstrate the single-vortex instability in usual experimentally relevant flow conditions (Finne et al. 2006a). Also the calculations demonstrate that the instability is not characterized by a unique critical velocity, since it depends on the relative orientation of the flow with respect to the vortex, while the vortex expands in helical motion in the rotating cylinder. Thus the above model is incomplete.
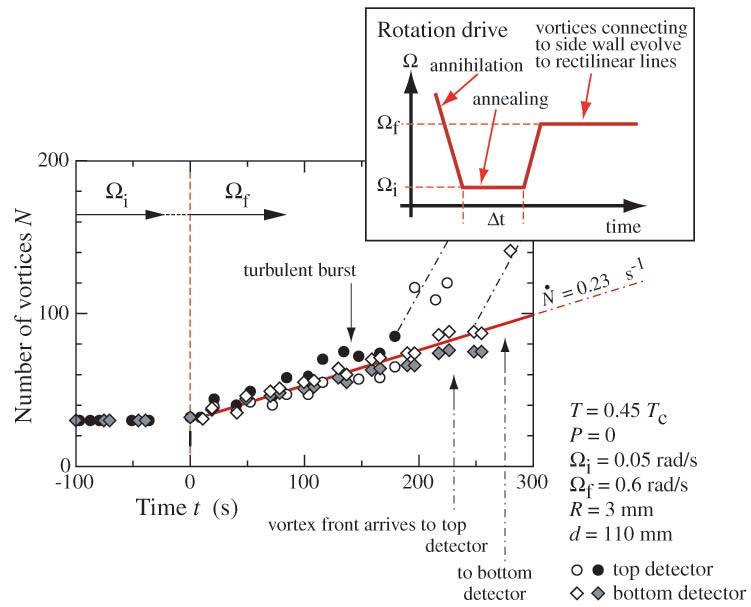
Let us now examine direct observations of the single-vortex instability in rotating flow. In the onset temperature regime, , in about half of the measured cases, which lead to a turbulent burst, a slow increase in the number of vortex lines can be observed to precede the turbulent burst. If present, the increase is invariably followed by a turbulent burst. Thus it appears reasonable to associate the slow increase with the single-vortex instability. In Fig. 10 the number of vortex lines is plotted as a function of time while the precursor generates new vortices at slow rate. In this example the increase in is almost linear (solid line), until the turbulent burst sets in and starts the vortex front motion along the rotating column both upwards and downwards from the site of turbulence. At rad/s the slow increase lasts in this example for about 140 s, generating approximately one vortex every five seconds, until some 30 new vortices have been created and the turbulent burst manages to switch on. The time interval from to the turbulent burst is called the burst time which here is s. At larger the burst time is shorter in duration, eg. in a repetition of the measurements in Fig. 10 at rad/s the turbulent burst was found to start in less than 30 s.
Two further observations about the precursor can be made from Fig. 10. First, vortex formation proceeds independently in different parts of the sample. At rad/s it takes more than 300 s for a vortex created at one end of the sample to reach the other end. Still, vortex formation at the top and bottom ends is observed to proceed at roughly the same rate. Thus vortex generation by the single-vortex instability is not localized, in contrast to the turbulent burst. The random occurrence of the single-vortex instability agrees with the notion of ideal walls (or at least weak pinning), as opposed to a vortex mill localized at a surface defect on the cylinder wall.
Secondly, in Fig. 10 the equilibrium vortex state at low initial rotation rad/s has been used to introduce evolving vortices in the applied flow. This approach provides a more reproducible initial vortex configuration than remanent vortices, since the number of those vortices, which connect to the cylindrical side wall, is primarily determined by the misalignment between the cylinder and rotation axes (Fig. 6). In a given experiment the residual angle between the two axes is generally a constant.
To appreciate the influence of the vortices curving to the side wall, the experiment was repeated differently. A cluster with only rectilinear vortices was prepared at higher temperatures and was then cooled below . As long as this cluster is separated by a sufficiently wide vortex-free counterflow annulus from the cylindrical boundary, can be increased or decreased without change in at any temperature down to (which is the lower limit of the so far measured onset temperatures ). If is reduced too much, the cluster makes contact with the cylindrical side wall, some outermost vortices become curved, and during a subsequent increase of , while , the behavior in Fig. 10 is reproduced. Therefore we are led to assume that, to observe the vortex instability, at least one curved vortex connecting to the cylindrical side wall needs to be present. At temperatures below this may not be the case, since in rapid changes of rotation even rectilinear vortices seem to be destabilized (Fig. 4).
More statistics on the properties of the precursor has been collected from measurements similar to that in Fig. 10 by de Graaf et al. (2007). Important characteristics are the initial rate of vortex generation and the burst time . These can be examined for events with sufficiently long burst times s, so that the rate of the counterflow peak height decrease with time can be adequately resolved. In general it is found that increases and decreases rapidly with decreasing temperature below . To find events with well-resolved pre-turbulent vortex generation and long burst time one has to scan for data (i) in the onset temperature regime, , (ii) with a low initial formation rate vortex/s, and (iii) by starting from a state with a small number of seed vortices (iv) at low applied flow velocity.
These measurements demonstrate that the precursor generates new independent vortex loops which start to evolve along spiral trajectories towards the final state of a rectilinear vortex line. When the density of evolving vortices rises sufficiently, so that interactions between them in the bulk volume become possible, then the process is terminated in a turbulent burst. The burst is a localized event which from one measurement to the next happens randomly at different heights of the sample (Fig. 7). The measured properties of the precursor are consistent with those expected for a single-vortex instability based on the excitation of Kelvin-wave modes of sufficiently long wave length. Overall, measurements in the onset regime reveal the precursor mechanism, owing to the strongly temperature dependent mutual friction of 3He-B, which makes the precursor observable within a narrow temperature interval around the onset temperature. At lower temperatures the turbulent burst develops so rapidly that the measuring techniques, which have been employed so far, are not fast enough to capture the details. The latter case is the typical situation in superfluid 4He experiments.
2.5 Numerical calculation of dynamic vortex generation
Numerical calculations on vortex dynamics are carried out with the vortex filament model introduced by Schwarz (1988). With today’s computing power, one uses Biot-Savart integration along all vortex lines, so that the superfluid velocity field from vortices is obtained from (Hänninen et al. 2005)
| (7) |
The line integral is taken along all vortices in the system, denotes the location of the vortex core at time , and is measured along the arc length of the vortex core. In the presence of solid boundaries the total superfluid velocity field, , is modified by the boundary induced velocity . At a plane boundary one can use image vortices to satisfy the requirement of zero flow through the boundary, , where is the unit vector along the surface normal. More generally we obtain by solving the Laplace equation combined with the requirement that at the boundary .
No surface pinning or even surface friction is generally included, the boundaries are assumed ideal, as indicated so far by measurements on 3He-B in smooth-walled simple cylindrical containers. Mutual friction in the bulk superfluid is included using the equation of motion (4) for the vortex element at , which moves with the velocity . For the mutual friction parameters and one uses the 3He-B data measured by Bevan et al. (1997) at 10 and 29 bar pressures. A reconnection between two vortex segments is enforced if they have drifted within a distance from each other which is less than the minimum spatial resolution of the calculation (usually mm). The configuration after reconnection should correspond to shorter overall vortex length than the initial state. In practice, the computing time limits severely what can be calculated and what becomes too time consuming. Therefore the practical implementation becomes of great importance, how the Biot-Savart integration and the proper solution for the boundary conditions are worked out. For details we refer to de Graaf et al. (2007).
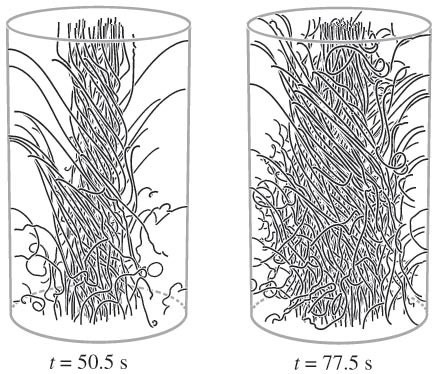
In Fig. 11 two snapshots are shown from calculations on vortex formation and the configurations which evolve in a rotating cylinder (de Graaf et al. 2007). Recently formed younger vortices are here in helical configurations on the outer circumference closer to the cylindrical wall. There in the outer regions one can see loops of Kelvin waves, small separated loops with both ends of the vortex on the cylindrical wall, and even closed vortex rings (lower right corner at s). Since it is primarily surface reconnections at the cylindrical wall which contribute to the formation of new vortices in the early stages of the calculation (at s), the many newly formed short loops are still close to the side wall. Further inside the cluster one can see older and straighter vortices which congregate within the central parts.
The general observation from these calculations is that evolving vortices in a rotating sample are more stable in the numerical experiment than in measurements. For instance, in Fig. 11 vortex formation has to be started from an artificial initial configuration (Finne et al. 2006a). This consists from an initial single vortex ring which is placed in the plane perpendicular to the rotation axis at height slightly off center, to break cylindrical symmetry (de Graaf et al. 2007). This is an unstable configuration where Kelvin waves of large amplitude immediately form and then reconnect at the cylindrical wall. The end result is the sudden formation of roughly 30 vortices which have one end on the bottom end plate and the other moving in spiral trajectory along the cylindrical wall. After the initial burst the later evolution is followed as a function of time , the number of vortices is listed, and the reconnections of different type are classified. The results are shown in Fig. 12.
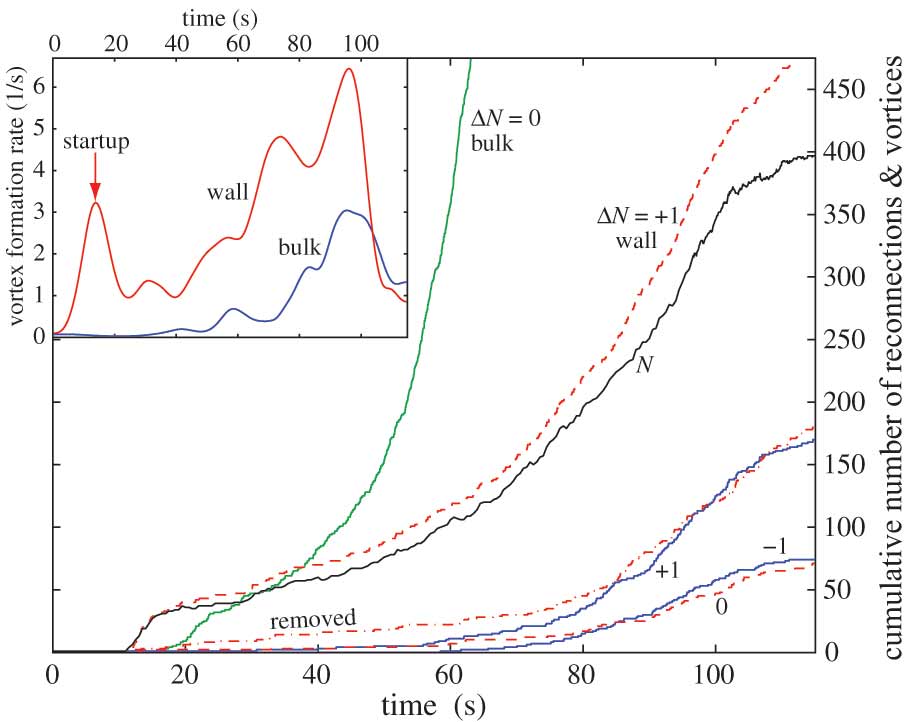
In Fig. 12 one keeps account of all reconnection processes which occur in the rotating sample as a function of time while it is evolving towards its final stable state with an array of rectilinear vortices and . After the initial burst of the first vortices increases first gradually, but after about 50 s the rate picks up. During the first 50 s reconnections in the bulk do not contribute to the generation of new vortices, but later such processes also start to appear. However, even during the later phase a reconnection of a single vortex at the cylindrical wall, while Kelvin waves expand along this vortex, remains the dominant mechanism of vortex generation. This is seen from the fact that the curve for follows closely that of the successful surface reconnections (dashed curve marked as “”). The most frequent reconnections after the first 40 s are denoted by the solid “” curve and occur in the bulk between two different vortices. These inter-vortex reconnections do not lead to changes in and are primarily associated with processes occurring between the twisted vortices in the bundle further away from the wall.
The inset in Fig. 12 compares the rates of vortex generation from reconnections at the wall and in the bulk: The reconnection of a single vortex at the cylindrical wall is clearly the most important mechanism for the generation of new independent vortex loops in the early stages of the calculation. The dominant role of such wall reconnections is compelling. A second important consideration is correspondence with measurement. The obvious difference is the higher stability of evolving vortices in the calculation as compared to experiment. In Fig. 12 the rate of vortex generation remains modest, no clearly identifiable turbulent burst can be distinguished, and the vortex number approaches the equilibrium value from below. After 115 s of evolution the vortex number has progressed to , where the increase is almost stopped, well below the saturation value of (de Graaf et al. 2007). This is the general experience from calculations on an ideal rotating cylinder, with smooth surfaces and no surface friction or pinning. The calculations become more and more time consuming with decreasing temperature, which limits the possibilities to obtain a more comprehensive understanding of their predictions and of the origin of the differences with measurement. The low probability of the single-vortex instability in the calculations appears to be a particular property of rotating flow in a circular cylinder, since linear pipe flow, for instance, displays a steady rate of vortex generation (de Graaf et al. 2007).
Clearly numerical calculations provide important illustrations and guidance in situations where measurements answer only specific limited questions. The calculations take full account of interactions between vortices and between a vortex and the ideal container wall. Nevertheless, the correspondence between calculation and measurement is not satisfactory at present, when we speak about the single-vortex instability and the onset of turbulence in a rotating cylinder. It appears that some mechanism, which makes vortices more unstable and adds to the vortex generation rate, is missing from the calculations. The difficulty is likely to reside on the cylindrical wall, where the assumption of ideal conditions should be examined closer. Attempts in this direction have so far not produced more clarification. However, these uncertainties about the mechanisms behind the single-vortex instability in rotating flow do not change the fact that at low vortex density Kelvin-wave formation on a single vortex, followed by a reconnection at the surface, is the only efficient mechanism for generating new vortices.
2.6 Summary: onset of turbulence
Since the advent of 3He-B new possibilities have appeared to study turbulence. Firstly, it has become possible to distinguish and characterize, in measurements with large samples, vortex formation at a stable reproducible critical velocity, vortex remanence and turbulent proliferation of vortices. Secondly, the mutual friction dissipation with strong temperature dependence around has made it possible to evaluate the role of mutual friction in the onset of turbulence. The important dynamic parameter proves to be . It controls the onset of the single-vortex instability, where an evolving vortex becomes unstable and generates, during a reconnection at the wall, a new vortex loop. After several such events the density of evolving vortices is sufficient to produce a turbulent burst. The necessary condition is , to start the cascade of the single-vortex instability followed by the turbulent burst.
The single-vortex instability becomes possible only at temperatures below the turbulent transition in the bulk volume and thus . The onset temperature of these two series-coupled processes has been found to obey a power-law dependence which relates the mutual friction parameter to the magnitude of the ”flow perturbations” in Eq. (5). Well above no new vortices are detected (with a resolution new vortices), while well below all final states are found to be equilibrium vortex states with close to the equilibrium number of vortices, . In the onset regime itself, , one finds events with and without turbulent burst, but surprisingly practically no incomplete transitions with .
In the intermediate temperature regime , the equilibrium vortex state is reached after a single turbulent burst. In fact, in the measurements with the sample setup of Fig. 7 no case of two or more almost simultaneous bursts was identified above . Apparently the probability of the single vortex instability to start a turbulent burst is still low at these temperatures. Secondly, after the burst the vortex front moves rapidly and removes the vortex-free flow. At these intermediate temperatures the burst is both spatially and temporally a localized event in a short section (of length ) of the column. From one measurement to the next, it occurs randomly at different heights of the column. Below the longitudinal propagation velocity of vortices becomes slow and evolving vortices go rapidly unstable everywhere. As a result turbulence tends to be both spatially and temporally more extended, filling larger sections of the column. The later events, the evolution after the turbulent burst, are the subject of the next section.
3 Propagating vortex front in rotating flow
3.1 Introduction
In rotation at constant angular velocity the steady state superfluid response is generally not turbulent. Nevertheless, transient states of turbulence can be formed by rapidly changing the rotation velocity, especially if the sample container does not have circular cross section or its symmetry axis is inclined by a larger angle from the rotation axis. The decay of turbulence and the approach to equilibrium can then be monitored at constant . The normal component relaxes back to solid body rotation by means of viscous interactions, while the superfluid component adjusts much slower, coupled only by mutual friction dissipation from vortex motion with respect to the normal component and (if any) by the deviations of the container walls from being axially-symmetric around the rotation axis. Such measurements on transient turbulence are generally known as spin up or spin down of the superfluid component. This used to be an important topic in superfluid 4He work in the fifties and sixties (Andronikashvili and Mamaladze 1967), but was then replaced (with few exceptions (Adams et al. 1985)) by other methods which one expected to lead to results with more straightforward interpretation.
The turbulent burst, which suddenly starts the motion of vortices along the rotating column at temperatures , as discussed in Sec. 2 (cf. Fig. 3), provides a novel technique to investigate transient turbulence in rotation. Originally it was assumed that this motion would take place as a tangle of vortices, which spreads longitudinally along the rotating column. It was soon realized from NMR measurements (Eltsov et al. 2006b) that this could not be the case; rather the propagating vortices were highly polarized and had to be coiled in a helical configuration owing to their spirally winding motion. This recognition presented a new problem: Is there any room at all for turbulence in this kind of motion and if there is, how is it expressed? Or perhaps the nature of the motion changes on approaching the zero temperature limit, when mutual friction dissipation vanishes exp? These questions provided the incentive to examine the propagation more closely and to measure its velocity as a function of temperature. The results demonstrate that turbulent losses depend crucially on the type of flow, flow geometry, external conditions, the physical properties of the superfluid itself, etc.
A measurement of the front propagation in the laminar and turbulent temperature regimes allows one to determine the rate of kinetic energy dissipation. The measurement proceeds as follows: The initial starting state is the rotating vortex-free state, the so-called Landau state, which is metastable with much larger free energy than the stable equilibrium vortex state. The latter consists of rigidly co-rotating normal and superfluid components, owing to the presence of a regular array of rectilinear vortices, while in the vortex-free state the superfluid component is not rotating at all: it is at rest in the laboratory frame of reference. When the turbulent burst is triggered in the Landau state, a rapid evolution towards the equilibrium vortex state is started, where a boundary between the vortex-free and the vortex states propagates along the rotating column and displaces the metastable vortex-free counterflow. Particularly at temperatures below the boundary has the form of a sharp thin vortex front which travels at a steady velocity . The dissipation rate of the total kinetic energy, , is related to as
| (8) |
By measuring one determines directly the energy dissipation as a function of temperature.
At high temperatures the motion is laminar and the front velocity is determined by mutual friction dissipation between the normal and superfluid components, . Below , deviates more and more above the laminar extrapolation (Eltsov et al. 2007), in other words the dissipation becomes larger than expected from mutual friction in a laminar flow. At the very lowest temperatures a striking anomaly becomes apparent: does not go to zero, but the measured velocity appears to level off at a constant value which corresponds to an effective friction , even though , when . Evidence for a similar conclusion has been offered by the Lancaster group (Bradley et al. 2006), who measured the density of the vortex tangle created by an oscillating grid and found that this kind of turbulence decays at a temperature-independent finite rate below .
When mutual friction decreases and turbulent motions in the vortex front cascade downward to progressively smaller length scales, eventually individual quantized vortex lines must become important. This is the quantum regime of superfluid hydrodynamics. The energy cascade on length scales smaller than the inter-vortex distance and the nature of dissipation on these scales are currently central questions in superfluid turbulence (Vinen and Niemela 2002). Theoretical predictions exist on the role of non-linear interactions of Kelvin waves and the resulting Kelvin-wave cascade, which is ultimately terminated in quasiparticle emission (Kozik and Svistunov 2004, 2005a, 2008a, Vinen 2000, Vinen et al. 2003), or on the importance of reconnections which could rapidly redistribute energy over a range of scales and also lead to dissipation (Svistunov 1995). From their front propagation measurements Eltsov et al. (2007) conclude that the Kelvin-wave cascade accounts for an important part in the increased dissipation below . The different sources of dissipation in this analysis are discussed in Secs. 3.4 and 3.5.
It is worth noting that a propagating turbulent vortex front has many interesting analogues in physics (van Saarloos 2003). For instance, it is similar to the propagation of a flame front in premixed fuel. Flame front propagation can also proceed in laminar or in turbulent regimes. In the latter case the effective area of the front increases and its propagation speed becomes higher than in the laminar regime. This property finds its practical use in combustion engines, but has also been used by Blinnikov et al. (2006) to describe intensity curves of type Ia supernovae. In all such cases a metastable state of matter is converted to stable state in the front and is determined by the rate of dissipation of the released energy.
3.2 Measurement of vortex front propagation
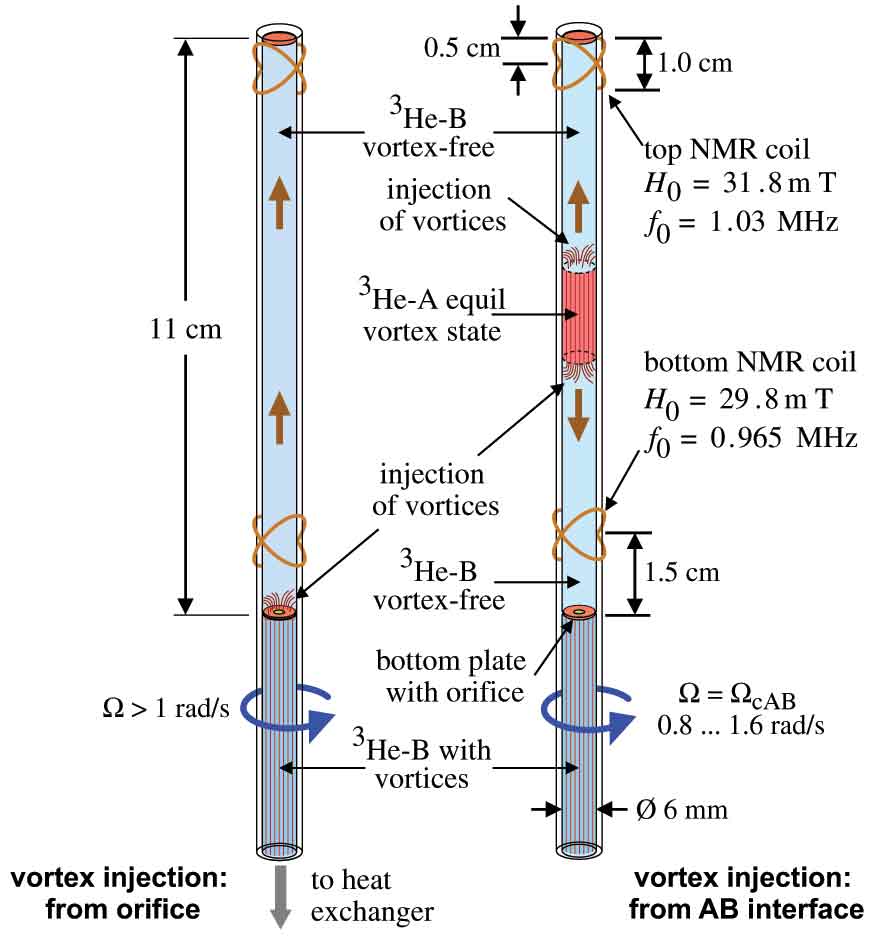
The velocity of the vortex front was measured by Eltsov et al. (2007) with the setup in Fig. 13. The initial vortex-free state was prepared by warming the sample above 0.7 , where remanent vortices annihilate rapidly, and by then cooling it in the vortex-free state at constant rotation to the target temperature. Two different procedures were used to trigger the turbulent burst at the target temperature. These are sketched in Fig. 13. In both cases the front velocity is determined by dividing the flight distance by the flight time, assuming that the front propagates in steady-state configuration. Although this is not exactly true, for instance owing to initial equilibration processes which follow injection, it is assumed for now that this simplification is justified. Especially, since the two injection techniques for different propagation lengths give the same result.
The first injection technique (depicted on the left, Fig. 13) makes use of remanent vortices (Solntsev et al. 2007). By trial and error it was found that one or more remnants can be freed with a small step increase in rotation from the region around the orifice on the bottom of the sample cylinder. This was done by increasing in small steps, until at some point usually above 1 rad/s a remnant starts expanding which below immediately gives rise to a turbulent burst. The ensuing vortex front then propagates upwards along the entire column through both pick-up coils in succession.
The second injection method (depicted on the right, Fig. 13) relies on the superfluid Kelvin-Helmholtz (KH) instability of the interface between the A and B phases of superfluid 3He (Blaauwgeers et al. 2002). Two stable AB interfaces are formed by applying a specially configured magnetic field which stabilizes a narrow A-phase barrier layer over the mid section of the sample cylinder. The shear flow instability of these two AB interfaces is controlled by rotation velocity, temperature, and the stabilization field. At the target temperature the instability can be triggered with a step increase of the rotation velocity or of the stabilization field (Finne et al. 2004b). The instability causes vortices from the A phase to escape across the AB interface into the vortex-free B-phase flow in the form of a bunch of small closely packed loops. Once in the B phase, at temperatures below the loops immediately interact and generate a turbulent burst. Two vortex fronts then propagate independently up and down from the AB interfaces, arriving to the top and bottom pick-up coils practically simultaneously (since the setup is symmetric with respect to the mid plane of the stabilization field). An example of the NMR readout as a function of time is shown in Fig. 14. The KH shear flow instability and the associated vortex leak across the AB interface have been extensively described in the review by Finne et al. (2006b).
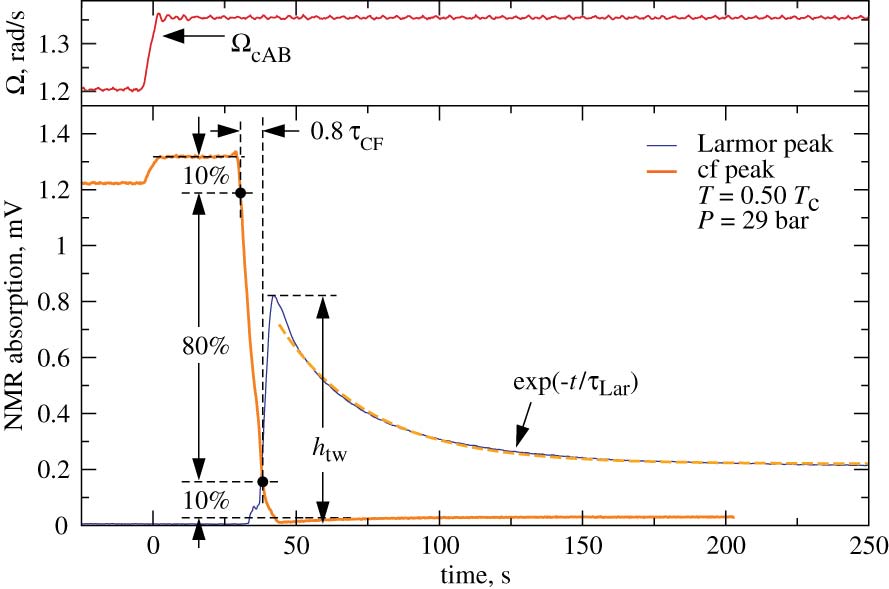
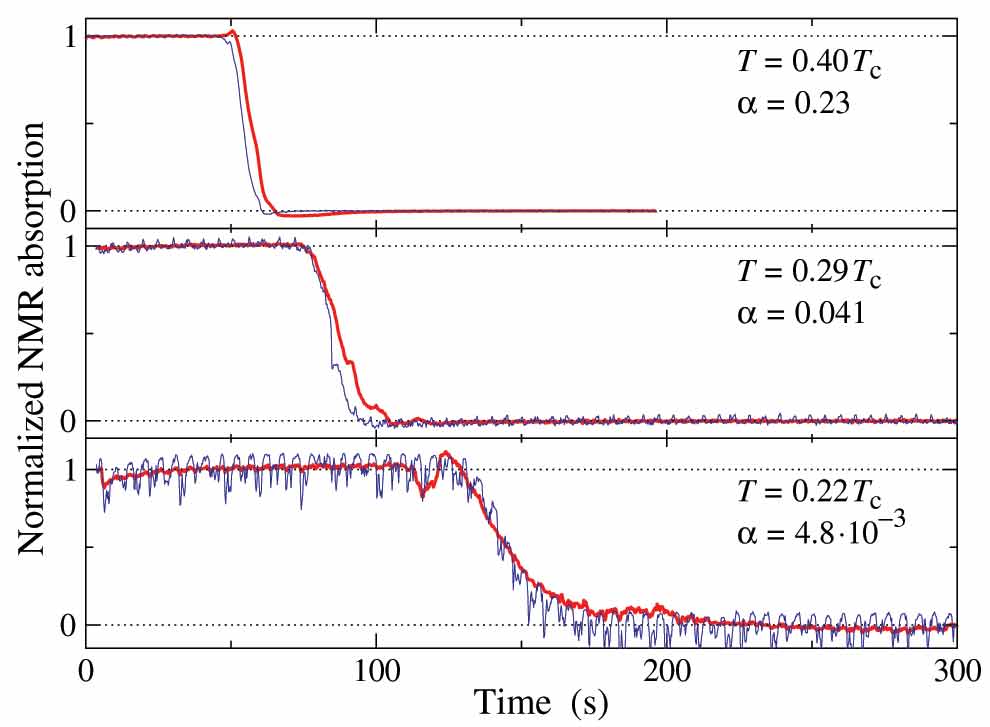
In Fig. 14 one of the signal traces records the absorption at the counterflow peak (cf. Fig. 7). It is at maximum in the initial vortex-free flow at (where and in the laboratory frame). To trigger the KH instability, is increased by a small increment across the critical rotation velocity , which is instantaneously registered as a small increase in absorption level, owing to the increased counterflow velocity. Following the instability and the turbulent burst, the vortices subsequently propagate along the column, but a response in the counterflow peak height is not observed until they reach the closer end of the NMR coil. From thereon the absorption in the peak rapidly decreases and drops to zero. Keeping in mind that the peak height measures the azimuthally circulating flow in the transverse plane (cf. Eq. (1)), its sudden removal requires that the passage of the vortices through the coil must occur as an organized sharp front, followed by a highly polarized state behind the front. The passage is characterized by the time , which is defined in Fig. 14. The propagation velocity of the front is determined from its flight time, measured from the AB interface instability (when ) to the arrival of the front at the closer edge of the pick-up coil, i.e. where the rapid drop in the counterflow peak height starts. Compared to the flight time, the AB interface instability and the turbulent burst can be considered as instantaneous.
The second signal trace in Fig. 14 records the absorption in the Larmor peak. It is near zero in the initial vortex-free state, displays a sharp maximum after the collapse of the counterflow peak, and then decays to a small, but finite value, which is a characteristic of the final equilibrium vortex state. The transient maximum is the new feature, which arises from flow in the axial direction, created by a helically twisted vortex bundle (Eltsov et al. 2006b). With increasing wave vector of the helix, the axial flow at a velocity and the absorption in the Larmor peak increase monotonically (Kopu 2006). Thus the maximum Larmor peak height in Fig. 14 is reached when reaches its largest value inside the detector coil. This happens when the most tightly spiralled section of the twisted cluster (which is just behind the front, as seen in Fig. 21) passes through the middle of the detector coil. When the front arrives at the bottom end plate of the cylinder the twist starts to relax, since the vortices have to obey the boundary condition on the flat end plate, where they slip to reduce their length and winding. The unwinding produces the exponentially relaxing absorption with time constant . The signal decay continues down to the absorption level characteristic of the equilibrium vortex state, with an array of rectilinear vortex lines. At their other end the vortices, after crossing the AB interface, have a continuation as doubly quantized A-phase vortices (Hänninen et al. 2003).
To interpret measurements on the front velocity it is of importance that the structure of the twisted state and the front itself are known. Information on these characteristics can be obtained by measuring quantitatively the various features denoted in Fig. 14 as a function of temperature.
3.3 Velocity of vortex front
A striking consequence from the twisted state is the appearance of superflow directed along the helically spiralling vortex cores. This situation is reminiscent of a ”force-free” vortex configuration, where all the flow is directed along the vortex core. Such a structure is expected to be stable up to some instability limit, similar to the Glaberson limit of a rectilinear vortex array in parallel flow (Sec. 2.4). In the twisted state, which is uniform in the axial and azimuthal directions, the superflow has both an azimuthal component at the velocity and an axial component at , which depend on the radial coordinate and are described by the expressions (Eltsov et al. 2006b):
| (9) |
Since the net flow through the cross section of the cylindrical container should vanish, from this condition for one finds that . The axial flow is directed along the vortex expansion direction close to the cylindrical wall and in the opposite direction closer to the center. In practice, there has to exist also a radial velocity , since any laboratory example of the twisted state is nonuniform. In the case of a propagating vortex front, the wave vector has its maximum value close to the rear end of the front and decreases to zero at the bottom and top end plates of the sample. As seen in Fig. 14, the twisted state prominently changes the line shape of the NMR spectrum and it is the axial superflow which here has the strongest influence.
As discussed in Sec. 2.2, in vortex-free counterflow the end point of a single vortex moves on the cylindrical side wall roughly with the longitudinal velocity , while its azimuthal velocity is (in the rotating frame). Thus the wave vector of the spiral trajectory is . If this value is used as an estimate for the wave vector of the twisted state, it follows that the helical winding of the vortex bundle becomes tighter with decreasing temperature. The tighter twist increases the flow velocities in Eq. (9), i.e. flow parallel to the vortex cores is enhanced, which will ultimately destabilize the “force-free” twisted-cluster configuration. Nevertheless, twisted-cluster propagation appears to persist even below . The twist is removed by the slip of the vortex ends along the flat end plates of the cylinder, which generates the exponentially relaxing absorption in Fig. 14 with the time constant .
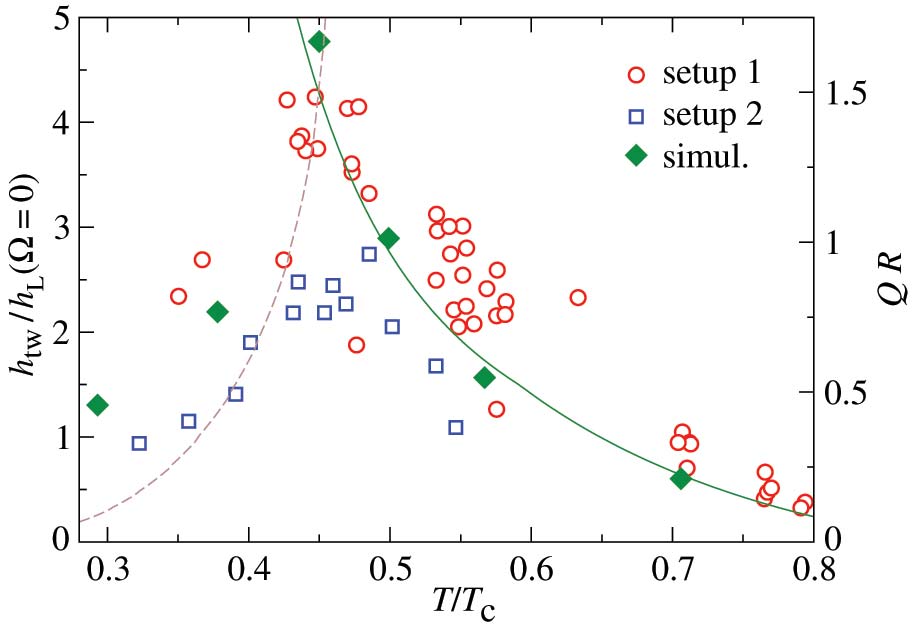
In Fig. 15 (left panel) the measured temperature dependence of the magnitude of the twist is plotted in terms of the maximum height of the Larmor peak , normalized to the height of the Larmor peak at at the same temperature (left vertical axis). Two experimental setups with slightly different specifications were used in these measurements. The line shape of the NMR absorption spectrum in the Larmor region depends both on the magnitude and homogeneity of the magnetic polarization field. In the two setups the homogeneities varied by a factor of two, which is believed to explain the differences in the absolute values between the two data sets (for details we refer to Eltsov et al. (2008)). Nevertheless, it is seen here that the twist increases towards low temperatures as expected, but only until a maximum at , whereas below it abruptly starts to decrease.
The non-monotonic temperature dependence of the twist is confirmed in numerical calculations: The value of the twist wave vector behind the front, as determined from a fit of the calculated velocity profiles to Eq. (9) (Eltsov et al. 2008) and plotted in Fig. 15 (left panel, right vertical axis), also peaks at . Two reasons can be suggested for the change in temperature dependence at . First, the twist can relax via reconnections between neighboring vortices in the bundle, which become more frequent with decreasing temperature below (cf. Fig. 25). Secondly, the source of the twist is at the vortex front, while the sink is at the end plate of the cylinder, where the twist vanishes because of the boundary conditions. From there the relaxation of the twist advances in a diffusive manner along the twisted bundle. The effective diffusion coefficient increases as the temperature decreases (Eltsov et al. 2006b) and thus the faster diffusion limits the maximum twist in a finite-size sample at low temperatures. However, overall the stability of twisted-cluster propagation appears to be a complicated question at temperatures below , where it controls the average number of vortices threading through each cross section of the column behind the front.
The properties of the twist in Fig. 15 roughly agree with the estimate that the front velocity can be approximated with the longitudinal velocity of a single vortex expanding in vortex-free rotation, . However, this simplification suffers from the following difficulty: Ahead of the front the vortex-free superfluid component is at rest and the effective counterflow velocity might really be approximated with , but behind the front the density of vortices is close to equilibrium and . In this case a vortex, which has fallen behind in the motion, feels a much reduced counterflow and continues to fall more behind. Therefore the thickness of the front should increase with time. The explanation to this dilemma is that behind the front the superflow induced by the twisted vortex bundle has to be taken into account. The longitudinal expansion velocity should now be modified to . Since here is oriented in the direction of the front propagation and in the twisted state, the longitudinal expansion velocity of the vortices in the tail of the front is enhanced. This velocity can be estimated taking and from Eq. (9):
| (10) |
Eq. (10) has a maximum as a function of the vector. If (which corresponds to according to the measurements of Bevan et al. (1997)), the maximum value of is less than the velocity of the foremost vortices . In these conditions the thickness of the front increases while it propagates. When , a wide range of values exists for which formally . The minimum possible value of is shown in Fig. 15 (left panel) as the dashed curve. In these conditions the front propagates in a steady-state “thin” configuration.
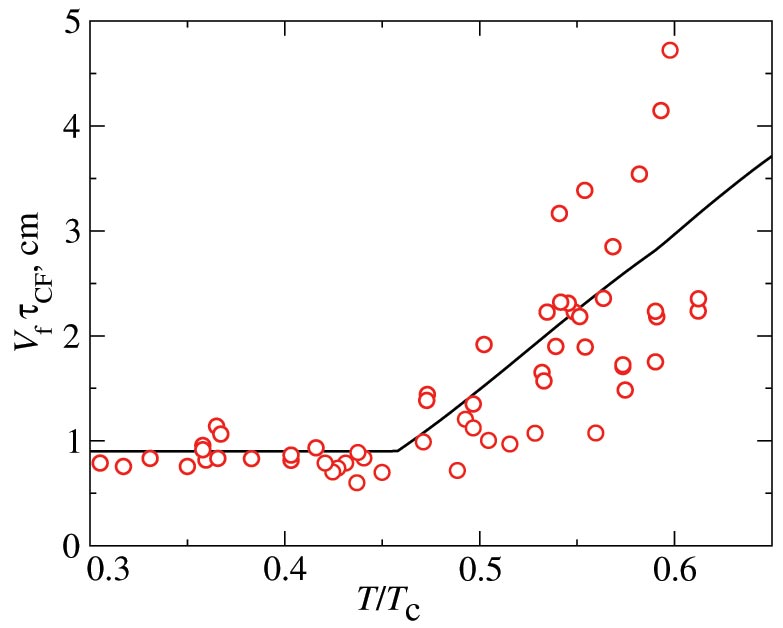
Experimentally, the decay time of the counterflow peak in Fig. 14 can be used to extract the front thickness. The decay starts when the head of the front arrives at the closer edge of the detector coil and it is over when that part of the front leaves the far edge of the detector coil where the counterflow is not sufficient to generate a non-zero absorption response. The product has the dimension of length and can be called the apparent thickness of the front. At higher temperatures the actual thickness of the front grows with time. Here the apparent thickness depends on the distance of the observation point from the site of the turbulent burst and on the rate at which the thickness increases and vortices fall behind. With decreasing temperature the front starts to propagate as a thin steady-state structure and ultimately its apparent thickness decreases to equal the height of the pick-up coil (mm, Fig. 7) and remains thereafter approximately constant.
Measurements of the apparent thickness of the front are presented in the right panel of Fig. 15. At , and the apparent thickness increases with increasing temperature. At the apparent front thickness becomes comparable with the height of the detector coil and thereafter at lower temperatures remains at that value. Assuming that initially at the turbulent burst the front is infinitely thin we can write
| (11) |
where is the distance from the site of the turbulent burst to the nearest edge of the pick-up coil and is the expansion velocity at the position in the front where the NMR signal from the counterflow vanishes. Given that the latter condition roughly corresponds to we take if and simply otherwise. Using from Eq. (10) and the simple estimates and , we get from Eq. (11) the solid line in Fig. 15 (right panel), which is in reasonable agreement with experiment.
The rapid change in the counterflow peak height during the passage of the vortex front through the detector coil provides a convenient signal for measuring the propagation velocity . Examples of these signals are shown in Fig. 16. They have been measured at different temperatures to illustrate how the temperature dependence of is expressed in the practical measurement. All three examples have been measured using the externally triggered Kelvin-Helmholtz instability to start the turbulent burst. In Fig. 16 the vortex fronts have traveled a distance of cm, before they pass through the detector coil, and thus have already acquired their steady-state thin-front configuration.
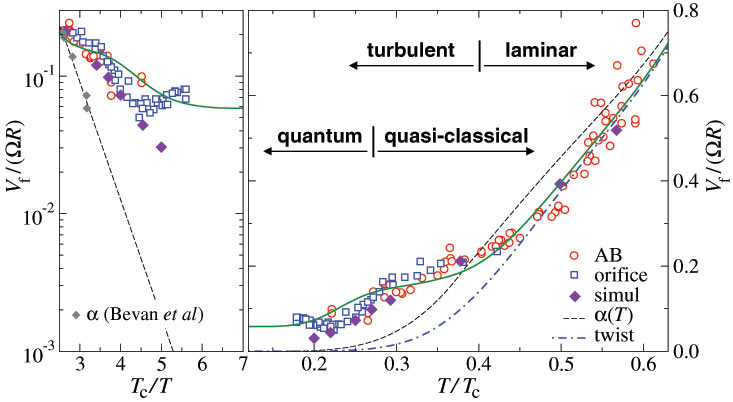
Measurements on the front velocity are shown in Fig. 17. As a function of temperature two different regimes of front propagation can be distinguished, the laminar and turbulent regimes. The crossover between them is gradual and smooth. This is in sharp contrast to the sudden onset of bulk turbulence (as a function of temperature around ) in injection measurements in the same circular column, when a bundle of closely spaced seed vortex loops escapes across the AB interface in a Kelvin-Helmholts instability event (Fig. 2). A sharp transition with a clearly defined critical velocity is the usual case, for instance in all measurements with mechanical vibrating objects (in the regime ) as a function of drive and flow velocity (Vinen and Skrbek 2008). The smooth crossover here in front propagation may be a special property of the circular column where vortex polarization along the rotation axis is always %. Nevertheless, smooth crossovers have been observed before, for instance from linear to turbulent wave acoustics in second sound propagation in a circular cylinder as a function of driving amplitude (Kolmakov et al. 2006).
Above in the laminar regime the results in Fig. 17 are consistent with the earlier measurements of Finne et al. (2004c). Here the single-vortex dynamics apply, when inter-vortex interactions can be neglected and (Sec. 2.2). At closer inspection it is noticed that the data for the normalized front velocity lie on average below (dashed curve). The reason is that behind the front the vortices are in the twisted state and not as rectilinear vortex lines in an equilibrium array. If we integrate the kinetic energy stored in the twist-induced flow (Eq. 9) over the sample cross section, the result is found to be
| (12) |
After including this reduction from the twisted state, the agreement is improved (dash-dotted curve). In the turbulent regime below , the data deviate with decreasing temperature more and more above the extrapolations from the laminar regime. Eventually at the lowest temperatures the measurements become temperature independent, with a peculiar transition from one plateau to another at around . These features are attributed to turbulent dynamics and are analyzed in the next sections in more detail.
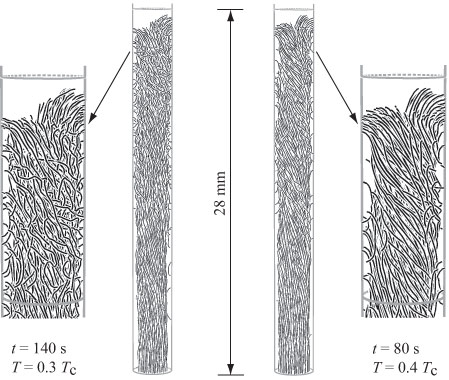
The measured properties of the propagating vortex front are confirmed qualitatively in numerical calculations. They show that in the laminar regime the thickness of the front grows with time, but with decreasing temperature the twist increases (Fig. 15) and finally at about the thin steady-state front configuration is established, with a time-independent thickness roughly equal to the radius of the sample. Below the twist decreases with decreasing temperature, but remains within the limits where the twist-induced superflow is sufficient to maintain a thin time-invariant front configuration. The calculated front velocity in Fig. 17 approximately agrees with the measurements down to about . It is therefore instructive to analyze the calculations, to identify where and by what mechanisms turbulent losses occur in the rotating column. This will be discussed in the next section.
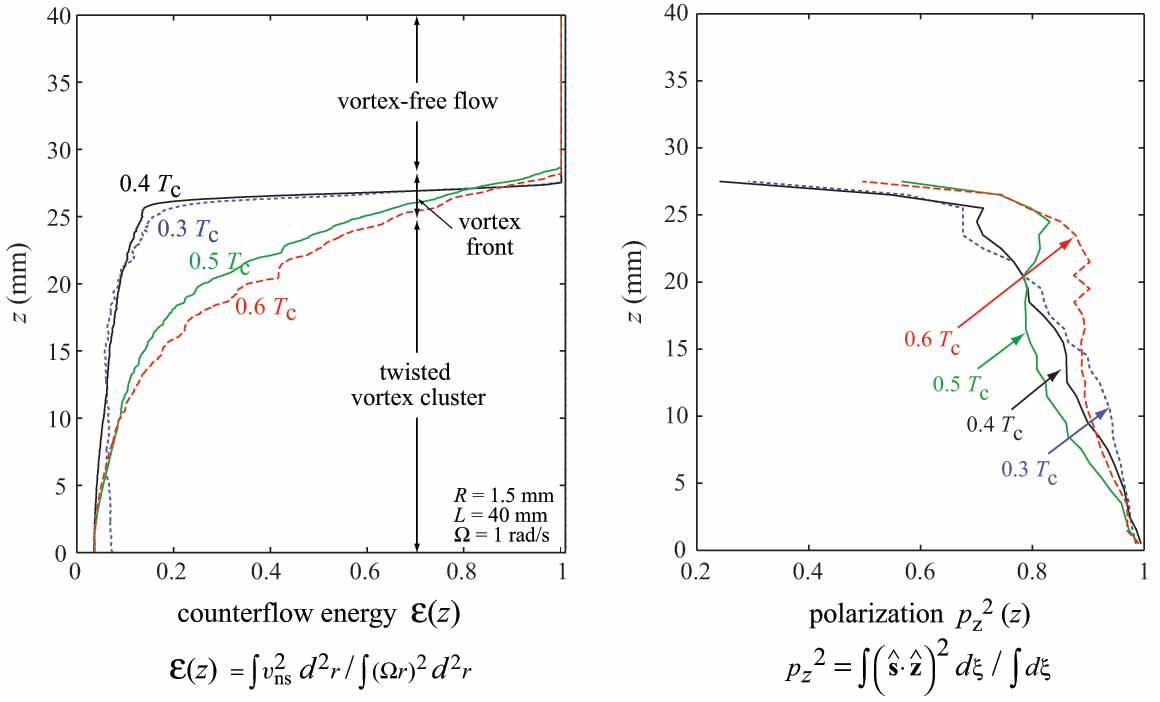
3.4 Numerical calculation of turbulence in vortex front propagation
| 0.3 | 0.4 | |
| Mutual friction parameter | 0.040 | 0.18 |
| Mutual friction parameter | 0.030 | 0.16 |
| Front velocity | ||
| Front velocity (mm/s) | ||
| Total Reconnection rate (event/s) | ||
| Number of vortex lines/cross section | ||
| Reconnection rate per line [events/(line s)] | 2.4 | 0.87 |
| Front shift during (mm) | 0.075 | 0.38 |
| Interline separation (mm) | 0.20 | 0.19 |
| Ratio | 0.36 | 2.0 |
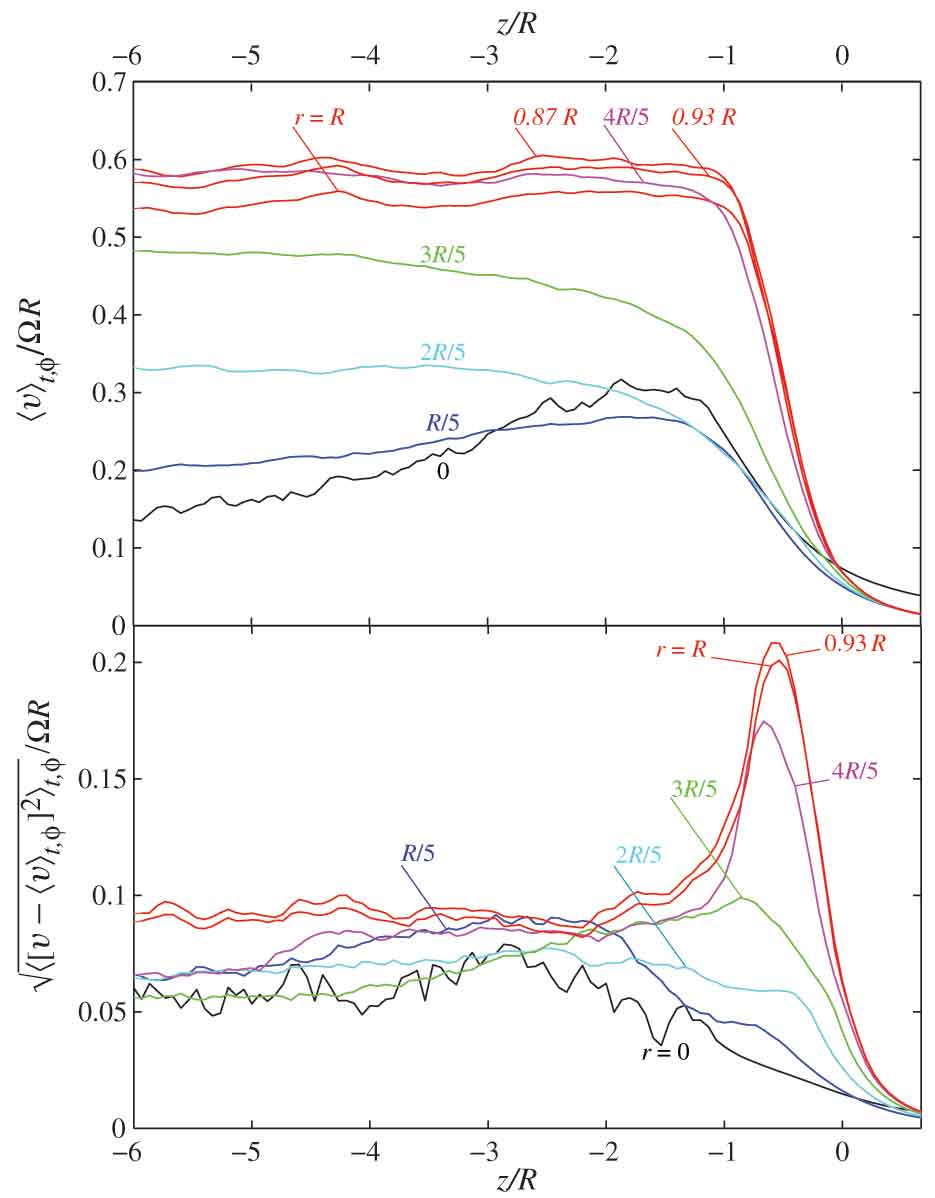
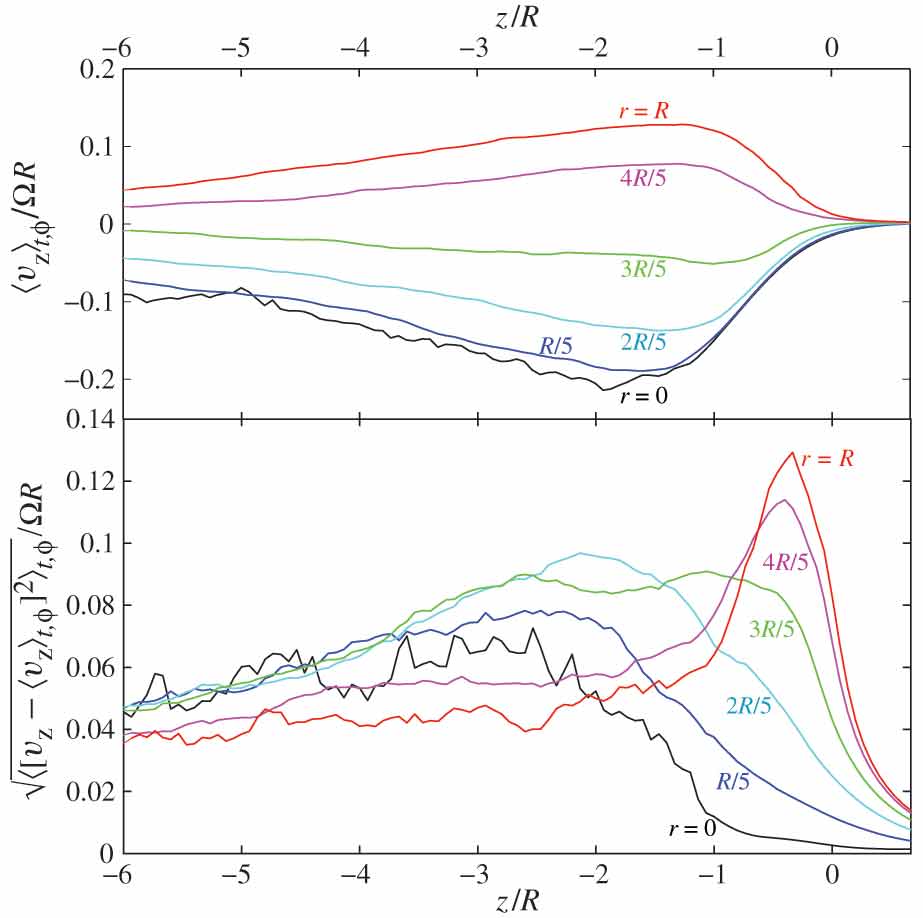
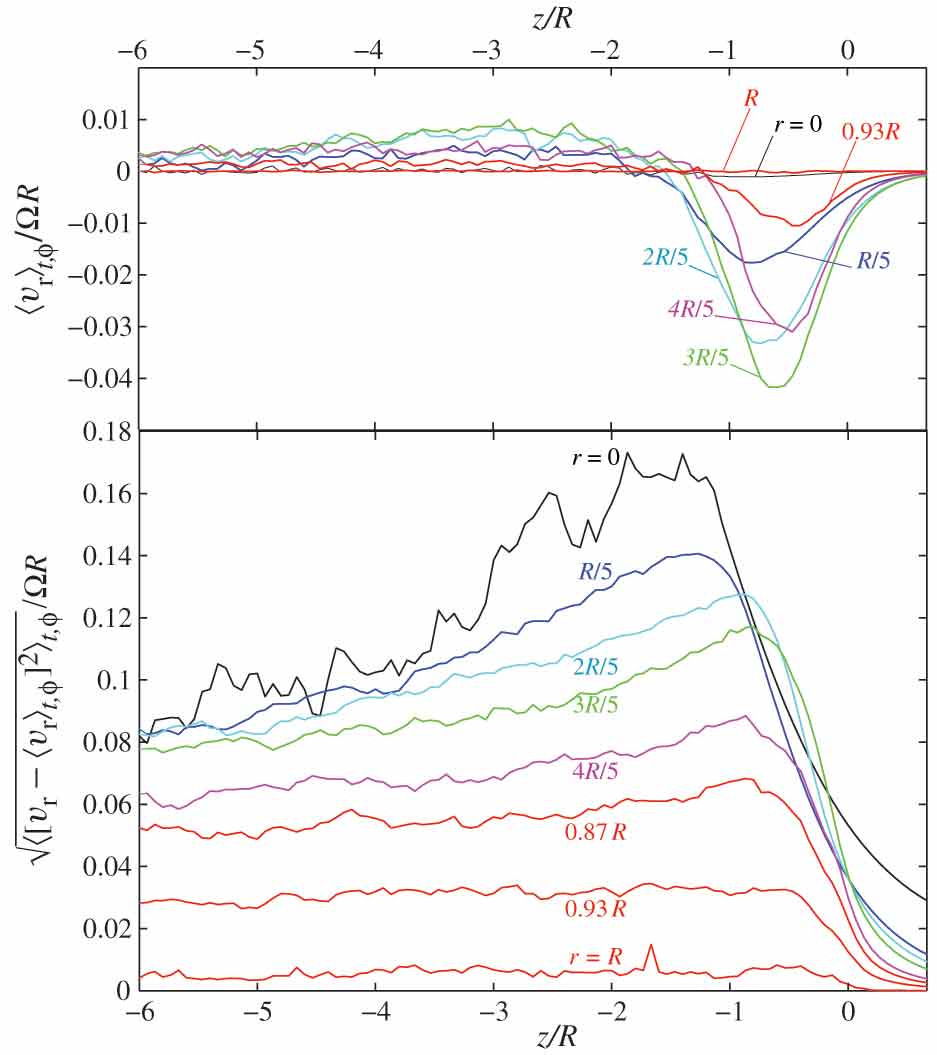
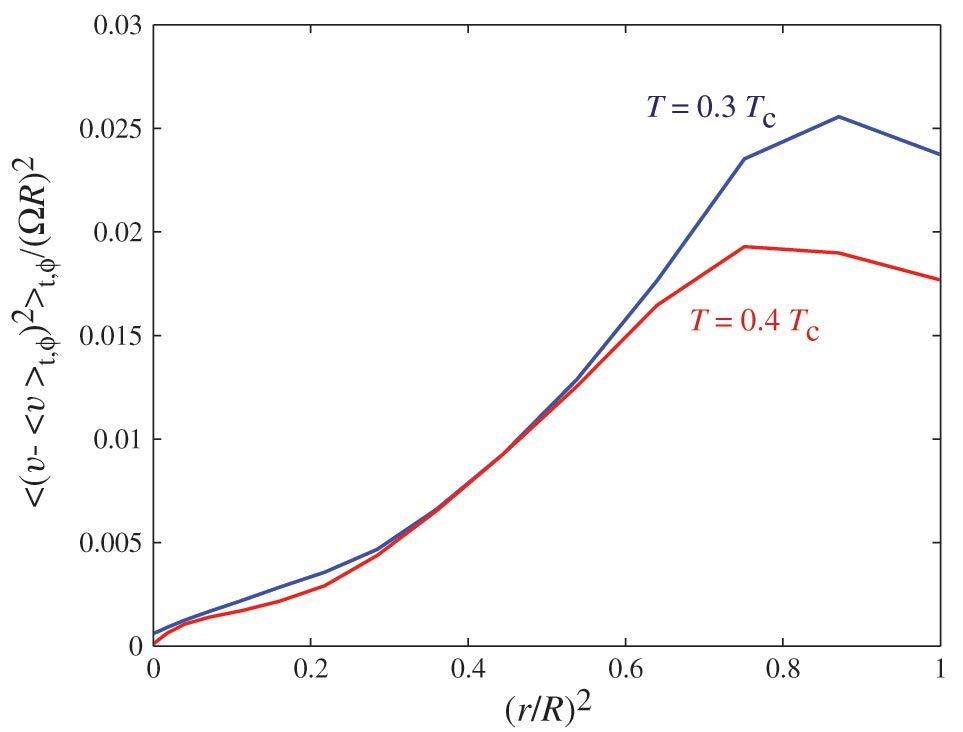
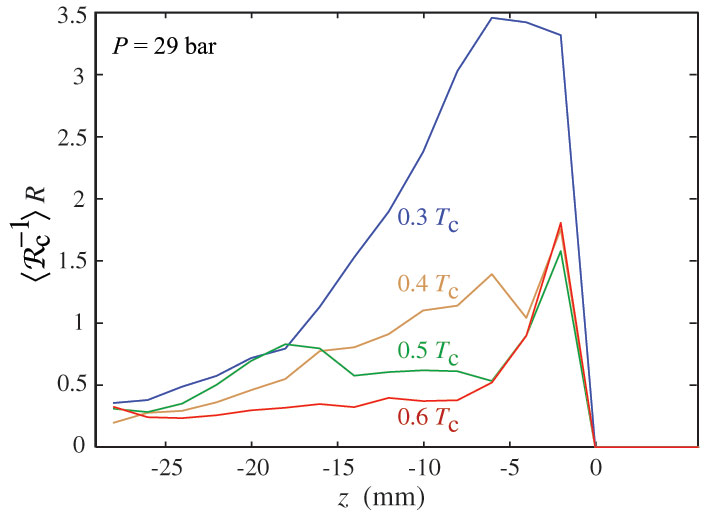
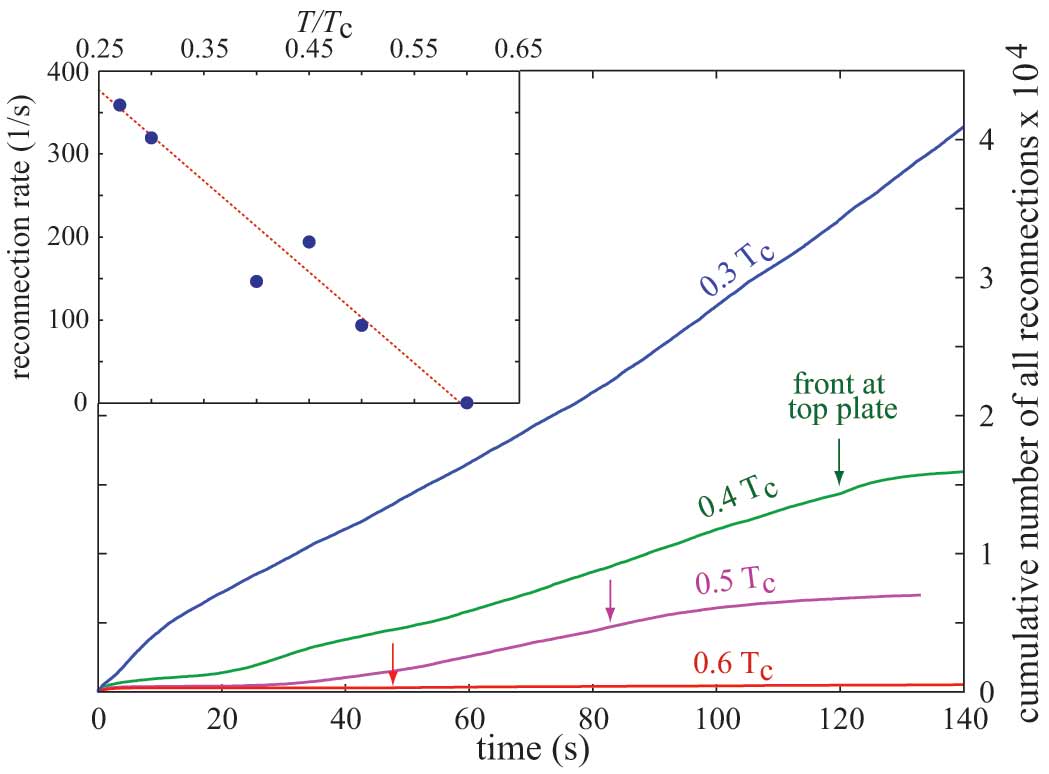
The promising agreement of the calculated vortex front velocity with the measurements in Fig. 17 suggests that numerical calculations could provide useful guidance for the interpretation of the measurements in Sec. 3.3 and for constructing the analytic theory in Sec. 3.5. Our main question is the following: Why are the numerical results on deviating with decreasing temperature more and more above the mutual-friction controlled extrapolation from the laminar regime? For simplicity we split the discussion of vortex motions to three different length scales: (i) large scales of order , where turbulent fluctuations become visible as variations in the number and distribution of vortices, (ii) the inter-vortex scale , where the presence of Kelvin-waves on individual vortex lines can be seen to grow, and (iii) small scales, where reconnections between neighboring vortices might occur and excite turbulent fluctuations on individual vortex lines. In contrast to the more usual studies of turbulent tangles, which generally monitor their free decay as a function of time when the external pumping is switched off, we are here dealing with highly polarized steady-state motion along the rotating column. This motion appears to remain intact down to the lowest temperatures, but becomes dressed with turbulent fluctuations in growing amounts towards decreasing temperatures.
Two examples are shown in Fig. 18 which illustrate the development with decreasing temperature. These configurations at and in an ideal column of radius mm rotating at rad/s have been calculated using the techniques described in Sec. 2.5. Similar results at and higher have been reported in the review by Finne et al. (2006b). The calculations are started from an initial configuration with roughly the equilibrium number of vortices placed as quarter-loops between the bottom end plate and the side wall of the cylinder. During the subsequent evolution the propagating vortex front is formed and the twisted cluster starts to acquire its shape (Hänninen 2006).
Above the motion is laminar with relatively smooth vortices, which only twist at large length scales. Below the thickness of the front (in the axial direction) settles at , where the parameter . The large-scale characteristics as a function of temperature from 0.3 to are displayed in Fig. 19 for the setup of Fig. 18. Here the counterflow energy is obtained by integrating the momentary distribution of counterflow over each cross section of the column, while the polarization is similarly derived by integrating over the vortices threading through this cross section. With decreasing temperature the front acquires more and more turbulent features which become visible as increasing small-scale structure: Kelvin waves, kinks, and inter-vortex reconnections. These small scale fluctuations exist on top of a strongly polarized vortex orientation, which is preserved even at . The high polarization along the rotation axis and the organized configuration of the twisted vortex cluster is expected to reduce loop formation and self-reconnection on individual vortex lines, but it also suppresses reconnections between neighboring vortices from what one would find in turbulent tangles. The amount of twist, in turn, is reduced by the unwinding from the slip of the vortices along the flat bottom end plate of the column.
The comparison of the two examples in Fig. 18 is continued further in Table 1. As a rule we expect that with decreasing mutual-friction damping turbulent disturbances are expected to cascade down to ever smaller length scales. In Table 1 this is examined by defining the quantity which measures on an average the distance over which the vortex front moves during the time interval between two inter-vortex reconnections. Since the axial motion of the front slows down and the reconnection rate increases with decreasing temperature, decreases rapidly below . Thus provides a measure between mutual friction and reconnections. The bottom line in Table 1 uses the dimensionless ratio to characterize the relative importance of mutual friction dissipation to reconnection losses. When , the energy loss from reconnections, which presumably excite Kelvin waves, is not important in the total energy balance of the propagation. At , where , this is what one expects. If , as is the case below , then it becomes possible that inter-vortex reconnections might play a role in the total energy balance. Table 1 thus hints that new phenomena are expected to emerge on length scales approaching the inter-vortex distance .
The characteristics of the propagating vortex front and the trailing twisted cluster are further illustrated in Figs. 20 – 22. In Fig. 20 it is the modulus of the total velocity of the superfluid component, , whose profiles are displayed. The top panel shows the velocity in the laboratory coordinate frame, averaged over time and azimuthal angle , while the bottom panel displays its mean fluctuation amplitude . In Fig. 21 it is the axial component and in Fig. 22 the radial component which are analyzed in the same fashion. The largest component is omitted, since its profiles are so similar to those of . In fact, at large radii the profiles of the two velocities as a function of are almost indistinguishable, while at small radii the axial velocity in Fig. 21 is the main contributor to .
The vortex front becomes clearly defined in Figs. 20 – 22. For instance, in Fig. 20 the steep almost linear rise in in the interval signifies the transition from the non-rotating state at to almost equilibrium rotation at at . This is the vortex front with its narrow thickness and strong shear flow, created by the vortices terminating within the front on the cylindrical side wall perpendicular to the axis of rotation. Below the front the number of vortices threading through any cross section of the cylinder remains roughly constant. This is seen from the fact that at the maximum value of , remains stable over the entire length of the twisted cluster, starting from immediately behind the front. At higher temperatures some vortices tend to fall behind the front and thus at one finds that slowly increases to at . Note also that radially the azimuthal flow increases monotonously behind the front up to the edge of the cluster at and then slightly decreases towards the cylindrical wall.
The fluctuations of around its mean value, as shown in the bottom panel of Fig. 20, are substantial, of order 30 % in the sharp peak created by the vortex front. The same applies to other velocity components, their fluctuations also tend to be largest in the front region and typically only half as large over the length of the twisted cluster. In Figs. 20 – 22 the fluctuations are sampled at a relatively slow rate of 2 Hz. As seen in Fig. 18, in the front the vortices are not perfectly distributed: It is this disorder in the structure of the front and the variations in its number of vortices which gives rise to the fluctuation peak. In Fig. 23 the radial distribution of the fluctuations in in the front region is analyzed. As expected, they grow rapidly towards large radii. In Sec. 3.5 we make use of this radial distribution.
However, not only large-scale disorder contributes to velocity fluctuations, but also Kelvin waves start to expand on individual vortices at temperatures , as seen in Fig. 18 (Hänninen 2006). In Fig. 24 a momentary vortex configuration (when the front has reached the height mm in Fig. 18) is broken down in curvature radii c and the average curvature is plotted as a function of . At the sharp peak at the front is caused by the vortices curving to the cylindrical side wall with . However, at the Kelvin wave contribution at shorter length scales becomes dominant and the average radius of curvature drops to mm. The characteristic Kelvin wave frequency corresponds at this length scale to 0.4 Hz (which is less than the sampling frequency of 2 Hz). Thus the dominant Kelvin waves are included in the velocity fluctuations in Figs. 20 – 22. Nevertheless, in these figures Kelvin waves represent only a small part of the total fluctuations in the sharp peak created by the front. This is seen from the fact that the peak is localized in the direction within the vortex front at , while the Kelvin-wave excitations in Fig. 24 extend half way down the twisted cluster to , as can also be directly seen from Fig. 18.
Fig. 25 shows that also reconnections between neighboring vortices become rapidly more frequent at temperatures (see also Hänninen (2006)). The reconnections peak in the region around , where the front ends and the twisted cluster starts. The increasing reconnection rate with decreasing temperature is one factor which helps to reduce the helical twist behind the front and might be one reason why the measured twist appears to be reduced towards low temperatures below (Fig. 15).
A further characteristic of front propagation in the rotating column is that fluctuations in vortex length are small, since these are mainly restricted to the transverse plane. The total vortex length in the moving front and in the twisted cluster behind it increases linearly in time and thus the fluctuations can be expressed with respect to a linearly increasing fitted average . The average deviation from the mean, turns out to be small: In the conditions of Fig. 18 at one obtains . This is as expected since fluctuations in length are energetically expensive in polarized vortex motion.
Finally, we point out two features which are seen in the calculations, which both grow in prominence with decreasing temperature below , but which have not yet been searched for in measurements. The calculations are started with the number of seed vortices equal to or larger than , but nevertheless, the number of vortex lines does not remain stable at during steady-state propagation.111In the equilibrium vortex state , where the width of the vortex-free annulus around the central cluster is (Ruutu et al. 1998b).
The first feature concerns the number of vortices which in free steady-state propagation thread through any cross section of the column behind the front. This number is roughly constant, but less than in equilibrium (for instance in Fig. 18 at , there are about 130 vortices per cross section while vortices). In the simplest model of the twist in Eq. (9) the number of vortices in the twisted state is smaller than in the equilibrium vortex state by the factor . This reduction is of correct order of magnitude compared to that seen in the calculations at . In addition to improving the stability of the twisted state, the reduction in the number of twisted vortices decreases the axial flow velocity (Fig. 21), which has the effect of reducing the longitudinal front velocity and counteracts its increase above the laminar extrapolation in Fig. 17. While the number of vortices per cross section of the twisted cluster decreases with decreasing temperature below , the density of vortices, nevertheless, remains constant over the cross section (but less than the equilibrium value: ). When the front finally reaches the upper end plate in Fig. 18 and the twist starts to relax, simultaneously gradually recovers and approaches from below.
The second feature of the calculations is that in steady state propagation the average length of the vortices is less than that of the twisted cluster (which means that the total number of individual vortices in the column may be well above ). For instance at in Fig. 18, the average length is mm and only mm for those vortices with both ends on the cylindrical side wall. Nevertheless, the polarization of all vortices along is high, %. After the front has reached the upper end plate in Fig. 18 and the twist starts relaxing, the short vortices provide an ample storage from which to add more vortices so that is reached.
To summarize the calculations, we return to our starting point, namely the increasing deviation of the calculated front velocity above the laminar extrapolation below (Fig. 17). The analysis of the calculated vortex configurations shows increasing turbulent disorder at large length scale , growing Kelvin-wave amplitudes on individual vortices on scales and the presence of inter-vortex reconnections. Combined these changes from the increasing turbulent influence with decreasing temperature make up for the difference, in the presence of a still finite mutual friction dissipation. An additional sink of energy is the cascading of Kelvin-wave excitations below the resolution limit of the numerical calculations (usually mm), which are lost from the energy balance. The calculations are in reasonable agreement with measurements down to , but at lower temperatures changes in the twisted cluster propagation appear to occur, to maintain stability and polarization. These have not been adequately studied and may lead to revisions of the current model at the very lowest temperatures.
3.5 Analytical model of turbulent front
The measured front velocity in Fig. 17 displays below two plateaus which are separated by a transition centered at . The numerical analysis in Sec. 3.4 places this transition in the temperature region where the Kelvin-wave cascade acquires growing importance, i.e. in the regime where sub-intervortex scales start to influence energy transfer. The peculiar shape of the measured curve prompted L’vov et al. (2007a) to examine energy transfer from the quasi-classical length scales (where bundles of vortices form eddies of varying size with a Kolmogorov spectrum) to the quantum regime (where Kelvin waves expand on individual vortex lines). The result is a bottleneck model (L’vov et al. 2008) which matches energy transfer across the crossover region from super-intervortex length scales to sub-intervortex scales. It can be fitted with reasonable parameters to the measured curve (Eltsov et al. 2007).
3.5.1 Two-fluid coarse-grained equations
To describe the superfluid motions on length scales exceeding the inter-vortex distance we make use of the coarse-grained hydrodynamic equation for the superfluid component. This equation is obtained from the Euler equation for the superfluid velocity , after averaging over the vortex lines which are assumed to be locally approximately aligned, forming vortex bundles which mimic the eddies in viscous flow (see the review by Sonin (1987)),
| (13) |
Here is the chemical potential and the mutual friction force (3), which can be rewritten as follows:
| (14) |
We use for the superfluid vorticity; is the unit vector in the direction of the mean vorticity; is the velocity of the normal component (which is fixed). In flow with locally roughly aligned vortices the mutual friction parameters define the reactive () and dissipative () forces acting on a bunch of vortex lines, as it moves with respect to the normal component in a field of slowly varying vortex orientation.
We shall work in the rotating reference frame where . In this frame, the reactive first term in Eq. (14) renormalizes the inertial term on the left hand side (LHS) of Eq. (13), introducing the factor (Finne et al. 2003). The relative magnitude of the two non-linear terms, the ratio of the inertial term and of the friction term [the latter is the second term on the RHS of Eq. (14)], is the Reynolds number in this hydrodynamics. It proves to be the flow velocity independent ratio of the dimensionless mutual friction parameters: (which was introduced by Finne et al. (2003) in the form ). To arrive at a qualitative description of the front we follow L’vov et al. (2004) and simplify the vectorial structure of the dissipation term and average Eq. (14) over the directions of the vorticity (at fixed direction of the applied counterflow velocity ). With the same level of accuracy, omitting a factor in the result, we get
| (15) | |||||
Here and henceforth denotes “ensemble averaging” in the proper theoretical meaning. From the experimental point of view can be considered as time averaging in a frame which moves with the front (over a time interval, during which the front propagates a distance equal to its width). The resulting mean values, to be discussed in Eqs. (16) and (19), can be considered as functions of (slow) time and space. We follow L’vov et al. (2004) and neglect the fluctuating turbulent part of in Eq. (15). We thus replace by its mean value, the vorticity from rotation. In this approximation Eq. (15) takes the simple form:
| (16) |
3.5.2 Flow geometry, boundary conditions and Reynolds decomposition
a. Axial flow geometry and flat idealization.
As a simplified model of the rotating cylinder we consider first the flat geometry with as the stream-wise, as the cross-stream, and as the front-normal directions. A more realistic axial symmetry will be discussed later. We denote the position of the front with and look for a stationary state of front propagation at constant velocity :
| (17) |
The normal velocity is zero everywhere, , which corresponds to co-rotation with the rotating cylinder. The vortex front propagates in the region , where the superfluid velocity is , while far away behind the front at the superfluid velocity tends to zero (i.e. towards the same value as the normal fluid velocity).
b. Reynolds decomposition and definitions of the model.
Following the customary tradition [see, e.g. Pope (2000)], we decompose the total velocity field into its mean part and the turbulent fluctuations with zero mean:
| (18a) | |||
| In our model | |||
| (18b) | |||
The following mean values are needed: the mean velocity shear , the turbulent kinetic energy density (per unite mass) and the Reynolds stress . Their definitions are as follows:
| (19a) | |||
| Also we will be using the kinetic energy density of the mean flow, | |||
| (19b) | |||
| and the total density of the kinetic energy | |||
| (19c) | |||
Clearly, the total kinetic energy in the system, , is:
| (20) |
3.5.3 Balance of mechanical momentum and kinetic energy
a. Balance of mechanical momentum.
Averaging Eq. (13), with the dissipation term in the form of Eq. (16), one gets for the planar geometry:
| (21) |
b. Mean-flow kinetic energy balance.
Multiplying Eq. (21) with one gets the balance for the kinetic energy of the mean flow, , defined in Eq. (19b):
| (22) |
The second term on the LHS of this equation describes the spatial energy flux and does not contribute to the global energy balance of the entire rotating cylinder. The next term, , is responsible for the energy transfer from the mean flow to the turbulent subsystem; this energy finally dissipates into heat. The last term, , represents direct dissipation of the mean flow kinetic energy into heat via mutual friction.
c. Turbulent kinetic energy balance.
Let us take Eq. (13) for the velocity fluctuations, with the dissipation term in the form Eq. (16), and we get an equation for the energy balance which involves triple correlation functions. It describes the energy flux in (physical) space. In the theory of wall bounded turbulence (Pope 2000) these triple correlations are traditionally approximated with second order correlation functions. For more details about the closure procedures we refer to L’vov et al. (2006a, 2007b) and references cited therein.
To be brief, notice that the total rate of kinetic energy dissipation in the vortex front has two contributions in well developed turbulence,
| (23a) |
The first term, , arises from mutual friction which acts on the global scale. It can be estimated from Eq. (13) as
| (23b) |
where is the turbulent kinetic energy from Eq. (19a). The second contribution, , originates from the energy cascade toward small scales, where the actual dissipation occurs. In well developed turbulence of viscous normal fluids this dissipation is caused by viscosity. It dominates at the smallest length scales, known as the Kolmogorov microscope. In superfluid turbulence the viscous contribution is absent. Instead, at moderate temperatures it is replaced by mutual friction. When mutual friction becomes negligibly small at the lowest temperatures, the turbulent energy, while cascading down to smaller length scales, is accumulated into Kelvin waves at some crossover scale. Ultimately the energy then cascades further down where it can dissipate, e.g. by the emission of excitations (phonos in 4He II and quasiparticles in 3He-B). In any case, the energy has to be delivered to small length scale motions owing to the nonlinearity of Eq. (13). Clearly in steady state conditions, the rate of energy dissipation at small scales, , is equal to the energy flux, , from the largest scales, where the energy is pumped into the system [from the mean flow via the shear , as follows from Eq. (22)]. The nonlinearity of Eq. (13) is of standard hydrodynamic form and the associated energy flux can be estimated by dimensional reasoning, as suggested by Kolmogorov in 1941 [see e.g. Pope (2000)]:
| (23c) |
Here is a dimensionless parameter, which in the case of classical (viscous) wall bounded turbulence can be estimated as [see e.g. L’vov et al. (2006a)]. In Eq. (23c) is the outer scale of turbulence (which defines the length scale of the largest eddies containing the main part of the turbulent kinetic energy). Clearly near the centerline of the cylinder, is determined by the thickness of the turbulent front at given radius : . Near the wall of the cylinder the size of the largest eddies is limited by the distance to the wall, . Therefore in this region, . In the whole cylinder, should be the smaller of these two scales, so that one can use an interpolation formula
| (23d) |
The resulting energy balance equation, which accounts for the energy dissipation in Eqs. (23), can be written (in cylindrical coordinates , , and ) as follows:
Here , , and are defined in Eqs. (19a). Generally speaking, they are functions of , , and time . The outer scale of turbulence, depends on and in our approximation (23d).
The right-hand-side (RHS) of Eq. (3.5.3) represents the energy flux (per unite mass) from the mean flow to the turbulent subsystem. This expression rigorously follows from Eq. (13) and is exact. The two terms on the LHS of Eq. (3.5.3) (proportional to and ) describe the energy dissipation (23). The last two terms on the RHS of Eq. (3.5.3) are proportional to the phenomenological dimensionless parameter , which was estimated by L’vov et al. (2007b). These terms model turbulent diffusion processes (in the differential approximation) with the effective turbulent diffusion parameter , now expressed in cylindrical coordinates. The first term in parenthesis describes turbulent diffusion in the direction normal to the front, which is the main reason for the propagation of the turbulent front. The second term, which vanishes in the flat geometry, describes the turbulent energy flux in the radial direction toward the centerline of the sample cylinder. This term plays an important role in the propagation of the front as a whole. The reason is that the central part of the front, where the direct conversion of the mean flow energy to turbulence is small, does not contain enough energy to exist without the radial flux of energy.
d. Total kinetic energy balance.
Adding from Eq. (22) and from Eq. (3.5.3) one can see that the term , responsible for the transfer of energy from the mean flow to the turbulent flow, cancels and we arrive at a balance equation for :
| Integrating this relation over the cylinder, we see that the energy diffusion terms do not contribute to the total energy balance: | |||||
| (25b) | |||||
| (25c) | |||||
To summarize this section, we note that Eqs. (21) and (3.5.3) allow us, at least in principle, (i) to describe the propagating turbulent front in a rotating superfluid, (ii) to find the front velocity , and (iii) to describe the structure of the front: its effective width , the profiles for the mean shear , the Reynolds stress , and the kinetic energy . Here we present only some preliminary steps in this direction, based on a qualitative analysis in Sec. 3.5.4 of the global energy balance (25), and discuss the role of the radial turbulent diffusion of energy in Sec. 3.5.5. In Sec. 3.5.6 we finally specify the model, accounting explicitly for the bottleneck at the classical-quantum crossover, as described by L’vov et al. (2007a), and explain how it is influenced by the temperature dependent mutual friction.
3.5.4 Qualitative analysis of global energy balance
The total kinetic energy is dissipated by the propagation of the turbulent front at constant velocity , as expressed in Eq. (8). This means that during time the length of the cylinder with unperturbed mean flow decreases by . Using Eq. (8) we can write the overall energy budget (25c) as:
| (26a) | |||
| This equation requires some corrections, because in its derivation we were a bit sloppy. First of all, approximation (16) for the mutual friction force cannot be applied for the analysis of laminar flow, where the actual orientations of vorticity and velocity are important. To fix this we present the RHS of Eq. (26a) as a sum of two contributions, | |||
| (26b) | |||
| and for we use Eq. (12). To get the corrected equation for we replace in Eq. (26a) with its turbulent part and replace with in order to account for the correction to the nonlinear term in Eq. (13) from the reactive part of the mutual friction (14) (proportional to ). Integrating the result over the azimuthal angle and making use of the axial symmetry of the problem, we get: | |||
| (26c) | |||
| The hydrodynamic equation (13) is not applicable near the wall, where is less than the mean inter-vortex distance . Therefore this region is excluded from the integration (26c). | |||
In the limit of a fully developed turbulent boundary layer (TBL), the turbulent kinetic energy and Reynolds stress are independent of the distance in the direction to the boundary of turbulence. Here we consider the turbulence in the front to be bounded in the direction, i.e. we assume that the front thickness and ignore the influence of the cylindrical container wall. Therefore it is reasonable in the qualitative analysis of Eq. (26c) to ignore the dependence of and , replacing these objects with their mean values across the TBL:
| (26d) |
As seen from Eq. (26d), we use the same approximation also for . Now we can trivially integrate Eq. (26c) with respect to :
| (26e) |
Here is the characteristic width of the TBL at the distance from the central axial. To perform the next integration over , one needs to know the -dependence of , , and . Notice first that has the dimension of velocity. Therefore one expects that in the self-similar regime of a fully developed TBL, has to be proportional to the characteristic velocity, which is . In other words, we expect that . As we will see below in Sec. 3.5.5, , while is -independent. With the same kind of reasoning we can conclude that and have to be proportional to , since they have the dimensionality of velocity squared:
| (27) |
Now integrating (26e) one gets
| (28a) | |||||
| (28b) | |||||
where we used . At rad/s, the ratio . This gives . We take and choose the parameters , , and to fit the measurement in the region (0.3 – 0.4) . With these parameters Eq. (28) gives in the limit (when ) and a very weak temperature dependence up to .
3.5.5 Role of the radial turbulent diffusion of energy
According to experimental observations, in steady state the front propagates as a whole with the velocity , independent of the radial position . To make this possible, the turbulent energy has to flow from the near-wall region, where the azimuthal mean velocity and consequently the energy influx into the turbulent subsystem are large, toward the center, where the influx goes to zero.
To clarify the role of the radial energy flux, consider Eq. (3.5.3), averaged in the direction:
| (29) |
On the RHS of this equation we replaced with its natural estimate . According to Eq. (23d), close to the cylinder axis . In this region Eq. (29) has a self-similar scaling solution (27), in which is indeed -independent, , and for the Reynolds-stress constant in Eq. (27) one finds the relationship:
| (30a) | |||
| In the vicinity of the wall, where , the outer scale of turbulence is and goes to zero when . To account for the influence of the cylindrical wall in this region we assume that, similar to a classical TBL, the two pair velocity correlations and have the same dependence on distance from the wall. Therefore their ratio is approximately constant: const. If so, the energy balance Eq. (3.5.3) dictates | |||
| (30b) | |||
with some relation between constants, similar to Eq. (30a). Actually, when becomes smaller than the inter-vortex distance , the whole hydrodynamic approach (13) together with Eq. (29) fails. Therefore we cannot expect that and really go to zero when . Rather they should approach some constant values dominated by the vortex dynamics at distances .
To summarize, we should say that Eq. (29) and its solution (30) cannot be taken literally as a rigorous result. They give a qualitative description of the kinetic energy profiles. Indeed, the predicted profiles are in qualitative agreement with numerical simulation calculations, as seen eg. in Fig. 23: Here goes to zero when , increases at small approximately as , as concluded in Eqs. (27) and (30a), reaches a maximum at and then decreases in qualitative agreement with Eq. (30b). Similar comparison with other numerical results in Sec. 3.4 makes it believable that the analysis of the global energy balance in Sec. 3.5.4 and the predicted plateau for in the limit are reasonable.
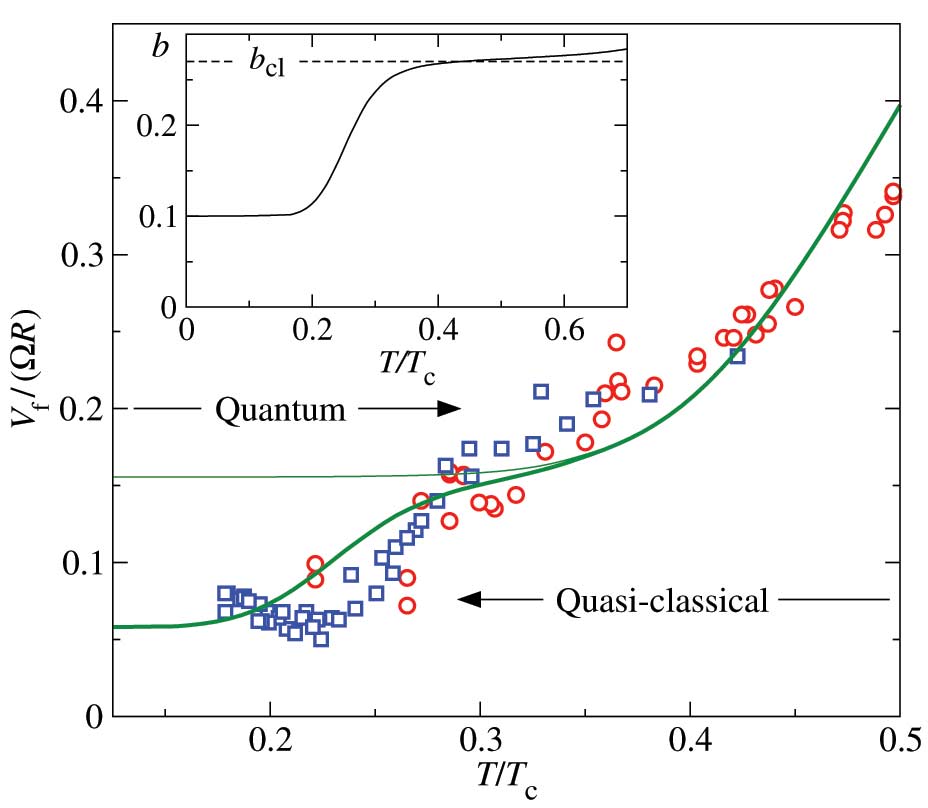
Nevertheless, both in the region of lower and higher temperatures the experiment shows deviation from this “plateau” (Fig. 26). The reason for this deviation at is that turbulence is not well developed near the cylinder axis where the shear of the mean velocity, responsible for the turbulent excitation, decreases. Therefore in the intermediate temperature region only part of the front volume is turbulent. When the temperature decreases, the turbulence expands toward the axis. We should therefore account also for the laminar contribution to the front velocity (12) near the axis. Notice furthermore that the simple sum of laminar and turbulent contributions to in Eq. (26b) oversimplifies the situation, by not accounting for the turbulent motions in Eq. (26c). We will not discuss this issue, but just suggest an interpolating formula between the laminar and turbulent regimes, which has a shorter intermediate region than Eq. (26b):
| (31) |
where and are given by Eqs. (12) and (28). This interpolation is shown in Fig. 26 as a thin line for and as a thick line for . The agreement with measurements above is good, but there is a clear deviation below , where . Below an explanation is outlined which takes into account the quantum character of turbulence, since as shown by Volovik (2003), individual vortex lines become important below in the region where the transition to the lower plateau occurs in Fig. 26.
To appreciate the last aspect note that the mean free path of 3He quasiparticles at the conditions of the measurements at 29 bar pressure and is close to , while at it exceeds . This change from the hydrodynamic to the ballistic regime in the normal component may influence the mutual friction force acting on individual vortices. However, what is important for the interpretation of the measurements is that the effect of the normal component on the superfluid component becomes negligibly small. Therefore it actually does not matter what is the physical mechanism of this interaction: ballistic propagation of thermal excitation with scattering on the wall or mutual friction that can only be described in the continuous-media approximation, as given by Eq. (14). For simplicity we use the hydrodynamic approximation (14) in Sec. 3.5.6 to describe the turbulent kinetic energy dissipation at low temperatures.
3.5.6 Mutual friction and bottleneck crossover from classical to quantum cascade
a. Bottleneck at zero temperature.
At low temperatures, when mutual friction becomes sufficiently small, the energy flux toward small length scales (or large wave vectors ) propagates down to the quantum scale and vortex discreteness and quantization effects become most important. Even though some part of the energy is lost in intermittent vortex reconnections, the dominant part proceeds to cascade below the scale by means of nonlinearly interacting Kelvin waves [see Vinen et al. (2003), Kozik and Svistunov (2008a, b) and references there]. The Kelvin waves are generated by both slow vortex filament motions and fast vortex reconnection events. As shown by L’vov et al. (2007a), the important point for the rate of energy dissipation (and consequently for the turbulent front velocity) is that Kelvin waves are much less efficient in the down-scale energy transfer than classical hydrodynamic turbulence: in order to provide the same energy flux as in the hydrodynamic regime, the energy density of Kelvin waves at the crossover scale has to be times larger than that of hydrodynamic motions. For 3He-B, , where is the vortex-core radius. Assuming that the energy spectrum is continuous at the crossover scale and that no other mechanisms intervene between the classical and Kelvin-wave cascades, then to maintain the same value of energy flux there must be a bottleneck pile-up of the classical spectrum near this scale by the factor . To account for this phenomenon of energy pileup, we construct the “warm cascade” solution which will be described in what follows.
For a qualitative description, we first define the hydrodynamic kinetic energy density (in the one-dimensional -space) , related to the total kinetic energy as follows:
| (32a) | |||
| The Kolmogorov-1941 cascade of hydrodynamic turbulence (with -independent energy flux, =const) is described with the spectrum: | |||
| (32b) | |||
The energy flux carried by the classical hydrodynamic turbulence with the K41 spectrum (32b) cannot adequately propagate across the crossover region at . Therefore, hydrodynamic motions on larger length scales (smaller wave-vectors) will have increased energy content up to the level , as required when the same energy flux has to be maintained by means of Kelvin waves. As a result, for the spectrum of hydrodynamic turbulence will not have the K41 scale-invariant form given by Eq. (32b). To get a qualitative understanding of the resulting bottleneck effect, we use the so called “warm cascade” solutions found by Connaughton and Nazarenko (2004). These solutions follow from the Leith (1967) differential model for the energy flux of hydrodynamical turbulence,
| (33) |
where is the 3-dimensional spectrum of turbulence. The generic spectrum with a constant energy flux can be found as the solution to the equation :
| (34) |
Here the range of large values belongs to the thermalized part of the spectrum, with equipartition of energy characterized by an effective temperature , namely of energy per degree of freedom, thus, and . At low , Eq. (34) coincides with the K41 spectrum (32b).
This “warm cascade” solution describes reflection of the K41 cascade and stagnation of the spectrum near the bottleneck scale which, in our case, corresponds to the classical-quantum crossover scale. To obtain the spectrum in the classical range of scales, it remains to find , by matching Eq. (34) with the value of the Kelvin wave spectrum at the crossover scale . This gives
Obviously, the transition between the classical and quantum regimes is not sharp and in reality we should expect a gradual increase of the role of the self-induced wave-like motions of individual vortex lines with respect to the collective classical-eddy type of motions of vortex bundles. Thus, the high-wavenumber part of the thermalized range is likely to be wave rather than eddy dominated. However, the energy spectrum for this part should still be of the same form which corresponds to equipartition of thermal energy. This picture, as explained below, relies on the assumption that the self-induced wave motions have small amplitudes and, therefore, do not lead to reconnections.
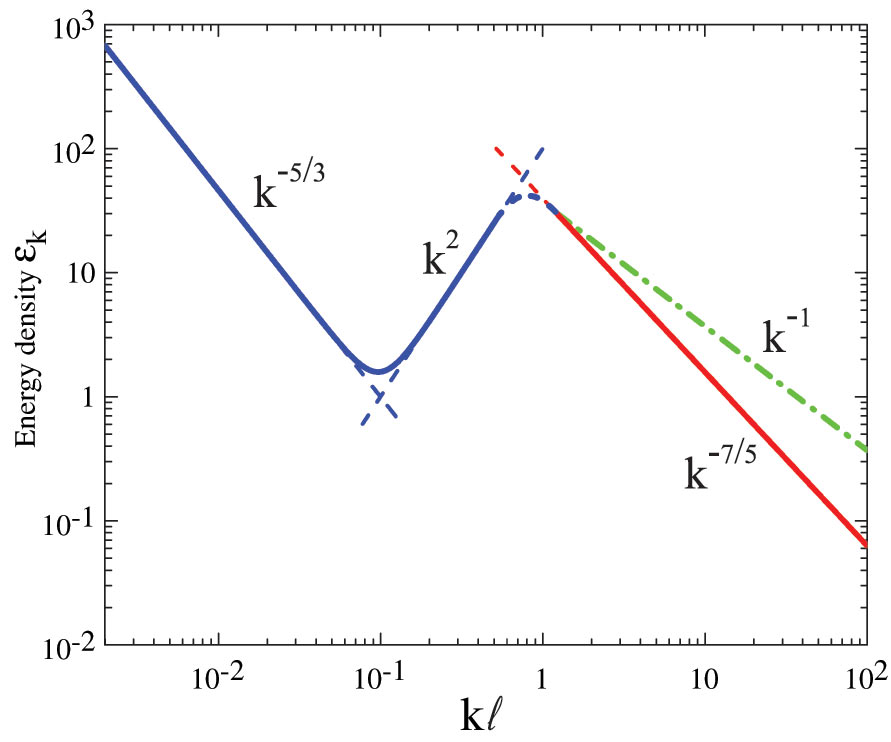
The resulting spectrum, including its classical, quantum and crossover parts, is shown in Fig. 27 as a log-log plot. It is important to note that in the quantum range , in addition to the cascading energy associated with Kelvin waves, there is also energy associated with the tangle of vortex filaments (shown in Fig. 27 with the dash-dotted line). The energy spectrum of this part is , which is simply the spectrum associated with a singular distribution of vorticity along 1D curves in 3D space (Araki et al. 2002). It does not support a down-scale cascade of energy. The cascading and non-cascading parts have similar energies at the crossover scale, that is the wave period and the amplitude are of the order of the characteristic time and size of evolving background filaments. In other words, the scales of the waves and of the vortex “skeleton” are not separated enough to treat them as independent components. This justifies matching the classical spectrum at the crossover scale with the Kelvin wave part alone, ignoring the vortex “skeleton”. This is valid up to an order-one factor and justifies the way of connecting the “skeleton” spacing to the cascade rate .
b. Effect of mutual friction on the bottleneck crossover.
Returning back to the propagating turbulent vortex front, recall that in the measurements of Sec. 3.3 the inertial interval is about one decade. Therefore the distortion of the energy spectrum owing to the bottleneck reaches the outer scale of turbulence. This leads to an essential suppression of the energy flux at any given turbulent energy or, in other words, to a decrease in the effective parameter , which relates and in the estimate (23c). The effect is more pronounced at low temperatures when mutual friction is small; thus should decrease with temperature. We analyze this effect with the help of the stationary energy balance equation for the energy spectrum in -space
| (35) |
where is the temperature dependent damping in Eq. (16), and the energy flux over scales is taken in the Leith (1967) differential approximation. In addition to Eq. (33), we included in Eq. (35) the mutual friction correction factor and substituted .
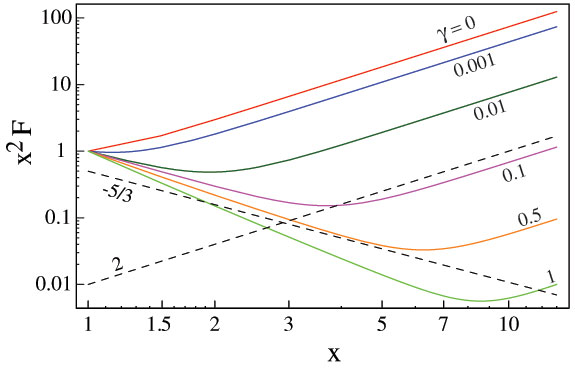
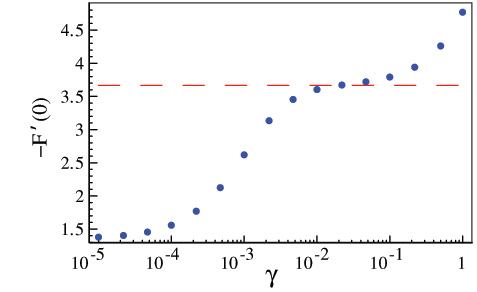
Figure 28 displays the set of solutions for Eq. (35). We use as the ratio of the outer and crossover scales and characterize the bottleneck with the boundary condition at the crossover scale. One goal of these calculations is to find the slope of the function at the beginning of the inertial interval which, according to Eq. (35), characterizes the rate of energy input into the system at fixed value of the total energy , i.e. the phenomenological parameter in the estimate (23c). The dashed line in the right panel shows the Kolmogorov value of this slope, , which is associated with the classical value of . Thus the ratio can be interpreted as the effective value of for a given value of damping . To relate with the temperature dependent value , we substitute the independent from Eq. (27) to Eq. (16). This gives . The resulting function , shown in the inset of Fig. 26 (for rad/s), decreases from its classical value to at . Now, after accounting for the temperature dependence of in Eq. (28), we get the temperature dependence for the propagation velocity of the quantum-turbulent front shown in Fig. 26 by the bold-solid line below . This fit is in good agreement with the measured data. We thus have to conclude that in this particular measurement the rapid drop in the dissipation rate on entering the quantum regime can be explained as a consequence of the relatively close proximity of the outer and quantum crossover scales in this measuring setup.
3.6 Summary: turbulent vortex front propagation
In 3He-B strong turbulence is restricted to the lowest temperatures below . Depending on the type of flow, turbulence varies in form and losses. The usual reference point is an isotropic and homogeneous turbulent vortex tangle. Here we have discussed an opposite extreme, the conversion of metastable rotating vortex-free counterflow to the stable equilibrium vortex state in a long circular column. The task is to explain how increasing turbulence with decreasing temperature influences this type of polarized vortex motion in steady state propagation. The deterministic part of the motion takes place in the form of a spiraling vortex front followed by a helically twisted vortex cluster. When mutual friction decreases, turbulent losses start to contribute to dissipation, concentrating in the propagating front and immediately behind it.
Experimentally the conversion of a metastable vortex-free state to an equilibrium array of rectilinear vortex lines can be arranged to occur at constant externally adjusted conditions. This is done with different types of injection techniques, which trigger the formation of a propagating vortex front and the trailing twisted cluster behind it. In a long rotating column the propagation can be studied in steady state conditions. At temperatures above the propagation is laminar, but below a growing influence from turbulence appears. This is concluded from the measured propagation velocity which provides a measure of the dissipation in vortex motion. In addition to the increasing turbulent dissipation below , the measurement shows a peculiar transition at between two plateaus, and a temperature independent finite value of dissipation on approaching the limit.
So far measurements on vortex propagation exist only for a column with circular cross section. This is an exceptional case of high stability (if the cylindrical symmetry axis and the rotation axis are sufficiently well aligned). Here the crossover from the laminar to the turbulent regime is smooth as a function of mutual friction dissipation. The same smooth behavior is also seen in the response to spin down, after a step-like stop of rotation. This is in stark contrast to the spin down of a column with square cross section, as we will see in Sec. 4. Similar differences seem to apply in viscous hydrodynamics where flow in a circular pipe is believed to be asymptotically linearly stable for all Reynolds numbers, in contrast to a pipe with square cross section (Peixinho and Mullin 2006). In these measurements the formation and decay of turbulent plugs is monitored. Vortex plugs and fronts have also been observed in pipe flow of superfluid 4He through long circular capillaries (Marees et al. 1987).
Numerical vortex dynamics calculations have been used to examine the turbulent contributions to dissipation in vortex front propagation. This analysis demonstrates the increasing role of turbulent excitations on sub-intervortex scales with decreasing temperature. Analytical arguments have been developed which explain that the transition to the lower plateau in the measured overall dissipation is caused by the difficulty to bridge the energy cascade from the quasi-classical to the quantum regime as a function of decreasing mutual friction dissipation. This bottleneck-scenario of L’vov et al. (2007a) in energy transfer was thus directly inspired by the experimental result. It is expected to apply foremost to polarized vortex motion in the rotating column where vortex reconnections are suppressed. This situation differs from the case of an ideal homogeneous vortex tangle, where Kozik and Svistunov (2008a, b) suggest that a bottleneck is avoided owing to the high reconnection rate.
As for the second leveling off at the lowest temperatures, at present time three different types of measurements [Bradley et al. (2006), Eltsov et al. (2007), Walmsley et al. (2007a)] conclude that dissipation in vortex motion remains finite at the lowest temperatures. This applies for both the fermion superfluid 3He-B and the boson case of 4He. Although the mechanisms for dissipation in the limit in these two superfluids are different and still under discussion, the results demonstrate that coherent quantum systems can be inherently lossy even in the state.
4 Decay of homogeneous turbulence in superfluid 4He
4.1 Introduction and experimental details
4.1.1 Quasiclassical and ultraquantum types of superfluid turbulence
In this section we switch to nearly homogeneous and isotropic superfluid turbulence with an emphasis on the recent experiments in Manchester. A truly homogeneous turbulence is of course impossible to achieve in real experiments because the tangle is always confined by the container walls and can have other inhomogeneities specific to the particular process of its generation.
The modern paradigm of homogeneous isotropic turbulence at high Reynolds numbers in classical liquids is that there is a broad range of wavenumbers within which the energy, pumped at large scales, gets continuously redistributed without loss towards smaller length scales thus arranging a steady-state distribution in -space of the Kolmogorov type (Kolmogorov 1941a, b, Batchelor 1953, Frisch 1995) (Eq. (32b))
| (36) |
where the Kolmogorov constant was found to be (Sreenivasan 1995). In the steady state, the energy flux is equal to the dissipation of the kinetic energy through the shear strain in the flow at short length scales; its rate integrates to
| (37) |
where is the kinematic viscosity and is the r.m.s. vorticity. In realistic systems, the distribution Eq. 36 is truncated at small by either the length scale of forcing or the container size , and at large by the Kolmogorov dissipation scale which decreases with increasing . In superfluids, the inertial cascade is expected to operate if the mutual friction parameter is sufficiently small (Vinen 2000). At large length scales the cascade is classical. However, at short length scales the cascade becomes quantum as the discreteness of the vorticity in superfluids adds new behaviour. At sufficiently low temperatures, when the energy reaches very small scales without dissipation, it is expected that the quantum cascade takes the form of a non-linear cascade of Kelvin waves (Svistunov 1995, Kozik and Svistunov 2004), eventually being truncated at some quantum dissipation scale . While the theory of this regime at very high is now established, no direct observations exist so far. The most complicated is, of course, the transitional region between these two clear-cut limits, the Kolmogorov and Kelvin-wave cascades. The question being currently debated is whether the energy stagnates at due to the poor matching in the kinetic times of the two cascades (L’vov et al. 2007a), or gets efficiently converted from 3-d classical eddies to 1-d waves along quantized vortex lines with the help of various reconnection processes (Kozik and Svistunov 2008a).
When comparing the two superfluid isotopes from the experimental point of view, the limit in superfluid 4He is achievable at some K (Vinen 2000, Walmsley et al. 2007a) while for 3He-B much lower temperatures mK are required. Owing to the two or three orders of magnitude smaller core size in 4He, nm, the Kelvin-wave-cascade is expected to extend over a broader range of length scales, down to nm (Vinen 2001, Kozik and Svistunov 2008b). It has been suggested (Vinen 2002, Vinen and Niemela 2002) that in 3He-B Kelvin waves should become overdamped at frequencies kHz (corresponding to wavelengths m) due to the resonant scattering on core-bound quasiparticles (Kopnin and Salomaa 1991)).
Flow on a scale greater than the inter-vortex distance , which is initially typically between and 100 m in experiments, can be obtained by mechanical stirring of the liquid. So far the following methods have been used: counter-rotating agitators with blades (Maurer and Tabeling 1998), pipe flow (Smith et al. 1999, Roche 2007), flow through an orifice (Guenin and Hess 1978), towed grids (Smith et al. 1993, Stalp et al. 1999, Niemela et al. 2005), vibrating grids (Davis et al. 2000, Bradley et al. 2006, Fisher and Pickett 2008, Hänninen et al. 2007b, Vinen and Skrbek 2008), as well as wires (Bradley 2000, Nichol et al. 2004), and microspheres (Schoepe 2004), plus most recently impulsive spin-down to rest of a rotating container (Walmsley et al. 2007a). It is also possible to initiate large-scale flow in superfluid 4He without any moving parts or rotation of the cryostat: by either running thermal counterflow in wide channels at K (Barenghi and Skrbek 2007, Chagovets et al. 2007) or a jet of injected current (Walmsley and Golov 2008a).
Actually, the turbulence can take two very different forms depending on whether the forcing is at scales above or below . So far we were discussing the flow on classical scales , where the energy cascades towards shorter length scales like in the Richardson cascade in classical turbulence; the large quasiclassical eddies being the result of correlations in polarization of vortex lines. On the other hand, when forced on quantum scales , the resulting uncorrelated tangle has no classical analogs and should have completely different dynamics first described by Vinen (1957a, b, c, 1958) and later investigated numerically by Schwarz (1988). In both cases, the dissipation of flow energy is through the motion of vortex lines; its rate per unit mass can be assumed to be (Stalp et al. 1999, Vinen 2000, Stalp et al. 2002)
| (38) |
where is an effective total mean square vorticity and the parameter is believed according to various models to be approximately constant for a given temperature and type of flow. This formula is the quantum analog of the classical expression Eq. (37). As we will show below, the efficiency of the vortices in dissipating energy in the limit, expressed through the “effective kinematic viscosity” , is different for these two regimes of turbulence.
To measure the values of , one can monitor the free decay of homogeneous tangles of both types. In any tangle, the quantum energy associated with the quantized flow on length scales is (per unit mass), where the energy of vortex line per unit length is and is approximately constant. This is the same energy that is shown in the quantum range (including both non-cascading vortex “skeleton” and Kelvin-waves) in Fig. 27. If the total energy is mainly determined by , from Eq. (38) we arrive at the late-time free decay
| (39) |
This type of turbulence, without any motion on classical scales, will be called ultraquantum (in the literature one can find e.g. “Vinen turbulence” (Volovik 2003, 2004) and “random” or “unstructured” vortex tangle). For 4He, , nm and , while for 3He-B, , nm and .
Now suppose that the tangle is not random but structured due to the presence of flow on classical length scales , and the additional energy of this classical flow is much greater than . This type of turbulence will be called quasiclassical (e.g. “Kolmogorov turbulence” and “structured” or “polarized” vortex tangle). For the Kolmogorov spectrum between wavenumbers and (), while the size of the energy-containing eddy stays equal to the size of container (i.e. ), the late-time free decay follows (Stalp et al. 1999)
| (40) |
Eventually, when the energy flux from the decay of classical energy will become smaller than that from the quantum energy (which should typically happen when only a couple of vortex lines are left in the container, i.e. ), the quasiclassical regime will cross over to the ultraquantum one, so decay will be replaced by . Deviations from the described scenario are also possible if some fraction of the classical energy is stored in non-cascading “thermal spectrum” (L’vov et al. 2007a).
In this Section we first review the relevant experimental techniques of detecting and generating turbulence. Next we describe the more recent new developments at the very lowest temperatures. The results of these measurements will be discussed in detail in the last part of this section, where we conclude with a general discussion of the significance of the observed temperature dependence of .
4.1.2 Techniques of measuring the vortex line density
The attenuation of second sound in superfluid 4He, which is proportional to the total length of vortex lines, has been the prefered technique of measuring in the temperature range 1 – 2 K (Vinen 1957a, Stalp et al. 1999, Niemela et al. 2005, Barenghi and Skrbek 2007) since Hall and Vinen (1956), however it cannot be extended below 1 K. Very recently, scattering of negative ions off vortex lines has been succesfully utilized at temperatures 80 mK – 1.6 K (Walmsley et al. 2007a), showing good agreement with previous measurements of at overlapping temperatures (Stalp et al. 2002). Actually, the first use of ions for the observations of a vortex tangle was reported almost fifty years ago (Careri et al. 1960), and numerous further experiments revealed their potential for investigating turbulence in superfluid 4He (see the reviews by Tough (1982) and Donnelly (1991) for more references on early studies).
It is worth mentioning possible alternative techniques of detecting turbulence in 4He in the limit that are currently being developed, such as calorimetric (Ihas et al. 2008) and others (Vinen 2006). The design of towed grid for turbulence generation, suitable for experiments at K in 4He is presently being attempted by McClintock at Lancaster and Ihas at Gainsville. Optical vizualization of individual vortex lines in the turbulent tangle (Bewley et al. 2006, 2008, Zhang et al. 2005, Rellergert et al. 2008, Sergeev et al. 2006) (see the contribution by Van Sciver and Barenghi (2008) in this volume) is another promising development, although the prospects of extending this technique down to at least K seem distant. As we mentioned in Sec. 2 and 3, computer simulations have contributed a great deal to our understanding of certain processes in the dynamics of tangles and of the Kelvin-wave cascade at in particular (Schwarz 1988, Kivotides et al. 2001, Tsubota et al. 2000, Vinen et al. 2003, Hänninen et al. 2007b) (see also the contribution by Tsubota and Kobayashi in this volume); however the proper modelling of the inertial cascade pumped at large (quasiclassical) length scales and dissipated at short (quantum) scales requires a considerable range of length scales and hence remains a challenge.
4.1.3 General properties of injected ions in liquid helium
Injected ions (see reviews (Schwarz 1975, Fetter 1976, Donnelly 1991, Borghesani 2007)) are convenient tools to study elementary excitations and quantized vortices in superfluid helium. They were used to detect vortex arrays in rotating helium (Careri et al. 1962, Yarmchuk et al. 1979), quantized vortex rings (Rayfield and Reif 1964), and vortex tangles (Careri et al. 1960) in 4He. To create a negative ion, an excess electron is injected into liquid helium, where it self-localizes in a spherical cavity (“electron bubble”) of radius nm at zero pressure. To create a positive ion, an electron is removed from one atom, which results in a positively-charged cluster ion (“snowball”) of radius nm. These objects are attracted to the core of a quantized vortex, resulting in trapping with negligible escape rate provided the temperature is low enough ( K for negatives and K for positives in 4He at zero pressure). Because of this interaction, both species have been used a great deal to study quantized vortices although negative ions are often more convenient, especially if one wants to cover a wider range of temperatures. The binding energy of a negative ion trapped by a vortex is about 50 K (Donnelly 1991). In superfluid 3He, thanks to much larger diameters of vortex cores this binding is much weaker, hence there were no observations of ion trapping on vortex cores yet. Still, the anisotropy of ions motion in 3He-A made it possible to use negative ions to detect textural changes around vortex cores (Simola et al. 1986).
In this section, we focus on negative ions in superfluid 4He. Their mobility is limited by scattering thermal excitations and is hence rapidly increasing with cooling. Below some 0.8 K it is so high that they quickly reach the critical velocity for creation of (depending on pressure and concentration of 3He impurities) either rotons (and then move with the terminal Landau velocity m/s, shedding off rotons continuously) or quantized vortex rings (and then get trapped by such a ring and move with it as a new entity – a charged vortex ring) (Hendry et al. 1990, Hendry et al. 1988, Winiecki et al. 2000, Berloff and Roberts 2000a, b). Above 1 K, the trapping diameter of an ion by a vortex line is inversely proportional to the electric field, . In a field V/cm it is decreasing with temperature from nm at K to nm at K (Ostermeier and Glaberson 1974).
Rayfield and Reif (1964) produced singly-charged singly-quantized vortex rings in 4He at K and, by measuring the dependence of their self-induced velocity , Eqs. (41) – (42), on their energy , confirmed the value of the circulation quantum cm2s-1. Schwarz and Donnelly (1966) investigated the trapping of charged vortex rings by rectilinear vortices in a rotating cryostat and found the trapping diameter to be of order of the ring radius, meaning that the interaction is basically geometrical. They wrote: “quantized vortex rings are very sensitive “vortex-line detectors,” making them suitable probes for a number of problems in quantum hydrodynamics”. Guenin and Hess (1978) used charged vortex rings to detect turbulent vortex tangles in 4He at K, created by forcing a jet of superfluid through an orifice at supercritical velocities.
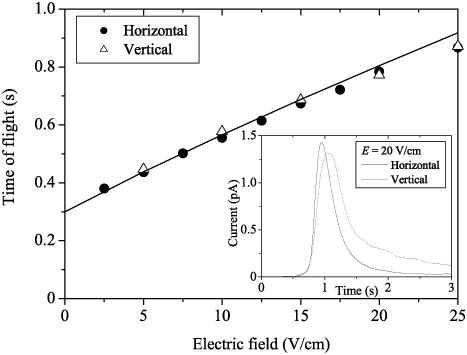
While charged vortex rings are more convenient than free ions because of their much greater trapping diameter, their dynamics is more peculiar (Fig. 29; all figures in Sections 4.1–4.3 represent the Manchester experiments (Walmsley et al. 2007a, Walmsley and Golov 2008a)). The energy , velocity and impulse of a quantized vortex ring of radius with a hollow core of radius and no potential energy in the core are (Glaberson and Donnelly 1986, Donnelly 1991)
| (41) |
| (42) |
| (43) |
By integrating these equations, one can calculate the trajectories of the charged vortex rings subject to a particular electric field (Walmsley et al. 2007b).
4.1.4 Measuring the vortex line density by ion scattering
In the absence of vortex lines the ions would propagate either freely (these dominate at K) or riding on small vortex rings (dominate at K). Without other vortex lines in their way, the time of flight of both species over a particular distance is a well-defined function of temperature, electric field, and initial radius of the attached vortex ring (if any). Hence, after injecting a short pulse of such ions, a sharp pulse of current arrives at the collector as shown in Fig. 30. The interaction with other existing vortices, that happened to be in the way of the propagating ions, is characterized by a “trapping diameter” (Schwarz and Donnelly 1966, Ostermeier and Glaberson 1974) and leads to the depletion of the pulses of the collector current. This is used to measure the average density of vortex lines between the injector and collector through
| (44) |
To calibrate the value of for either free negative ions or ions trapped on a vortex ring at different temperature and electric field, one can measure the attenuation of the pulses of the collector current when the cryostat is at continuous rotation at angular velocity (thus having an equilibrium density of rectilinear vortex lines ) as in figure 31. This is best done in the direction perpendicular to the rotation axis.
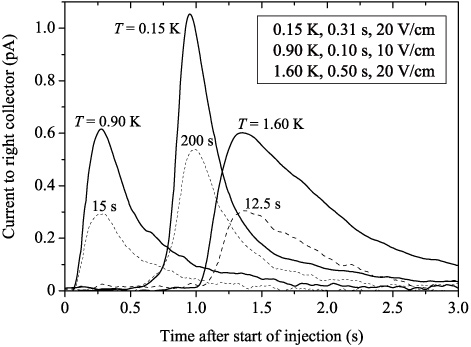
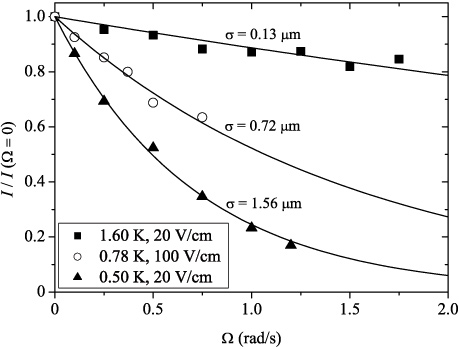
At low temperatures in quantum cascade Kelvin waves of a broad range of wavelengths are excited, however the main contribution to the total length converges quickly at scales just below (Kozik and Svistunov 2008b). Hence, a probe ion with the trapping diameter , moving at a speed ( cm/s) much greater than the characteristic velocities of vortex segments ( cm/s), should sample the full length . Experimental measurements with different –1.7 m (using charged vortex rings in a range of driving electric fields) indeed produce consistent values of .
There are evidences that small concentrations of trapped space charge (when the ratio of trapped space charge density to the vortex line length , does not exceed cm-1) do not affect the tangle dynamics (Walmsley and Golov 2008b). For example, experiments generating quasiclassical tangles at K by a jet of ions (and hence resulting in a substantial trapped space charge) revealed that the late-time decay is identical to that for the tangles generated by an impulsive spin-down to rest without injecting any ions. Still, one might worry that the very presence of trapped charge, as it interacts with the beam of probe ions, might affect the result of measuring . Hence, in order not to introduce extra turbulence and not to contaminate the tangle with any ions, the measurement was performed by probing each realization of turbulence only once – after a particular waiting time during its free decay. Then the contaminated tangle was discarded and a fresh tangle generated.
4.1.5 Design of ion experiment
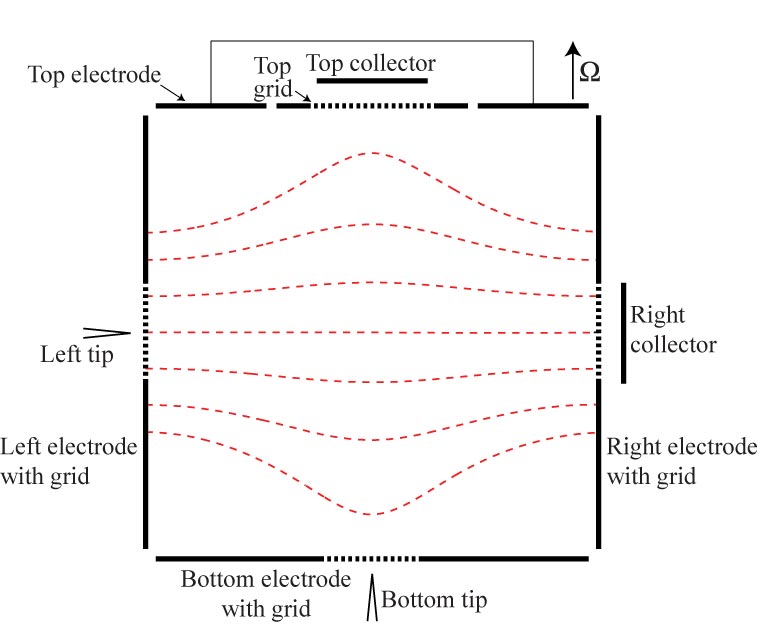
The cell used in the Manchester experiments had cubic geometry with sides of length cm. A schematic drawing of the cell is shown in Fig. 32. The relatively large size of the cell was important to enhance the efficiency of ion trapping and the time resolution of vortex dynamics, and was really instrumental to ensure that the continuum limit holds even when the vortex line density drops to as low as just cm-2. This also helped ensure that the presence of the walls, which might accelerate the decay of turbulence within some distance , does not affect the dynamics of the turbulent tangle in the bulk of the cell. In order to probe the vortex densities along the axial and transverse directions, there were two independent pairs of injectors and collectors of electrons. Both injectors and collectors were protected by electrostatic grids, enabling injecting and detecting pulses of electrons. The injectors were field emission tips made of 0.1 mm diameter tungsten wire (Golov and Ishimoto 1998). The threshold for ion emission was initially -100 V and -210 V for the bottom and left injectors respectively; however, after over two years of almost daily operation they changed to some -270 V and -520 V. The fact that the two injectors had very different threshold voltages helped investigate the dependence (or rather lack of it) of the radius of initial charged vortex rings on the injector voltage. The six side plates (electrodes) that make up the cube can be labeled “top”, “bottom”, “left”, “right”, and two “side” electrodes. The top, bottom, left and right electrodes had circular grids in their centers. All grids were made of square tungsten mesh with period 0.5 mm and wire diameter 0.020 mm, giving a geometrical transparency of 92%. The grids in the bottom, left and right plates had diameter 10 mm and were electrically connected to those plates. The grid in the top plate had diameter of 13 mm and was isolated from the top plate. The injector tips were positioned about 1.5–2 mm behind their grids. The two collector plates were placed 2.5 mm behind their grids and were typically biased at +10 – +25 V relative to the grids. Further details can be found in Walmsley et al. (2007b).

4.1.6 Tangles generated by an impulsive spin-down
This novel technique of generating quasiclassical turbulence, suitable for any temperatures down to at least 80 mK, relied on rapidly bringing a rotating cubic-shaped container of superfluid 4He to rest (Walmsley et al. 2007a). The range of angular velocities of initial rotation was 0.05–1.5 rad/s. In classical liquids at high , spin-down to rest is always unstable, especially at high deceleration and in axially asymmetric geometries. It is known that, within a few radians of initial rotation upon an impulsive spin-down to rest, a nearly homogeneous turbulence develops with the energy-containing eddies of the size of the container. In a cylindrical container, centrifugal and Taylor-Görtler instabilities usually break up at the perimeter, thus facilitating slowing down of the outer region of the initially rotating liquid. Simultaneously, because of the Ekman pumping of non-rotating liquid into the central axis via the top and bottom walls, the central core of the initial giant vortex slows down too (Donnelly 1991). In a cubic container, the turbulence becomes homogeneous much faster. Some residual rotation of the central region in the original direction might still survive for a while but, as we show below, the generated turbulence is in general pretty homogeneous.
This behaviour is well-documented for classical liquids (van Heijst 1989), and one expects similar processes to occur in a superfluid liquid providing the process of initial multiplication of vortices does not affect the dynamics. As spin-down experiments always begin from already existing dense rectilinear vortex arrays of equilibrium density , and rapid randomization and multiplication of these vortices is expected due to the lack of axial symmetry of the container, as well as surface pinning (friction) in the boundary region, these seem to be sufficient for the superfluid to mimic the large classical turbulent eddies. In Fig. 33 we show the four different stages of the evolution from a vortex array to a decaying homogeneous tangle upon an impulsive spin-down to rest, which are in agreement with the observations outlined below.

Before making each measurement, the cryostat was kept at steady rotation at the required for at least 300 s before decelerating to full stop, then waiting a time interval and taking the data point. Then the probed tangle was discarded and a new one generated. Hence, different data points represent different realizations of the turbulence. The deceleration was linear in time taking 2.5 s for rad/s and 0.1 s for rad/s. The origin was chosen at the start of deceleration.
4.1.7 Current-generated tangles
An alternative technique of generating turbulence, by a jet of injected ions that does not require any moving parts in the cryostat, has been developed (Walmsley and Golov 2008a) (Fig. 34). In early experiments with injected ions at low temperatures (Bruschi et al. 1966, Bowley et al. 1982), it was observed that a pulse of negative ions through superfluid 4He leaves behind a tangle of vortices. Walmsley et al. (2007a) found that the properties of these tangles can be quite different. As we explain below, the tangles generated after long injection at high temperatures possess the properties of developed quasiclassical turbulence while those produced after short injection at low temperatures have signatures of random tangles with little large-scale flow.
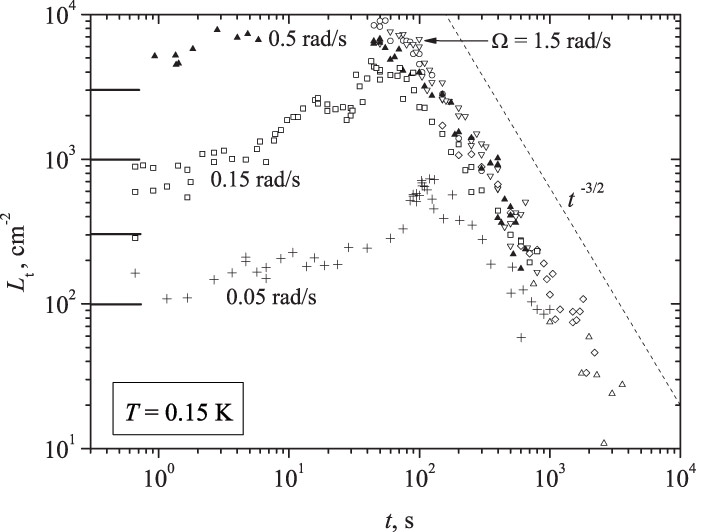
At high temperatures K, while moving relative to the normal component, the ions experience viscous drag through scattering of excitations – this means that the ions entrain the normal component along. They can also get trapped by an existing vortex line (provided K), after which the vortex line will be pulled along with the current of such ions. The existing vortices and hence the superfluid component, through the action of mutual friction, will be pulled by the already entrained normal component too, and vice versa. Then one can expect the injected current to produce a large-scale jet-like flow of liquid helium which is an efficient way of driving quasiclassical turbulence at large scales. This is similar to jet flow through an orifice – one of the traditional means of generating turbulence in classical liquids (Chanal et al. 2000). On the other hand at low temperatures the ions always bring small vortex rings along, hence, upon formating a tangle, can directly pump up the vortex length without introducing substantial large-scale flow – at least for not too-long injections.
4.2 Experimental results
4.2.1 Quasiclassical turbulence generated by spin-down to rest
Above 1 K, the free decay was monitored by second sound for towed grid turbulence in Oregon (Stalp et al. 1999). The recent spin-down experiments at Manchester are in good agreement with them in the overlapping temperature regime. Below 1 K, only scattering of ions off vortex lines has been used to measure so far.
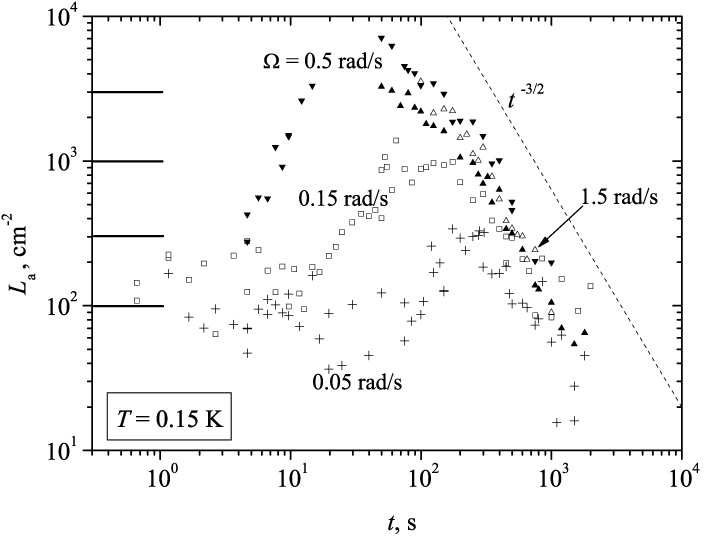
In Fig. 35, the measured densities of vortex lines along the horizontal axis (transverse, ) are shown for four different initial angular velocities . During the transient, which lasts some , goes through the maximum after which it decays eventually reaching the universal late-time form of . For rad/s, the values of at maximum were too high to be detected. The initial vortex densities at steady rotation, , are shown by horizontal lines. Similarly, the densities of vortex lines measured along the vertical axis (axial, ) are shown in Fig. 36.
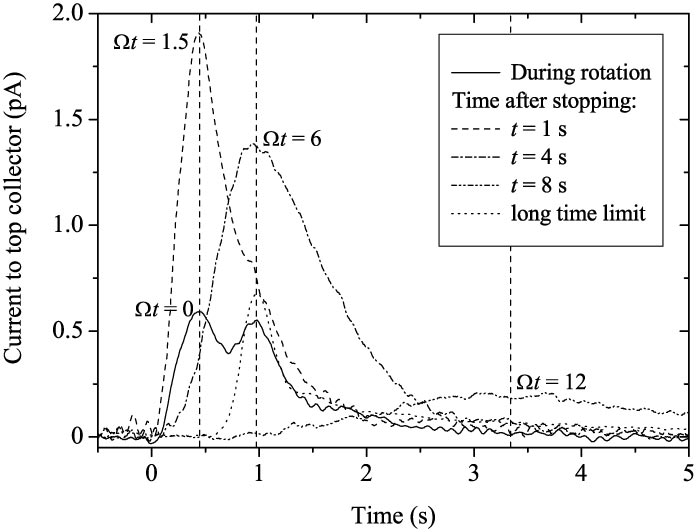
To illustrate what is happening near the vertical axis of the container at different stages of the transient after a spin-down, in Fig. 37 we show five records of the current to the top collector arriving after a short (0.1 s) pulse of probed ions was fired from the bottom injector. Each is characteristic of a particular configuration of vortex lines near the rotational vertical axis of the container during the transformation from an array of parallel lines to a homogeneous decaying vortex tangle. One can see three different characteristic times (vertical dashed lines in Fig. 37) of arrival of ions via different means. The first peak at s (determined by the time constant of the current preamplifier, 0.15 s) corresponds to the ions trapped on the rectilinear vortex lines which can slide along those lines very quickly, provided those lines are continuous from the injector to collector as during steady rotation. The second peak at s corresponds to the coherent arrival of the ballistic charged vortex rings from the bottom to the top. The third broad peak at times s (but with a long tail detectable until s) corresponds to the charge trapped on the vortex tangle and drifting with the tangle. Hence, we have the following regimes (and curves in Fig. 37) labeled by the time after the spin-down:
-
1.
, steady rotation. The nearly equal first and second peaks tell that there exist a vortex array without disorder (otherwise the second peak would get suppressed and the third would appear).
-
2.
. The first peak gets enhanced three-fold while the second one is still there (and no third peak) – meaning more trapped ions can now reach the collector along the rectilinear vortex lines while there is not much turbulence in this region yet.
-
3.
. The first peak has disappeared in favour of the second one which has got broadened – at this stage the rectilinear vortices should have become scrambled in the Ekman layers near the top and bottom walls/grids while the ballistic charged vortex rings are still the dominant transport of charge.
-
4.
. Now both fast peaks have disappeared completely while the third broad peak has emerged – this means that a turbulent tangle has finally reached the axial region.
-
5.
. The sharp second peak has recovered but all others vanished – after the turbulence has decayed only ballistic charged vortex rings carry the charge, neither the rectilinear array nor the turbulent tangle contribute to the transport any more.
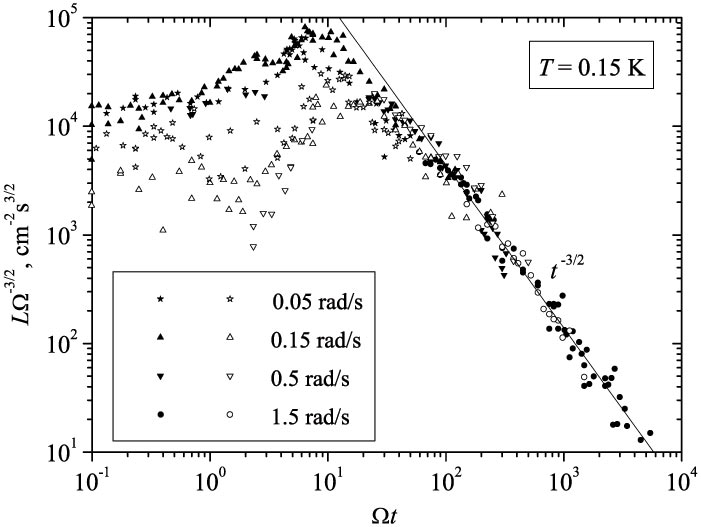
In Fig. 38 the measured densities of vortex lines along the horizontal, , and vertical, , axes are shown, by solid and open symbols respectively. To stress the scaling of the characteristic times with the initial turn-over time and the universal late-time decay , the data for different are rescaled accordingly. We can see that at all the transients are basically universal. Immediately after deceleration, jumps to cm-2s3/2, indicating the appearance of the turbulent boundary layer at the perimeter, while is stable at . Only at , the latter starts to grow, signalling the destruction of the rotating core with vertical rectilinear vortices. After passing through a maximum at and respectively, and merge at and then become indistinguishable. This implies that from now on the tangle density is distributed nearly homogeneously. The scaling of the transient times with the turn-over time indicates that transient flows are similar at different initial velocities , which is expected for flow instabilities in classical inviscid liquids. Eventually, after , the decay takes its late-time form expected for quasiclassical isotropic turbulence, whose energy is mainly concentrated in the largest eddies bound by the container size , but homogeneous on smaller length scales. We hence assume that the turbulence in 4He at this stage is nearly homogeneous and isotropic, and can apply Eq. (40) to extract the effective kinematic viscosity . The cross-over to the regime at late time has never been observed, probably because the measured values of never dropped below 10 cm cm-2.
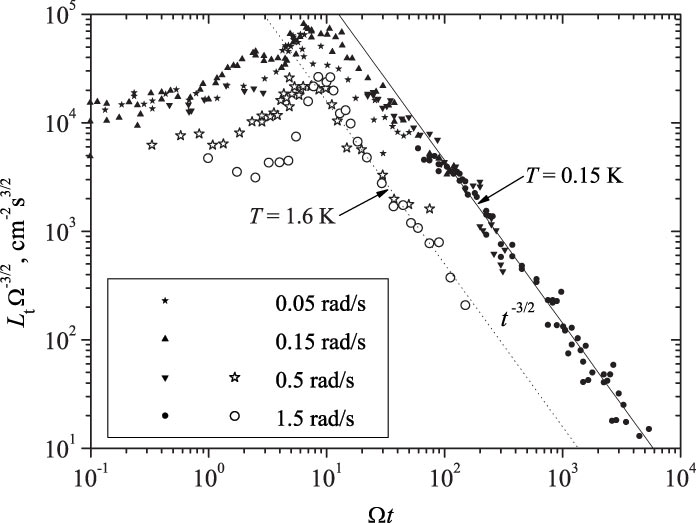
At K the measured were independent of temperature. In Fig. 39, we compare the transients at low () and high () temperatures. The prefactor in the late-time dependence at K is almost an order of magnitude larger that that for K. This implies that at low temperatures, the steady-state inertial cascade with a saturated energy-containing length and constant energy flux down the range of length scales requires a much greater total vortex line density. This means that in the limit the effective kinematic viscosity is approximately 70 times smaller than at K (provided and are independent of temperature).
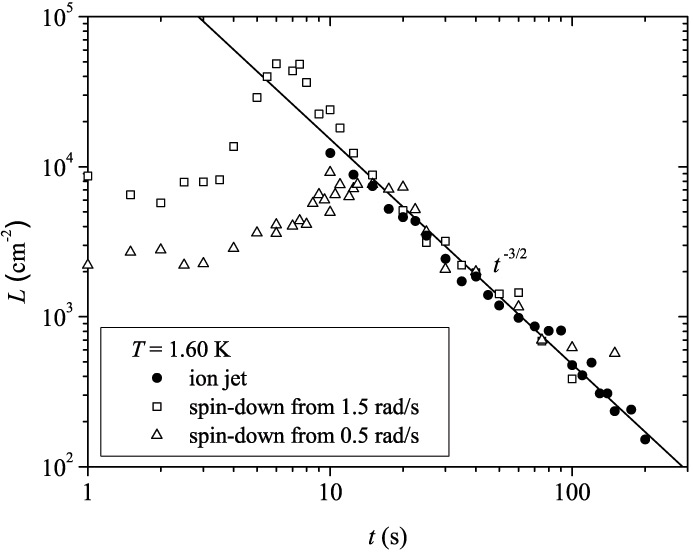
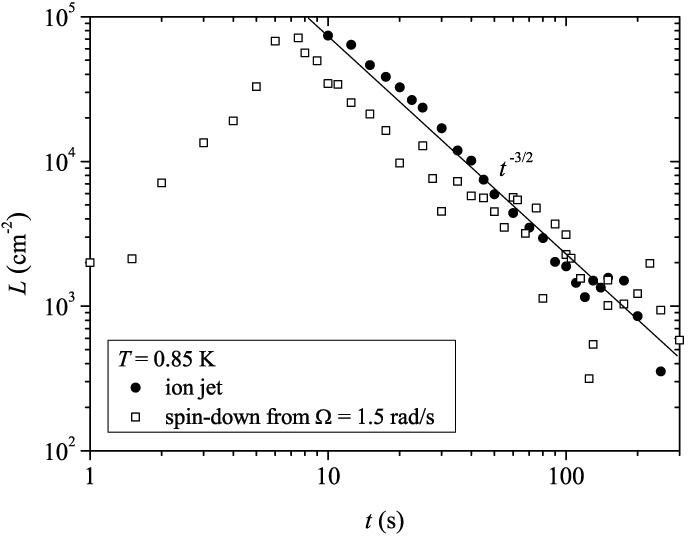
At all temperatures the transients after a spin-down are, in first approximation, universal, i.e. the timing of the maximum is the same and the amplitudes of the maximum are comparable. This supports our approach to turbulent superfluid helium at large length scales as to an inviscid classical liquid, agitated at large scale and carrying an inertial cascade down the lengthscales, independent of temperature. On the other hand, as the temperature increases and interactions with the viscous normal component become stronger, changes in the shape of transients might be expected. Indeed, one can see that the slope of after the maximum but before reaching the ultimate late-time decay (i.e. for ) is changing gradually with increasing temperature from being less steep than at K to more steep than at K (Fig. 39). At temperatures around K, it nearly matches , thus making an erroneous determination of possible by taking this part of the transient for the late-time decay . Indeed, in the first publication (Walmsley et al. 2007a), parts of some transient at K for as early as were occasionally used to be fitted by that often resulted in overestimation of the value for . To rectify this, we have re-fitted the datasets used in the original publication as well as subsequent measurements with for spin-downs using the following rules: for K only points for were used, between 0.5 K and 1.0 K only points for used and at K only were used. This resulted in slight systematic reduction of the extracted values of at temperatures 0.8–1.2 K from those published in Walmsley et al. (2007a); what looked as a rather steep drop in at 0.7–0.8 K, now occurs at 0.85 – 0.90 K and is somewhat reduced in magnitude.
4.2.2 Quasiclassical turbulence generated by an ion jet
As mentioned above, ion jets can produce quasiclassical tangles decaying as (Walmsley and Golov 2008a). Examples of the decay of such tangles alongside with those obtained by a spin-down at K and K are shown in Figs. 40 and 41, demonstrating good quantitative agreement between the late-time decays. At temperatures 0.7 – 1.6 K the late-time decays of quasiclassical turbulences generated by these two different techniques were identical within the experimental errors.
4.2.3 Ultraquantum turbulence generated by a jet of charged vortex rings
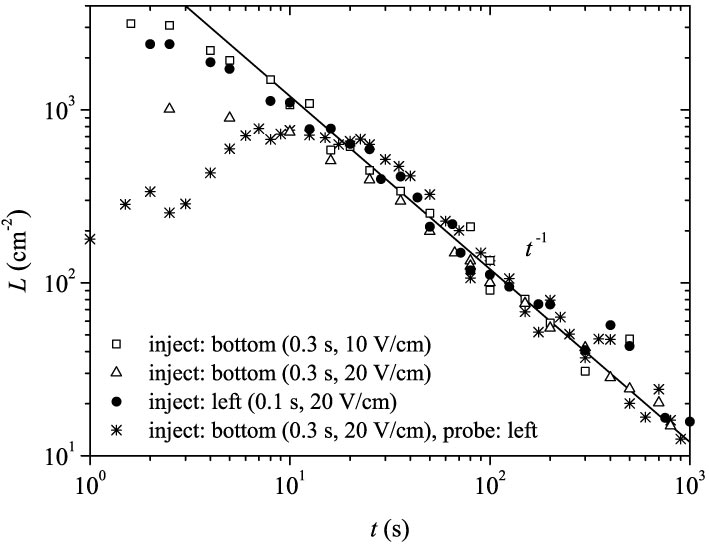
In the temperature range K, all tangles produced by a pulse of injected current of duration 0.1–1 s, intensity – A and in the driving field V/cm revealed the late-time decay , all with the same prefactor (Fig. 42) (Walmsley and Golov 2008a). This universality of the prefactor for all initial vortex densities is a strong argument in favour of the random character of the tangles whose decay is described by Eq. (39) (ultraquantum turbulence). During the injection, the tangle originates near the injector, presumably as the result of colliding many charged vortex rings all of the same radius m, and then spreads into the centre of the cell in 3–5 s, eventually filling all container and becoming nearly homogeneous after s. This can be seen at the transient in Fig. 42 () where the tangle was initiated at the bottom injector but then sampled along the horizontal axis of the container. The dynamics of the tangle spreading was found to be independent of the driving field 0–20 V/cm.
The tangles produced by the bottom and left injectors had very nearly identical late-time decays (Fig. 42). The corresponding values of , inferred using Eq. (39), are and . As the scattering diameters of charged vortex rings produced only by the left injectors could be calibrated directly in situ on the arrays of rectilinear vortex lines at steady rotation, the absolute value of for these tangles probed along the horizontal axis is treated as more reliable.
4.3 Discussion: dissipation in different types of turbulence
4.3.1 Dissipation in 4He at different temperatures
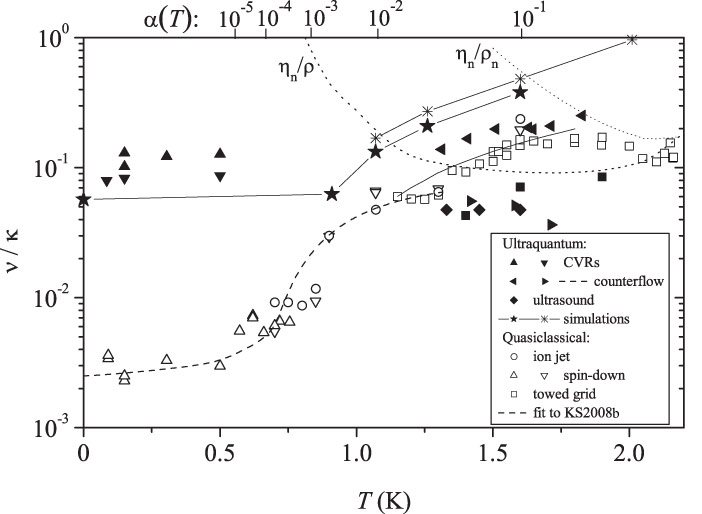
Let us now summarize what is known about the dissipation of various types of turbulence in superfluid 4He at different temperatures. As the relevant parameter, we plot in Fig. 43 the effective kinematic viscosity (as defined in Eq. (38)) which is a function of the mutual friction parameter but can be different for different types of flow. One can see that at high temperatures, K, all experimental points group around , give or take a factor of two. The fact that different types of experiments seem to produce slightly different absolute values and temperature dependences might have various reasons. Firstly, experimental techniques rely on the means of calibrating the sensitivity to the absolute value of and on the knowledge of other parameters in the model. The calibration is normally performed on an array of rectilinear vortex lines in the direction perpendicular to the lines but not on tangles of vortex lines. For example, recent refined calculations (Chagovets et al. 2007) suggested to correct all previous second sound measurements of on isotropic tangles by a factor of , which we apply here. Secondly, the exact values and dependence on temperature of the effective parameters relating to (such as in Eq. (39), and and in Eq. (40)) are not known, thus complicating precise comparison of for different temperatures and types of flow. Thirdly, at K the normal component can also become turbulent (Schwarz and Rozen 1991, Barenghi et al. 2002, Vinen 2000, L’vov et al. 2006b), hence its velocity field might vary for different means of generating turbulence.
Theoretically, one can consider two limiting cases: either completely locked () turbulent flow of both components or an absolutely laminar normal component ( in a local reference frame) that slows down the segments of quantized vortices moving past it. The former is favourable at high mutual friction and low viscosity of the normal component (i.e. at the high-temperature end) and is expected to be described by the kinematic viscosity (dotted line in Fig. 43), where , while the latter is favourable at low and high (i.e. at the low-temperature end) and is expected to follow the predictions of mutual-friction-controlled models which assume a laminar normal component (e.g. line-connected stars and asterisks for random tangles in Fig. 43). The experimental situation is obviously somewhere in between (and the measured should probably tend to the smaller value of those predicted by the two limits), although the particular means of driving might tip the balance towards either of the limits. This might be one reason why different techniques show systematic disagreement in the temperature range above 1 K.
One can speculate that quasiclassical turbulent flow generated by mechanical stirring is less prone to such uncertainties, since both the superfluid and normal large-scale flows are generated simultaneously and are probably locked. On the other hand, the generation of quasi-random tangles was attempted by a variety of techniques: those continuously pumped by counterflow in narrow channels might have the normal component more laminar, while those with freely decaying turbulence in wide channels were shown to evolve towards coupled superfluid and normal turbulence at high temperatures (Barenghi and Skrbek 2007), especially so if created with ultrasound which equally pumps turbulence in both components. In any case, on approaching K from above, when the normal component progressively becomes more viscous and less dense, all experimental and numerical values of for quasi-random tangles seem to converge, which supports these reasonings.
At temperatures below 1 K, the values of appear to split rapidly: those for ultraquantum turbulence apparently stay at nearly the same level, , as at high temperatures, while those for quasiclassical turbulence keep decreasing until the zero-temperature limit of . The mean free path of excitations in 4He rapidly increases with decreasing temperature and becomes comparable with m at K and with the container size cm at K. At these temperatures, the normal component is too viscous to follow the turbulent superfluid component and hence the convenient model of a laminar normal component becomes adequate here (in this respect this regime of 4He is similar to that in superfluid 3He-B below discussed in previous sections). It is indeed comforting that numerical simulations of tangles initiated at short scales (without large-scale turbulence (Tsubota et al. 2000)) are in good agreement with experiments for random tangles at these temperatures (Walmsley and Golov 2008a). As yet, there are no satisfactory computer simulations of homogeneous quasiclassical turbulence in the limit of zero temperature.
Between 1.1 – 1.6 K, the values of for quasiclassical turbulence generated with towed grids of different designs (Stalp et al. 1999, Niemela et al. 2005), impulsive spin-down to rest, and an ion jet are reasonably consistent between each other and show an increase from to . There was an early attempt (Stalp et al. 1999) to relate these values with the kinematic viscosity cm2/s , assuming locked turbulence of the superfluid and normal components. However, it was soon realized (Stalp et al. 2002) that the contribution of quantized vortex lines to dissipation controlled by mutual friction and reconnections is also important. This certainly dominates below 1.2 K, where begins to increase with cooling (hence, making the normal component effectively decoupled from vortices on short length scales) while the measured decreases with cooling.
In the mutual-friction-dominated regime and provided the normal component is only locked to the superfluid velocity at scales , the actual dissipation is through the self-induced motion of vortex lines relative to the normal component – whatever the kinetics of the quantum cascade. In this regime, a segment of a vortex line bent at radius and hence moving at self-induced velocity -1 dissipates energy at the rate -2 per unit length, where is introduced in Eq. (39). This approach leads to the formula (Vinen 2000, Vinen and Niemela 2002)
| (45) |
The multiplier is meant to account for the degree of correlation between the motion of individual segments of vortex lines and the surrounding superfluid in a structured quasiclassical tangle (), compared to a random tangle of the same density (). In the simulations of counterflow-maintained tangles in the local induction approximation by Schwarz (1988), the measure of the relative abundance of small scale kinks on vortex lines, , was found to increase from 2 to 12 as decreased from 0.3 to with decreasing temperature from 2 to 1 K. This formula nicely agrees with the simulations by Tsubota et al. (2000). It also captures the trend and magnitude of for all experimental quasiclassical tangles as well as for the random tangle maintained by counterflow (Vinen 1957a) (where the normal component is expected to be nearly laminar); although to fit it to the data of quasiclassical tangles in Fig. 43 (solid line) we used , apparently owing to partial locking between the flows in the normal and superfluid components.
As vortex segments with smaller radii of curvature lose their energy faster, for a given energy flux down the length scales there is exists a dissipative scale below which the cascade essentially cuts off (Svistunov 1995, Vinen 2000, L’vov et al. 2006b, Kozik and Svistunov 2008b). For a developed non-linear Kelvin-wave cascade (), with the amplitude spectrum (Kozik and Svistunov 2004), this implies that . In this sense the Schwarz’s parameter quantifies the range of wavelengths involved in the quantum cascade and becomes another quantum analog of the classical Reynolds number: . With decreasing , the value of progressively decreases until, at K (Vinen 2001, L’vov et al. 2006b, Kozik and Svistunov 2008b), it reaches the wavelength nm at which phonons can be effectively emitted. Below this temperature, as the dissipation of Kelvin waves due to mutual friction becomes negligible compared to the emission of phonons, is independent of temperature. However, in the presence of the quantum cascade at larger wavelengths, it is the cascade’s kinetics that controls the energy flux, and it might happen that the vortex length already saturates at higher values of , thus signalling the onset of the regime with const as , Eq. (38).
Let us now discuss the specific models for the low-temperature behaviour of . For the dissipative mechanisms that involve individual quantized vortices, such as those maintained by vortex reconnections, simple considerations (Vinen and Niemela 2002) usually predict to be of order . However, more involved models, such as that of a “bottleneck” for quasiclassical turbulence, might suggest smaller values (L’vov et al. 2007a). If certain configurations of vortices are inefficient in transferring energy down to short wavelengths (e.g. either there exists a non-cascading part of the spectrum or reconnections are less efficient in polarized tangles), the resulting accumulation of an extra contribution to leads to a reduction of the parameter . This is what is observed for quasiclassical tangles in 4He on approaching the limit.
An important question remains: how is the energy of classical eddies passed over to the shorter quantum length scales? Two main mechanisms are currently discussed: (i) the excitation of Kelvin waves through purely non-linear interactions in classical eddies or (ii) vortex reconnections (each leaving a sharp kink on both vortex lines, hence effectively redistributing the energy to smaller length scales). Both predict an increase in at constant energy flux down the cascade (i.e. the decrease of ) with decreasing temperature. The former considers the accumulation of extra “non-cascading” quasiclassical vorticity at length scales above due to the difficulty in transferring energy through wavenumbers around if reconnections do not ease the process (referred to as the “bottleneck” model in Sec. 3) (L’vov et al. 2007a). The latter mainly associates the excess vortex length with the contributions from the new self-similar structures produced by vortex reconnections on length scales shorter than , when vortex motion becomes progressively less damped at low temperatures (Kozik and Svistunov 2008b). This model relies on four types of processes: reconnections of vortex bundles, reconnections of neighbouring vortices, self-reconnections of a vortex, and non-linear interactions of Kelvin waves, which bridge the energy cascade from the Kolmogorov to the Kelvin-wave regimes. It can be successfully fitted to the experimental , as seen in Fig. 43. In short, both models predict an enhancement of vortex densities but on different sides of the cross-over scale .
Finally we may ask why is larger for ultraquantum (random) tangles than for quasiclassical tangles in the limit? Whatever the model, this means that, for the same total density of vortex lines , the rate of energy dissipation in random tangles is larger. Within the bottleneck model (L’vov et al. 2007a), this seems straightforward as these tangles have no energy on classical scales at all. Within the reconnections/fractalization scenario (Kozik and Svistunov 2008b), this is explained by the fact that reconnections in partially polarized tangles are less frequent and less efficient. In the framework of this latter model, to explain why there is apparently no temperature dependence of for ultraquantum tangles below K (although no experimental data exist for the range 0.5 – 1.3 K), one should assume that for this type of tangle all significant increase in the total line length caused by the fractalization with decreasing temperature has already occurred above 1 K.
4.3.2 Comparing turbulent dynamics in 3He-B and 4He
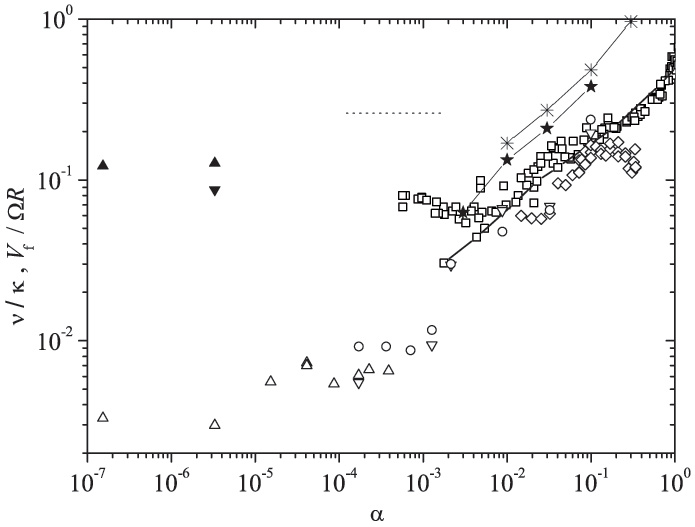
It would be instructive to provide a comparison of turbulent dissipation in superfluid 4He and 3He-B. Unfortunately at present, with only few measurements on varying types of flow, this remains a task for the future. The Lancaster measurements on the decay of an inhomogeneous tangle generated with a vibrating grid by Bradley et al. (2006) revealed a late-time decay (Fisher and Pickett 2008). Assuming that the origin of the dependence is the same as in quasiclassical turbulence with a saturated energy-containing length, and that this length is equal to the spread of the turbulent tangle over a distance of mm, using Eq. (40) they extract the temperature-independent value of at . This is different from the 4He value . However, it is questionable whether for this turbulence the condition for the applicability of Eq. (40) is met, namely that the classical energy dominates over the quantum energy . From their recent measurements (Bradley et al. 2008) of the initial velocity of mean large-scale flow, mm/s, and vortex density, cm-2, we estimate cm2/s while cm2/s; i.e. even in the early stages of the decay. Hence, it is possible that the dynamics of the decay of their localized tangles is that of an ultraquantum turbulence but accelerated due to diffusion or emission of vortex rings into space; thus the decay is steeper than . More experiments with grid turbulence in 3He-B are thus desirable, which could shed light on the temperature dependence of turbulent dynamics, e.g. if there is a similar decrease in below as measured for 4He, or to provide an independent characterization of the energy-containing length scale. It would also be important to reproduce the results for 4He in the limit with another method of generating turbulence (e.g. by means of towed or vibrating grids).
The Helsinki experiments on the propagating vortex front (Sec. 3) provide a measure of dissipation via the front velocity . The observed relative enhancement of the rate of decay below () proves the efficiency of the turbulent cascade in dissipating the energy of large-scale flow. The leveling off of this rate below () is qualitatively similar to that observed in 4He at K (), and might hint at the limit in the inertial cascade. However, the respective values of , at which the leveling-off occurs, differ substantially. Various reasons can be given to explain this difference, eg. that different types of flow have their own specific dependence (evidence for this is the difference in the values of quasiclassical and random tangles). For instance, to test the interpretation of the temperature dependence of on approaching the limit, given in Sec. 3.5.6 in terms of the proximity of the outer and quantum crossover scales, it would be instructive to conduct similar measurements in containers of different radii.
In front propagation the energy dissipation rate is proportional to , while in experiments described in this section the rate is proportional to . Thus it is interesting to compare the temperature dependences of and in the two superfluids. We plot in Fig. 44 the effective kinematic viscosity and the normalized velocity of the propagating front as a function of mutual friction dissipation . Note that the role of turbulence comes into play in a very different manner in these two types of flow: as nearly homogeneous and isotropic turbulence in 4He in the Manchester experiments and, roughly speaking, via the deviation from laminar vortex front propagation, owing to turbulent excitations, in 3He-B in the Helsinki experiments.
It is striking that for (i.e. the regime where developed turbulence becomes possible) and before leveling off at , the data for all experiments and numerical simulations discussed here approach a similar slope of . For , in the spirit of Eq. (45), this implies that the parameter is roughly proportional to – even well below the values of of the calculations by Schwarz (1988). On a finer scale, particular models of matching the classical and quantum cascades, as discussed in the previous subsection, might produce specific dependences of , which perhaps can be tested in future experiments in more detail, provided that the quality of data is improved.
We do not attempt to compare the absolute values of and in Fig. 44. Instead, we concentrate on the dependences, especially on the values of at which the dissipation rates level off as . The fact that the measured 3He-B data level off at higher values of might suggest that the quantum cascade in 3He-B is not as developed as in 4He and that the ultimate dissipative mechanism, independent of in the limit, is stronger and takes over at larger length scales in 3He-B. Indeed, the numerically calculated velocity of front propagation , which does not explicitly incorporate any excess dissipation beyond mutual friction dissipation and hence is equally suitable for 3He-B and 4He, is steadily decreasing with decreasing , following the same trend as the experimental and numerical for 4He. In contrast, the measured levels off below , which seems to imply that the regime prevails at in 3He-B, while this happens only below in 4He. The fermionic nature, the large vortex core diameter, and the much lower absolute temperatures lead to different inherent dissipation mechanisms in 3He-B. For example, the energy loss during each reconnection event can be substantial in 3He-B but not in 4He. This is supported by the fact that the values of measured in Lancaster for 3He-B with nm (at bar) level off (i.e. branch away from the common trend of marked by the numerically calculated dependences) at larger values of , than the measured front velocity for nm (at bar) at . We conclude by noting that further work on turbulence in different types of flow in both 4He and 3He-B is highly desired.
4.4 Summary: decay of quasiclassical and ultraquantum turbulence
The newly developed technique of measuring the density of a vortex tangle by the scattering of charged vortex rings of convenient radius m has made it possible to monitor the evolution of tangles in superfluid 4He down to below 0.5 K, i.e. deep into the zero-temperature limit. The dynamics of two very different types of tangles can be studied. Quasiclassical tangles, mimicking the flow of classical liquids on large length scales were generated by an impulsive spin-down from angular velocity to rest of a rotating cubical container with helium. After a transient of duration the turbulence becomes nearly isotropic and homogeneous and decays as , as expected for turbulence posessing a Kolmogorov cascade of energy from the energy-containing eddies of constant size, set by the container size . This was studied in isotopically pure 4He in a broad range of temperatures of 80 mK – 1.6 K, corresponding to the range of mutual friction from to . Identical results were obtained for the free decay of quasiclassical tangles generated by a central jet of ions, although only at temperatures above 0.7 K so far.
Alternatively, non-structured (ultraquantum) tangles of quantized vortices, that have little flow at scales above the inter-vortex distance and hence no classical analog, can be obtained by colliding many small quantized vortex rings of radius at temperatures below 0.5 K, i.e. in the zero-temperature limit. These tangles took about 10 s to spread from an injector into all experimental volume of size cm, followed by free decay with the universal dynamics , independent of the initial conditions. The relatively fast rate of spreading is indeed surprising and might be due to the small polarization (mean velocity) of the tangle.
Quantitative measurements of the free decay for both types of tangles allow the extraction of the “effective kinematic viscosities” – the flow-specific parameter linking the rate of energy dissipation with the total density of vortices . It turned out that at high temperatures K, where the quantum cascade is not well-developed, the values of for both types of turbulence are comparable. However, in the zero-temperature limit, where the dissipation can only take place at very short length scales , to which the energy can only be delivered by a cascade of non-linear Kelvin waves on individual vortex lines, the saturated value of for quasiclassical turbulence seems to be smaller than that for ultraquantum turbulence. On the microscopic level this is most probably related to the fact that in the presence of quasiclassical eddies the partial mutual alignment of vortex lines in “bundles” slows down the process of exciting Kelvin waves for a given vortex density . For instance, this mutual alignment is expected to reduce the frequency and efficiency of vortex reconnections, which are believed to be the defining process of the dynamics of non-structured (ultraquantum) tangles as they fuel the Kelvin-wave cascade. At present, two microscopic models are developed to describe the energy transfer from classical to quantum scales (cascades) in quasiclassical tangles: one relying on reconnections and the other assuming that additional “non-cascading ” vortex density helps maintain the continuity of the energy flux down to the dissipative length scale.
We have also compared the rates of dissipation as a function of mutual friction in superfluid 4He and 3He-B. Both similarities and differences in the behaviour are spotted and discussed. However, a final quantitative verdict on the role of specific mechanisms cannot be delivered at this stage, pending further development of theoretical models and of experiments on different types of turbulent flow in both superfluids.
5 Summary
In the last five years we have witnessed important advances in the understanding of the appearance, growth, and decay of different types of superfluid turbulence, especially in the fundamentally important limit of zero temperature where the intrinsic processes within the superfluid component set the dynamics of the tangle of quantized vortices. As these are absolutely undamped on a broad range of length scales down to wavelengths of order 10 nm – m, depending on the type of superfluid, a principally new microscopic dynamics emerges – set by the instabilities of individual vortices, their reconnections and one-dimensional cascades of energy from non-linear Kelvin waves (wave turbulence) along individual vortex lines. Amazingly, even in this limit, various turbulent flows behave classically on large length scales, and often the observed rate of decay is no different from that at high temperatures – owing to the fact that the energy-containing and dissipative lengths and times are well-separated.
However, also the discrete nature of quantized superfluid vorticity becomes important in such processes as the growth of an initial seed vortex tangle out of a single-vortex instability, the efficiency of dissipating the energy of large-scale eddies through short-wavelength Kelvin waves on individual vortex lines, or the dynamics of non-structured tangles possessing no large-scale flow. In the helium superfluids these underlying processes are separately observable and are ultimately expected to become the corner stones of a detailed theoretical framework. This should make it possible to develop a consistent picture of turbulence in helium superfluids, which describes the nonlinear turbulent dynamics of discrete line vortices in a macroscopically coherent quantum liquid of zero viscosity.
Acknowledgments: This work is supported by the Academy of Finland (grants 213496, 124616, and 114887), by ULTI research visits (EU Transnational Access Programme FP6, contract RITA-CT-2003-505313), and by EPSRC (UK) (grants GR/R94855 and EP/E001009).
References
- (1)
- Adams et al. (1985) Adams, P.W., M. Cieplak, and W.I. Glaberson, 1985, Phys. Rev. B 32, 171.
- Andronikashvili and Mamaladze (1967) Andronikashvili, E.L. and Yu.G. Mamaladze, 1967, Rotation of He II, Prog. Low Temp. Phys. Vol. V, p. 79, ed. C.J. Gorter (North-Holland Publ., Amsterdam).
- Araki et al. (2002) Araki, T., M. Tsubota, and S.K. Nemirovskii, 2002, Phys. Rev. Letts. 89, 145301.
- Barenghi et al. (2002) Barenghi, C.F., S. Hulton, and D.C. Samuels, 2002, Phys. Rev. Lett. 89, 275301.
- Barenghi and Skrbek (2007) Barenghi, C.F., and L. Skrbek, 2007, J. Low Temp. Phys. 146, 5.
- Batchelor (1953) Batchelor, G. K., 1953, The Theory of Homogeneous Turbulence (Cambridge University Press, Cambridge, UK).
- Berloff and Roberts (2000a) Berloff, N.G., and P.H. Roberts, 2000, J. Phys. A: Math. Gen. 33, 4025.
- Berloff and Roberts (2000b) Berloff, N.G., and P.H. Roberts, 2000, Phys. Lett. A 274, 69.
- Bevan et al. (1997) Bevan, T.D.C., A.J. Manninen, J.B. Cook, A.J. Armstrong, J.R. Hook, and H.E. Hall, 1997, J. Low Temp. Phys. 109, 423; 1995, Phys. Rev. Lett. 74, 750.
- Bewley et al. (2006) Bewley, G.P., D.P. Lathrop, and K.R. Sreenivasan, 2006, Nature 441, 588.
- Bewley et al. (2008) Bewley, G.P., M.S. Paoletti, K.R. Sreenivasan, and D.P. Lathrop, arXiv:0801.2872v1 [cond-mat.other].
- Blaauwgeers et al. (2002) Blaauwgeers, R., V.B. Eltsov, G. Eska, A.P. Finne, R.P. Haley, M. Krusius, J.J. Ruohio, L. Skrbek, and G.E. Volovik, 2002, Phys. Rev. Lett. 89, 155301.
- Blinnikov et al. (2006) Blinnikov, S.I. et al., 2006, Astron. and Astrophys. 453, 229.
- Borghesani (2007) Borghesani, A.F., Ions and Electrons in Liquid Helium (Oxford Science Publications, Oxford, UK).
- Bowley et al. (1982) Bowley, R.M., P.V.E. McClintock, F.E. Moss, G.G. Nancolas, P.C.E. Stamp, 1982, Phil. Trans. R. Soc Lond. A 307, 201.
- Bradley (2000) Bradley, D.I., 2000, Phys. Rev. Lett. 84, 1252.
- Bradley et al. (2006) Bradley, D.I., D.O. Clubb, S.N. Fisher, A.M. Guénault, R.P. Haley, C.J. Matthews, G.R. Pickett, V. Tsepelin, and K. Zaki, 2006, Phys. Rev. Lett 96, 35301.
- Bradley et al. (2008) Bradley, D.I., S.N. Fisher, A.M. Guénault, R.P. Haley, S. O’Sullivan, G.R. Pickett, and V. Tsepelin, 2008, Phys. Rev. Lett. 101, 065302.
- Bruschi et al. (1966) Bruschi, L., B. Maraviglia, P. Mazzoldi, 1966, Phys. Rev. 84, 143.
- Careri et al. (1960) Careri, G., F. Scaramuzzi, and J.O. Thomson, 1960, Nuovo Cimento 18, 957.
- Careri et al. (1962) Careri, G., W.D. McCormic, and F. Scaramuzzi, 1962, Phys. Lett. 1, 61.
- Chagovets et al. (2007) Chagovetz, T.V., A.V. Gordeev, and L. Skrbek, 2007, Phys. Rev. E 76, 027301.
- Chanal et al. (2000) Chanal, O., B. Chabaud, B. Castaing, and B. Hebral, 2000, Eur. Phys. J. B 17, 309.
- Cheng et al. (1973) Cheng, D.K., M.W. Cromar, and R.J. Donnelly, 1973, Phys. Rev. Lett. 33, 1197.
- Connaughton and Nazarenko (2004) Connaughton, C. and S.V. Nazarenko, 2004, Phys. Rev. Lett. 92, 044501.
- Davis et al. (2000) Davis, S.I., P.C. Hendry, and P.V.E. McClintock, 2000, Physica B 280, 43.
- Donnelly (1991) Donnelly, R.J., Quantized Vortices in Helium II (Cambridge University Press, Cambridge, UK).
- Donnelly and Barenghi (1998) Donnelly, R.J. and C.F. Barenghi, 1998, J. Phys. Chem. Ref. Data 27, 1217; http://www.uoregon.edu/rjd/vapor1.htm
- Eltsov et al. (2002) Eltsov, V.B., R. Blaauwgeers, N.B. Kopnin, M. Krusius, J.J. Ruohio, R. Schanen, and E.V. Thuneberg, 2002, Phys. Rev. Lett. 88, 065301.
- Eltsov et al. (2005) Eltsov, V.B., M. Krusius, and G.E. Volovik, 2005, Prog. Low Temp. Phys. Vol. XV, ed. W.P. Halperin (Elsevier B.V., Amsterdam), p. 1.
- Eltsov et al. (2006a) Eltsov, V.B., M. Krusius, and G.E. Volovik, 2006a, J. Low Temp. Phys., 2006, 145, 89.
- Eltsov et al. (2006b) Eltsov, V.B., A.P. Finne, R. Hänninen, J. Kopu, M. Krusius, M. Tsubota, and E.V. Thuneberg, 2006b, Phys. Rev. Lett. 96, 215302.
- Eltsov et al. (2007) Eltsov, V.B., A.I. Golov, R. de Graaf, R. Hänninen, M. Krusius, V. L’vov, and R.E. Solntsev, 2007, Phys. Rev. Lett. 99, 265301.
- Eltsov et al. (2008) Eltsov, V.B., R. de Graaf, R. Hänninen, M. Krusius, and R.E. Solntsev, 2008, J. Low Temp. Phys. 150, 373.
- Fetter (1976) Fetter, A.L., 1976, in The Physics of Liquid and Solid Helium (K.H. Bennemann and J.B. Ketterson, eds., Wiley, New York).
- Feynman (1955) Feynman, R. P., 1955, in Prog. Low Temp. Phys. Vol. I, ed. C.J. Gorter (North-Holland Publ., Amsterdam), p. 17.
- Finne et al. (2003) Finne, A.P., T. Araki, R. Blaauwgeers, V.B. Eltsov, N.B. Kopnin, M. Krusius, L. Skrbek, M. Tsubota, and G.E. Volovik, 2003, Nature 424, 1022.
- Finne et al. (2004a) Finne, A.P., S. Boldarev, V.B. Eltsov, and M. Krusius, 2004a, J. Low Temp. Phys. 135, 479.
- Finne et al. (2004b) Finne, A.P., S. Boldarev, V.B. Eltsov, and M. Krusius, 2004b, J. Low Temp. Phys. 136, 249.
- Finne et al. (2004c) Finne, A.P., V.B. Eltsov, R. Blaauwgeers, M. Krusius, Z. Janu, and L. Skrbek, 2004c, J. Low Temp. Phys. 134, 375.
- Finne et al. (2006a) Finne, A.P., V.B. Eltsov, G. Eska, R. Hänninen, J. Kopu, M. Krusius, E.V. Thuneberg, and M. Tsubota, 2006a, Phys. Rev. Lett. 96, 85301.
- Finne et al. (2006b) Finne, A.P., V.B. Eltsov, R. Hänninen, N.B. Kopnin, J. Kopu, M. Krusius, M. Tsubota, and G.E. Volovik, 2006b, Rep. Progr. Phys. 69, 3157.
- Fisher and Pickett (2008) Fisher, S.N. and G.R. Pickett, 2008, this volume.
- Frisch (1995) Frisch, U., 1995, Turbulence, (Cambridge University Press, Cambridge, UK).
- Glaberson et al. (1974) Glaberson, W.I., W.W. Johnson, and R.M. Ostermeier, 1974, Phys. Rev. Lett. 33, 1197; R.M. Ostermeier and W.I. Glaberson, 1975, J. Low Temp. Phys. 21, 191.
- Glaberson and Donnelly (1986) Glaberson, W.I., and R.J. Donnelly, 1986, in Prog. Low Temp. Phys. Vol IX, D.F. Brewer, ed. (North-Holland, Amsterdam).
- Golov and Ishimoto (1998) Golov, A., and H. Ishimoto, 1998, J. Low Temp. Phys. 113, 957.
- Goto et al. (2007) Goto, R., S. Fujiyama, H. Yano, Y. Nago, N. Hashimoto, K. Obara, O. Ishikawa, M. Tsubota, and T. Hata, 2008, Phys. Rev. Lett. 100, 045301.
- de Graaf et al. (2007) de Graaf, R., R. Hänninen, T.V. Chagovets, V.B. Eltsov, M. Krusius, and R.E. Solntsev, 2007, J. Low Temp. Phys., in print (2008); preprint arXiv:0708.3003v1 [cond-mat].
- Guenin and Hess (1978) Guenin, B.M. and G.B. Hess, 1978, J. Low Temp. Phys. 33, 243 (1978).
- Guo and Maris (2007) Guo, W. and H. Maris, 2007, J. Low Temp. Phys. 148, 199.
- Hall and Vinen (1956) Hall, H.E., and W.F. Vinen, 1956, Proc. Roy. Soc. (London, Ser. A), 238, 204; Vinen, W.F., 1957, ibid. 240, 114; 1957, 240, 128; 1957, 242, 489.
- Hänninen et al. (2003) Hänninen, R., R. Blaauwgeers, V.B. Eltsov, A.P. Finne, M. Krusius, E.V. Thuneberg, and G.E. Volovik, 2003, Phys. Rev. Lett. 90, 225301.
- Hänninen et al. (2005) Hänninen, R., A. Mitani, and M. Tsubota, 2005, J. Low Temp. Phys. 138, 589.
- Hänninen (2006) Hänninen, R., 2006, Movies on calculated vortex front propagation, can be viewed at the site http://ltl.tkk.fi/rhannine/front
- Hänninen et al. (2007a) Hänninen, R., V.B. Eltsov, A.P. Finne, R. de Graaf, J. Kopu, M. Krusius, and R.E. Solntsev, 2007a, submitted to Phys. Rev. B; preprint arXiv:cond-mat/0701647v2.
- Hänninen et al. (2007b) Hänninen, R., M. Tsubota, and W.F. Vinen, 2007b, Phys. Rev. B 75, 064502.
- Hashimoto et al. (2007) Hashimoto, N., R. Goto, H. Yano, K. Obara, O. Ishikawa, and T. Hata, 2007, Phys. Rev. B 76, 020504.
- van Heijst (1989) van Heijst, G.J.F., 1989, J. Fluid Mech. 206, 171.
- Hendry et al. (1988) Hendry P.C., N.S. Lawson, P.V.E. McClintock, and C.D.H. Williams, 1988, Phys. Rev. Lett., 60 604.
- Hendry et al. (1990) Hendry, P.C., N.S.Lawson, P.V.E. McClintock, C.D.H.Williams, and R.M. Bowley, 1990, Phil. Tran. 332, 387.
- Ihas et al. (2008) Ihas, G.G., G. Labbe, S.C. Liu, and K.J. Thompson, 2008, J. Low Temp. Phys. 150, 384.
- Kasamatsu et al. (2005) Kasamatsu, K., M. Machida, N. Sasa, and M. Tsubota, 2005, Phys. Rev. A 71, 063616.
- Kivotides et al. (2001) Kivotides, D., J.C. Vassilicos, D.C. Samuels, C.F. Barenghi, 2001, Phys. Rev. Lett. 86, 3080.
- Kobayashi and Tsubota (2005) Kobayashi, M. and M. Tsubota, 2005, Phys. Rev. Lett. 94, 065302.
- Kobayashi and Tsubota (2008) Kobayashi, M., and M. Tsubota, 2008, J. Low Temp. Phys. 150, 402; J. Low Temp. Phys. 150, 587.
- Kolmakov et al. (2006) Kolmakov, G.V., V.B. Efimov, A.N. Ganshin, P.V.E. McClintock, and L.P. Mezhov-Deglin, 2006, Phys. Rev. Lett. 97, 155301.
- Kolmogorov (1941a) Kolmogorov, A. N., 1941a, Dokl. Akad. Nauk SSSR 30, 301 (reprinted in 1991, Proc. Roy. Soc. A 434, 9).
- Kolmogorov (1941b) Kolmogorov, A.N., 1941b, Dokl. Akad. Nauk SSSR 31, 538 (reprinted in 1991, Proc. Roy. Soc. A 434, 15).
- Kopnin and Salomaa (1991) Kopnin, N.B, and M.M. Salomaa, 1991, Phys. Rev. B 44, 9667.
- Kopnin (2001) Kopnin, N.B., 2001, Theory of Nonequilibrium Superconductivity (Clarendon Press, Oxford, UK).
- Kopnin (2004) Kopnin N.B., 2004, Phys. Rev. Lett. 92, 135301.
- Kopu et al. (2000) Kopu, J., R. Schanen, R. Blaauwgeers, V.B. Eltsov, M. Krusius, J.J. Ruohio, and E.V. Thuneberg, 2000, J. Low Temp. Phys. 120, 213.
- Kopu (2006) Kopu, J., 2006, J. Low Temp. Phys. 146, 47.
- Kozik and Svistunov (2004) Kozik, E.V. and B.V. Svistunov, 2004, Phys. Rev. Lett. 92, 035301.
- Kozik and Svistunov (2005a) Kozik, E.V. and B.V. Svistunov, 2005a, Phys. Rev. Lett. 94, 025301.
- Kozik and Svistunov (2005b) Kozik, E.V. and B.V. Svistunov, 2005b, Phys. Rev. B 72, 172505.
- Kozik and Svistunov (2008a) Kozik, E.V. and B.V. Svistunov, 2008a, Phys. Rev. B 77, 060502.
- Kozik and Svistunov (2008b) Kozik, E.V. and B.V. Svistunov, 2008b, Phys. Rev. Lett. 100, 195302.
- Kovasznay (1947) Kovasznay, L. J., 1947, Aeronaut. Sci. 15, 745.
- Krusius et al. (1993) Krusius, M., Y. Kondo, J. Korhonen, and E.B. Sonin, 1993, Phys. Rev. B 47, 15113.
- Leith (1967) Leith, C., 1967, Phys. Fluids 10, 1409; 1968, Phys. Fluids 11, 1612.
- L’vov et al. (2004) L’vov, V.S., S.V. Nazarenko, and G.E. Volovik, 2004, JETP Lett. 80, 535.
- L’vov et al. (2006a) L’vov, V.S., I. Procaccia, and O. Rudenko, 2006a, JETP Lett. 84, 67.
- L’vov et al. (2006b) L’vov, V.S., S.V. Nazarenko, and L. Skrbek, 2006b, J. Low Temp. Phys. 145, 125.
- L’vov et al. (2007a) L’vov, V.S., S.V. Nazarenko, and O. Rudenko, 2007a, Phys. Rev. B 76, 024520.
- L’vov et al. (2007b) L’vov, V.S., A. Pomyalov, A. Ferrante, and S. Elghobashi, 2007b, JETP Lett. 86, 102.
- L’vov et al. (2008) L’vov, V.S., S.V. Nazarenko, and O. Rudenko, 2008, J. Low Temp. Phys., in print (2008); preprint arXiv:0807.1258v1 [physics.flu-dyn].
- Marees et al. (1987) Marees, G., R.F. Mudde, and H. van Beelen, 1987, Physica 144B, 292; Slegtenhorst, R.P., G. Marees, and H. van Beelen, 1982, ibid. 113B, 367; van Beelen, H., W. van Joolingen, and K. Yamada, 1988, ibid. 153B, 248.
- Maurer and Tabeling (1998) Maurer, J. and P. Tabeling, 1998, Europhys. Lett. 43, 29.
- Milliken et al. (1982) Milliken, F.P., K.W. Schwarz, and C.W. Smith, 1982, Phys. Rev. Lett. 48, 1204.
- Nichol et al. (2004) Nichol, H.A., L. Skrbek, P.C. Hendry, and P.V.E. McClintock, 2004, Phys. Rev. Lett. 92, 244501.
- Niemela et al. (2005) Niemela, J.J., K.R. Sreenivasan, and R.J. Donnelly, 2005, J. Low Temp. Phys. 138, 537.
- Ostermeier and Glaberson (1974) Ostermeier, R.M., and W.I. Glaberson, 1974, Phys. Lett. 49A, 223.
- Parker and Adams (2005) Parker, N.G., and C.S. Adams, 2005, Phys. Rev. Lett. 95, 145301.
- Peixinho and Mullin (2006) Peixinho, J. and T. Mullin, 2006, Phys. Rev. Lett. 96, 094501; J. Low Temp. Phys. 145, 75.
- Pope (2000) Pope, S.B., 2000, Turbulent flows (Cambridge Univ. Press, Cambridge, UK).
- Rayfield and Reif (1964) Rayfield, G.W., and F. Reif, 1964, Phys. Rev. 136, A1194.
- Rellergert et al. (2008) Rellergert W.G., S.B. Cahn, A. Garvan, J.C. Hanson, W.H. Lippincott, J.A. Nikkel, and D.N. McKinsey, 2008, Phys. Rev. Lett. 100, 025301.
- Roche (2007) Roche, P.-E., P. Diribarne, T. Didelot, O. Français, L. Rousseau, and H. Willaime, 2007, Europhys. Lett. 77, 66002.
- Ruutu et al. (1997) Ruutu V.M.H., Ü. Parts, J.H. Koivuniemi, N.B. Kopnin, and M. Krusius, 1997, J. Low Temp. Phys. 107, 93; see also Ü. Parts et al., 1995, Europhys. Lett. 31, 449.
- Ruutu et al. (1998a) Ruutu V.M.H., V.B. Eltsov, M. Krusius, Yu.G. Makhlin, B. Plaçais, and G.E. Volovik, 1998a, Phys. Rev. Lett. 80, 1465.
- Ruutu et al. (1998b) Ruutu V.M., J.J. Ruohio, M. Krusius, B. Plaçais, and E.B. Sonin, 1998b, Physica B 225, 27.
- van Saarloos (2003) van Saarloos, W., 2003, Phys. Rep. 386, 29.
- Schoepe (2004) Schoepe, W., 2004, Phys. Rev. Lett. 92, 095301.
- Schwarz and Donnelly (1966) Schwarz, K.W., R.J. Donnelly, 1966, Phys. Rev. Lett. 17, 1088.
- Schwarz (1975) Schwarz, K.W., 1975, in Advances in Chemical Physics, I. Prigogine and S.A. Rice, eds. (Wiley, New York), 33, 3.
- Schwarz (1985) Schwarz, K.W., 1985, Phys. Rev. B 31, 5782.
- Schwarz (1988) Schwarz, K.W., 1988, Phys. Rev. B 38, 2398.
- Schwarz and Rozen (1991) Schwarz, K.W. and J.R. Rozen, 1991, Phys. Rev. B 44, 7563.
- Van Sciver and Barenghi (2008) Van Sciver, S.W. and C.F. Barenghi, 2008, this volume.
- Sergeev et al. (2006) Sergeev, Y.A., C.F. Barenghi, and D. Kivotides, 2006, Phys. Rev. B 74, 184506.
- Simola et al. (1986) Simola, J.T., K.K. Nummila, A. Hirai, J.S. Korhonen, W. Schoepe, and L. Skrbek, 1986, Phys. Rev. Lett. 57, 1923.
- Skrbek (2004) Skrbek, L., 2004, JETP Lett. 80, 474.
- Smith et al. (1993) Smith M.R., R.J. Donnelly, N. Goldenfeld, and W.F. Vinen, 1993, Phys. Rev. Lett. 71, 2583.
- Smith et al. (1999) Smith M.R., D.K. Hilton and S.W. Van Sciver, 1999, Phys. Fluids, 11, 751.
- Solntsev et al. (2007) Solntsev, R.E., R. de Graaf, V.B. Eltsov, R. Hänninen, and M. Krusius, 2007, J. Low Temp. Phys. 148, 311.
- Sonin (1987) Sonin, E.B., 1987, Rev. Mod. Phys. 59, 87.
- Sreenivasan (1995) Sreenivasan, K.R., 1995, Phys. Fluids 7, 2778.
- Stalp et al. (1999) Stalp, S.R., L. Skrbek, R.J. Donnelly, 1999, Phys. Rev. Lett. 82, 4831.
- Stalp et al. (2002) Stalp, S.R., J.J. Niemela, W.F. Vinen, R.J. Donnelly, 2002, Phys. Fluids 14, 1377.
- Svistunov (1995) Svistunov, B.V., 1995, Phys. Rev. B 52, 3647.
- Swanson et al. (1983) Swanson, C.E., C.F. Barenghi, and R.J. Donnelly, 1983, Phys. Rev. Lett. 50, 190.
- Todoshchenko et al. (2002) Todoshchenko, I.A., H. Alles, A. Babkin, A.Ya Parshin, and V. Tsepelin, 2002, J. Low Temp. Phys. 126, 1449.
- Tough (1982) Tough, J.T., 1982, Superfluid turbulence, in Prog. Low Temp. Phys., vol. VIII, ed. D. F. Brewer (North-Holland, Amsterdam) p. 133.
- Tsubota et al. (2000) Tsubota, M., T. Araki, S.K. Nemirovskii, 2000, Phys. Rev. B 62, 11751.
- Tsubota et al. (2003) Tsubota, M., T. Araki, and C.F. Barenghi, 2003, Phys. Rev. Lett. 90, 205301.
- Tsubota and Kobayashi (2008) Tsubota, M. and M. Kobayashi, 2008, this volume.
- Vinen (1957a) Vinen, W.F., 1957a, Proc. Roy. Soc. Lond. A240, 114.
- Vinen (1957b) Vinen, W.F., 1957b, Proc. Roy. Soc. Lond. A240, 128.
- Vinen (1957c) Vinen, W.F., 1957c, Proc. Roy. Soc. Lond. A242, 493.
- Vinen (1958) Vinen, W.F., 1958, Proc. Roy. Soc. Lond. A243, 400.
- Vinen (1961) Vinen, W.F., 1961, in Prog. Low Temp. Phys., Vol. III, ed. C.J. Gorter (Elsevier Publ., Amsterdam) p. 1-57.
- Vinen (1963) Vinen, W.F., 1963, in Liquid Helium, ed. by G. Careri (Academic Press, New York, p. 336.
- Vinen (2000) Vinen, W.F., 2000, Phys. Rev. B, 61, 1410.
- Vinen (2001) Vinen, W.F., 2001, Phys. Rev. B, 64, 134520.
- Vinen and Niemela (2002) Vinen, W.F. and J. Niemela, 2002, J. Low Temp. Phys. 128, 167.
- Vinen (2002) Vinen, W.F., 2002, J. Low Temp. Phys. 126, 333.
- Vinen et al. (2003) Vinen, W.F., M. Tsubota, and A. Mitani, 2003, Phys. Rev. Lett. 91, 135301.
- Vinen (2005) Vinen, W.F., 2005, Phys. Rev. B 71, 024513.
- Vinen (2006) Vinen, W.F., 2006, J. Low Temp. Phys. 145, 7.
- Vinen and Donnelly (2007) Vinen, W.F. and R.J. Donnelly, 2007, Phys. Today, April, 43.
- Vinen and Skrbek (2008) Vinen, W.F. and L. Skrbek, 2008, this volume.
- Volovik (2003) Volovik, G.E., 2003, Pisma ZhETF 78, 1021; 2003, JETP Lett. 78, 533.
- Volovik (2004) Volovik, G.E., 2004, J. Low Temp. Phys. 136, 309.
- Walmsley et al. (2007a) Walmsley, P.M., A.I. Golov, H.E. Hall, A.A. Levchenko, and W.F. Vinen, 2007a, Phys. Rev. Lett. 99, 265302.
- Walmsley et al. (2007b) Walmsley, P.M., A.A. Levchenko, S.E. May, and A.I. Golov, 2007b, J. Low Temp. Phys. 146, 511.
- Walmsley and Golov (2008a) Walmsley, P.M. and A.I. Golov, 2008a, Phys. Rev. Lett. 100, 245301.
- Walmsley and Golov (2008b) Walmsley, P.M. and A.I. Golov, 2008b, to be published.
- Winiecki et al. (2000) Winiecki, T. and C.S. Adams, 2000, Europhys. Lett., 52, 257.
- Yarmchuk et al. (1979) Yarmchuk, E.J., M.J.V. Gordon, and R.E. Packard, 1979, Phys. Rev. Lett. 43, 214.
- Zhang et al. (2005) Zhang, T. and S.W. Van Sciver, 2005, J. Low Temp. Phys. 138, 865.