Effect of Cd2+ on the Growth and Thermal Properties of K2SO4 crystal
Abstract
Single crystals of pure and Cd2+ doped potassium sulfate were grown from aqueous solutions by the slow evaporation technique. From nutrient solutions with a CdSO4 concentration of 4 wt.% crystals containing 0.014 wt.% dopant concentration could be obtained. The X-ray diffraction patterns of powdered crystals confirmed their crystal structures for both cases. Thermal analysis of pure crystals shows that the phase transformation peak around C is superimposed with spurious effects, while for Cd2+ doped crystals this is not the case. The thermal hysteresis of the phase transition is 8 K for undoped K2SO4 and is reduced to 3.5 K for K2SO4:Cd2+. Compared to undoped crystals, the optical transmittance of Cd2+ doped crystals is higher.
keywords:
A. inorganic compounds , B. crystal growth , C. differential scanning calorimetry (DSC) , C. thermogravimetric analysis (TGA) , D. phase transitionsPACS:
61.10.Nz , 61.50.Ah , 67.80.Gb, , , , and
1 Introduction
Potassium sulfate K2SO4 crystallizes at room temperature in the orthorhombic olivine type structure and has four formula units per D unit cell, with lattice constants Å, Å, and Å [1]. The mineral olivine (Mg,Fe)2SiO4 is a major component of the earth’s crust. (Mg,Fe)2SiO4 and its isomorphs A2BO4 (where A = K, NH4, Rb, Cs, B = S, Se) exhibit many interesting physical properties and phase equilibria that were studied repeatedly [2, 3, 4, 5].
Upon heating K2SO4 undergoes a first order transformation at C to a hexagonal structure D with Å and Å (measured at C [6]). In this high- structure the oxygen positions of the SO tetrahedra are only partially occupied as a result of rotational disorder. K2SO4 crystals that are grown at room temperature from aqueous solution incorporate OH ions. The OH concentration decays in the temperature region from C to C and usually crystals are destroyed by this process [6].
El-Kabbany [7] has reported a thermal hysteresis for the solid phase transformation with C at heating and C at cooling. Electrical conductivity measurements on single crystals have been carried out by Choi et al. [8] who found C on heating and C on cooling, with a thermal hysteresis of 5.4 K. Most of the samples crack near C and show an abrupt drop in electrical conductivity. The hysteresis phenomena, cracking, and electrical “pretransition phenomena” were attributed to rotational disorder of SO ions [8] and inclusions of OH [6]. The present authors reported recently, that the addition of Cd2+ to the nutrient solution during K2SO4 crystal growth leads to an improvement of the crystalline quality [9]. In this paper, the influence of Cd2+ on the growth and on thermal and optical properties of K2SO4 crystal is studied in more detail.
2 Experimental
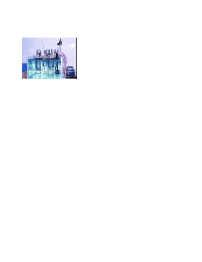
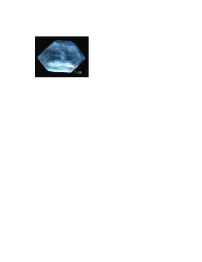
Colorless and transparent crystals of pure potassium sulfate could be obtained by slow evaporation of the solvent from saturated aqueous solutions. K2SO4 usually crystallized in prismatic crystals, the -axis was found along the long axis of the prism and the -axis was along one edge of the quasi-triangular basal plane. K2SO4:Cd2+ and K2SO4:Fe2+ crystals were grown by the same method from solutions containing 4 wt.% of CdSO4 or FeSO4, respectively. The growth process was performed in a multi-jar crystallizer (Fig 1, top) to ensure identical growth conditions. In a period of 60 days, we were able to grow colorless, transparent K2SO4 single crystals with well-developed faces having dimensions of cm3 as shown in Fig. 1, bottom. Contrary, the growth rate of colorless K2SO4:Cd2+ crystals was much lower: in a period of days crystals up to 3 mm in diameter could be grown.
The crystals were characterized by Inductively Coupled Plasma–Optical Emission Spectroscopy (ICP–OES), by X-ray powder diffractometry, and by simultaneous Differential Thermal Analysis/Thermogravimetry (DTA/TG), as described recently [9]. A NETZSCH STA409CD DTA/TG/QMS (QMS = Quadrupole Mass Spectrometer) system with skimmer coupling of the QMS was used for the simultaneous analysis of gaseous species that are evaporating from the sample during heating [10]. The shape and position of melting peaks was additionally investigated with a DSC/TG sample carrier and Pt/Rh crucibles with lid. The optical transmission was measured in the region nm (VUV spectrometer made by Laser Centre Hannover/LZH).
3 Results and Discussion
For the undoped K2SO4 crystals only impurities on the ppm level could be found by ICP–OES. If crystal growth was performed from solutions containing 4 wt.% CdSO4, the resulting crystals contained only 0.014 wt.% of the dopant. From a K2SO4 nutrient solution with 4 wt.% FeSO4, crystals with 0.076 wt.% Fe concentration were harvested. The small value of the Cd2+ distribution coefficient is in agreement with literature data for the system K2SO4–CdSO4 [11] that report an almost vanishing solubility. For iron one calculates a larger distribution coefficient . But this value is still small, and agrees with Christov’s observation [12] that almost pure K2SO4 or Na2SO4 are crystallizing from aqueous solutions containing Fe2(SO4)3 or FeSO4, respectively. The small values of and especially must lead to high dopant concentrations in the liquid interface layer and slows down the crystallization process, as compared to the growth of undoped crystals.
From the X-ray diffraction powder patterns of -values and unit cell parameters were calculated with XPowder computer software [13]. The cell parameters that are reported in Table 1 match very well with the standard values for K2SO4 as found in the literature (PDF card No. 01-070-1488) [1].
| Lattice constants | ||||
|---|---|---|---|---|
| Crystal | [Å] | [Å] | [Å] | Volume [Å3] |
| PDF 01-070-1488 | 7.476 | 10.071 | 5.763 | 433.9 |
| K2SO4 | 7.489 | 10.073 | 5.763 | 434.7 |
| K2SO4:Cd2+ | 7.505 | 10.064 | 5.766 | 435.5 |
| K2SO4:Fe2+ | 7.497 | 10.062 | 5.767 | 435.1 |
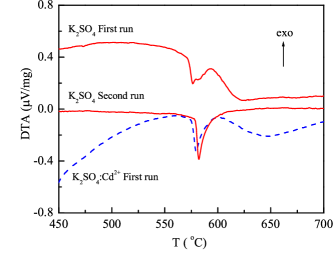
Fig. 2 compares results of DTA measurements with heating rates of +10 K/min around of pure K2SO4 and of K2SO4:Cd2+ crystals. The curves reveal the expected endothermic peaks around C related to the phase transition of pure and Cd2+ doped K2SO4. In the first heating run of pure K2SO4 the phase transition peak is superimposed by other effects while in the second heating run the phase transition peak occurs without superimposed features. It will be shown later that traces of water are incorporated in the (formally anhydrous) crystal structure. This water evaporates during the first heating run, and the second heating curve of pure K2SO4 shows the phase transition peak without additional effects. It is surprising, that K2SO4 doped with Cd2+ already in the first heating run did not show the superimposed features. An explanation of this phenomenon can be found using the TG (thermogravimetry) and QMID (Quasi Multiple Ion Detection) curves of K2SO4 and K2SO4:Cd2+ crystals that are shown in Fig. 3.

During the TG measurement the gas flowing around the K2SO4 sample was analyzed by a QMS system with 298 scans for relative mass numbers ( – molecule mass, – charge), this means that one mass spectrum is available every 2.5 K. From these mass spectra QMID curves can be calculated that show the ion current for every individual within the mass detection range given above. Fig. 3 shows such QMID curve for the signal (H2O) of undoped K2SO4 together with the TG curves. The peak around proves that evaporating water is the origin of the mass loss. The monotonous slope of the QMID background is typical for skimmer QMS coupling systems and plays no role in this discussion.
The TG curves can be divided into two temperature regions: the first one ranges from C up to the onset temperature of the DTA peak (C) and the second region is around the phase transition (). In region I the pure crystal looses about % of its initial mass, while for Cd2+ doped crystals the mass loss is %. The smaller mass loss of K2SO4 becomes remarkable for C were the TG curve for this sample is bent upward.
In region II the mass loss of K2SO4:Cd2+ is smaller than the mass loss of pure K2SO4 by 0.25%. It is obvious, that the small Cd2+ content encourages the evaporation of water already before the onset of the phase transformation. An explanation if this behaviour cannot be given on the basis of the current data. It should be added here that the influence of the times larger iron content in K2SO4:Fe2+ is just the opposite: Here the TG step at is larger compared with undoped K2SO4 (not shown in Fig. 3).
Arnold et al. [6] reported that crystals of K2SO4 grown at room temperature from aqueous solution incorporate OH ions. They decay in the temperature region from C to C. If K2SO4 is crystallized above C, the content of water in crystals can be minimized [8, 14]. Therefore investigation of the effect of crystal growth temperature in comparison with different concentrations of Cd2+ on this phenomena of K2SO4 crystals will be considered in future studies.
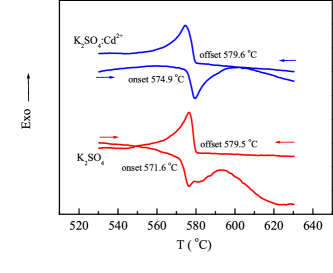
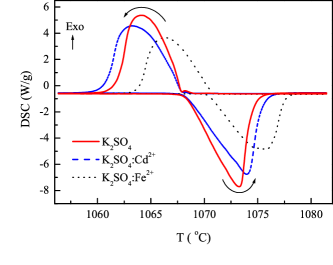
DTA heating and cooling curves around the phase transition peak for K2SO4 and K2SO4:Cd2+ crystals are shown in Fig. 4. The transition temperature can be determined from the intersection of the extended basis line with the tangent at the inflection point (extrapolated onset). It is remarkable that for pure K2SO4, as obtained from the first heating or cooling runs, respectively, differ considerably by a hysteresis of about 8 K. For K2SO4:Cd2+ this hysteresis is only 4.5 K. It was reported recently that the hysteresis is reduced considerably for both K2SO4 and K2SO4:Cd2+ in subsequent (starting from the second) heating/cooling runs [9]. Hence it can be suggested that the effect of Cd2+ on hysteresis is similar to the effect of annealing for K2SO4 crystal, if the first heating/cooling run is considered as annealing for the undoped crystal.
Fig. 5 compares the melting behavior of pure K2SO4 with that of K2SO4:Cd2+ and, for reference, with that of a higher doped K2SO4:Fe2+. For K2SO4 as well K2SO4:Cd2+ the melting temperature C and the crystallization temperature are almost identical with negligible hysteresis. In contrast, the higher dopant concentration in K2SO4:Fe2+ leads to remarkable hysteresis of 0.4 K and shifts the melting point to C. In analogy to Fig. 6 of [9] which represents a model for the phase transformation, an extended two phase region /liquid can explain the shift of and the hysteresis.
The widths of the K2SO4:Cd2+ melting and crystallization peaks are slightly larger compared to the undoped K2SO4, as a result of the minor Cd2+ dopant concentration. It is remarkable, however, that this impurity leads in the end to improved optical properties.
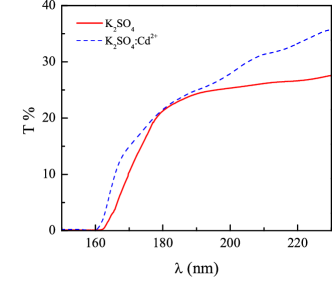
Fig. 6 shows that the optical transmission of K2SO4:Cd2+ is higher then the transmission of K2SO4 for all wavelengths shown here ( nm). This may partially be a result of scattering centers in the crystals that were grown from solutions containing Cd2+, as Cd2+ doped samples can already with the naked eye be recognized to possess a higher optical clarity. Nevertheless it is remarkable that the absorption edge is shifted toward the VUV region, resulting in an increased energy gap of K2SO4:Cd2+ compared with undoped K2SO4.
4 Conclusion
Pure K2SO4 and Cd doped K2SO4 crystals can be grown from aqueous solution by the slow evaporation technique. The incorporation of Cd is weak: From solutions with 4 wt.% CdSO4 one obtains Cd2+:K2SO4 crystals with only 0.014 wt.% of the dopant. Nevertheless, the influence of cadmium is remarkable: Cd doped crystals contain less water, and the remaining water is loosely bond compared with water in undoped crystals. The optical transparency of Cd2+:K2SO4 in the UV region is larger.
References
- [1] J. A. McGinnety, Acta Cryst. B 28 (1972) 2845 (basis for PDF 01-070-1488).
- [2] M. Dammak, H. Khemakhem, N. Zouari, T. Mhiri, A.W. Kolsi, Solid State Ionics 127 (2000) 125.
- [3] S. Guillot Gauthier, J.C. Peuzin, M. Olivier, G. Rolland, Ferroelectrics 52 (1984) 293.
- [4] H. Khemakhem, Ferroelectrics 234 (1999) 47.
- [5] D. Klimm, S. Ganschow, J. Crystal Growth 275 (2005) e849.
- [6] H. Arnold, W. Kurtz, A. Richter-Zinnius, J. Bethke, G. Heger, Acta Cryst. B 37 (1981) 1643.
- [7] F. A. I. El-Kabbany, Phys. Status Solidi A 58 (1980) 373.
- [8] B.-K. Choi, Y.-H. Cho, H.-K. Lee, J. Phys. Chem. Solids 54 (1993) 197.
- [9] S. Bin Anooz, R. Bertram, D. Klimm, Solid State Commun. 141 (2007) 497.
- [10] W. -D. Emmerich, E. Post, J. Thermal Anal. 49 (1997) 1007.
- [11] K. Nassau, J. W. Shiever, J. Crystal Growth 42 (1977) 588.
- [12] C. Christov, J. Chem. Thermodynamics 36 (2004) 223.
- [13] J. D. Martin, http://www.XPowder.com/index.html, 2004.
- [14] T. M. Chen, R. H. Chen, J. Solid State Chem. 111 (1994) 338.