MULTIBAND ANALYSIS OF ABELL 2255
Abstract
We analyzed the data for the nearby cluster of galaxies Abell 2255 from archival XMM-Newton observations in order to search for the properties of X-ray point like structures in the outskirts. 11 point-like X-ray emission is detected. Detected X-ray sources are then observed with the 1.5 meter RTT-150 at Turkish National Observatory for possible optical counterparts. The cluster field is covered through 5 ANDOR photometer pointings. 3 sources have no optical follow-ups. 2 QSOs and 1 star are observed from the field. For 4 sources we have obtained the corresponding redhifts. The cumulative log()-log() is studied and the cluster source number is calculated to be 4 times higher than the field at 10-13 ergs cm-2 s-1. This phenomenon is interpreted as increased galaxy activity as they first encounter high density ICM environment at the cluster outskirt. We suggest that X-ray emission is triggered by either increased accretion onto LMXBs, fueling of AGNs and/or awakening of BHs.
keywords:
galaxies: clusters: individual: Abell 2255 - X-rays: galaxies: clusterManaging Editor
1 Introduction
Clusters of galaxies are the largest aggregates of galaxies. They are formed from the gravitational collapse of the field galaxies and the subgroups which is a recurrent event and still ongoing at the present epoch. Samples of galaxies extracted from a certain cluster are subject to the same selection effects because they all accomodate at the same redshift. Cluster centers come to dynamical equilibrium prior to outer regions. Consequently the substructral features vanish in the core. Whereas the cluster outskirts are dynamically complex regions populated by galaxies moving towards the cluster potential. Understanding the undergoing physics in these regions between the virialized cluster cores and the widespread field is specially important.
Although early optical surveys suggest that active galaxies in clusters are relatively lower than the field (Refs. \refciteost-60; \refcitegis-78; \refcitedre-85) , the conventional portrait of clusters shows overdensities of galaxies as expected. The recent X-ray results (Refs. \refcitecap-01; \refcitemol-02; \refcitejoh-03) on Chandra and XMM-Newton data reveal higher fractions of point sources toward clusters of galaxies compared to blank fields. Refs. \refcitecappe-05 and \refciterud-05 conducted systematic analysis of X-ray source populations and found significant excess from cluster fields. As data for more clusters become available, it is concluded that the brighter galaxies are likely to locate in the outskirts of clusters (R 1 Mpc), which is naturally attributed to the infall-related fueling of active nuclei (See Refs. \refcitemar-06; \refcitehud-06).
In order to understand environmental effects of high-density Intra-cluster medium (ICM) on galaxies, we selected a dynamically active merging system, dominated by point-like structures not buried into the ICM diffuse emission. In this paper, we report X-ray and optical observational results of galaxies from the outskirts of Abell 2255. A2255 is a nearby (=0.086), bright cluster showing several signs of a merger event. Based on optical data, Ref. \refciteyua-03 reported subgroups of galaxies in the outskirts, rotating around the center of A2255. Two bright central galaxies which are the survived central-dominant (cD) ellipticals of merged subclusters and high velocity dispersions (Ref. \refcitebur-95) are the other evidences of large scale dynamics. A2255 is also bright in radio wavelenghts. The cluster contains a central radio halo and relics (Refs. \refcitegio-99; \refcitegov-05). It is well known fact that radio emission comes from relativistic electrons which can be accelerated by large scale cluster mergers. A2255 is also well studied in X-rays. ROSAT data results showed that X-ray peak is offset from the brigtest galaxy (Refs. \refcitedav-95; \refcitebur-95). More recently, Ref. \refcitesak-06 observed A2255 by XMM-Newton and reported temperature asymmetries, indicating subunit mergings. Ref. \refcitedav-03, analyzed Chandra data to investigate the X-ray properties of cluster galaxies in the central (R 0.5 Mpc) region. The study confirms the results of Ref. \refcitemar-02 that X-ray selected AGN fraction is higher than the optically selected AGNs and these AGNs likely to reside in red early-type galaxies.
The purpose of this paper is to study source properties in the cluster outskirts with X-ray and optical properties. We present the data in 2. The following section 3 describes the analysis steps. The results are discussed in 4. Assuming =75 km s-1 Mpc-1 and cosmological deceleration parameter of =0.5, the luminosity distance to A2255 is found to be 348 Mpc, and an angular size of 1 arcsec corresponds to 1.63 kpc. The quoted uncertainties for the best fit parameters of spectral fittings in 3.1 are given for 90% confidence range.
2 Observations and Data Reduction
2.1 X-Ray Data
We analysed archival X-ray data (PI: Turner, M.) obtained by two XMM-Newton observations. Both of the observations are covering entire cluster emission with 3 arcmin offset from the X-ray peak. The three EPIC instruments, the two MOSs (Ref. \refcitetur-01) and the PN (Ref. \refcitestr-01), were used. A2255 was observed in revolutions 525 and 548. The cameras were operated in the Prime Full Window mode for MOS and Prime Full Window Extended mode for PN. The thin filter was used for all EPIC cameras. We processed the observation data files and created calibrated event files using the SAS version 7.0.0. The event lists were generated from the observation data files (ODF) by the tasks EMCHAIN and EPCHAIN.
Log of XMM-Newton observations. \topruleOBS-ID Date Exp(live)/Exp(corr) (ks) Filter MOS1 MOS2 PN EPIC \colrule0112260501 2002.10.22 8.73 / 6.76 8.82 / 6.80 5.98 / 3.11 thin 0112260801 2002.12.07 16.69 / 9.60 16.65 / 9.82 17.39 / 7.40 thin \botrule
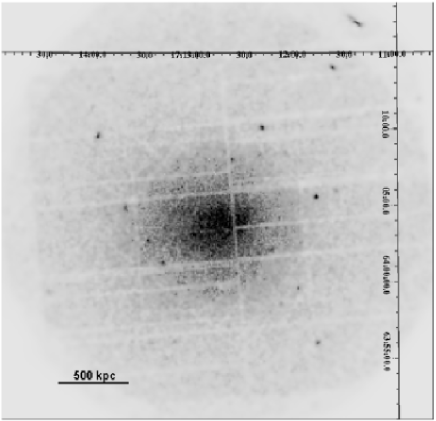
In the standart analysis, the events were selected with PATTERN 0-12 for MOS and single & double pixel events (PATTERN 0-4) for PN. In order to exclude the contribution from background flare events, we extracted light curves for the full field of view \refciteehl-03. Table 2.1 shows the journal of our observations with XMM-Newton. It is known that a high-energy band is more sensitive to flare events than a soft-energy band (Ref. \refciteehl-03). We thus choose 10-12 keV energy band for MOS and 12-14 keV for PN. The extracted light curves were clipped to clean the contamination by soft proton flares as decribed by Ref. \refcitehud-05. These Good Time Intervals (GTI) were applied to the event lists and filtered events files are produced. Figure 1 shows XMM-Newton 0.3-10.0 keV energy band merged image of A2255. The image is raw, non-background subtracted and adaptively smoothed to enhance cluster emission above the background emission.
2.2 Optical Data
Optical observations of Abell 2255 were performed with 150 cm Russian-Turkish Telescope (RTT-150). The telescope is located at Bakirlitepe Mountain, Antalya, south of Turkey. The source was observed using the ANDOR photometer and TFOSC spectrometer. The raw data were reduced using standard procedures as described by Ref. \refciteasl-01.
2.2.1 ANDOR Photometer
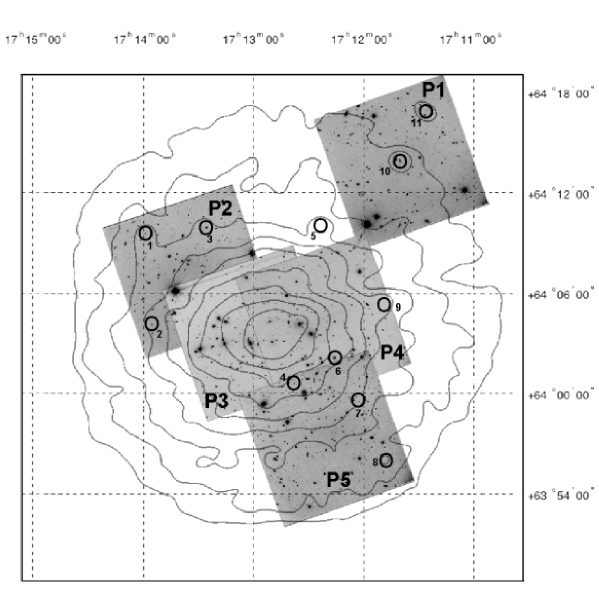
The photometric data were taken with ANDOR CCD on 2005 June 30 and 2007 July 19. The CCD size is 2048 2048 pixels at 0.24 arcsec pixel-1 resolution. The intended area was covered with 5 pointings. The exposure time was 1500 sec for each frame in using Johnson B, R filters. The instrumental magnitudes were found by DAOPHOT111Dominion Astrophysical Observatory Photometry package (Ref. \refciteste-87) aperture photometry tasks in IRAF222IRAF is distributed by the National Optical Astronomy Observatories (http://iraf.noao.edu/), which are operated by the Association of Universities for Research in Astronomy, Inc., under cooperative agreement with the National Science Foundation.. These instrumental magnitudes were then calibrated using field standard stars in the USNO A2.0333United States Naval Observatory Astrometric Standards catalog. Figure 2 shows the superposition of 0.3-10 keV X-ray contours on 5-pointings of ANDOR. The contours are logaritmically spaced after the image is adaptively smoothed to enhance ICM emission. Two bright galaxies, associated to the previous merger events, are seen at the west of the central contour. The central contour is distorted from symetry as also reported by Ref. \refcitesak-06, which is probably caused by these two galaxies.
Log of TUBITAK optical telescope RTT-150 observations. \topruleCCD Date Pointing (2000) (2000) \colruleANDOR 2005.06.30 P1 17:11:40.23 64:12:26.32 2007.07.19 P2 17:13:40.99 64:06:04.40 2005.06.30 P3 17:13:08.90 64:02:35.99 2005.06.30 P4 17:12:22.00 64:04:45.00 2005.06.30 P5 17:12:25.26 63:56:08.67 \colruleTFOSC Grism Date Wavelength () Source No 15 2006.08.23 3230-9120 2, 3, 5 2007.07.19 6 2007.07.20 4 \botrule
2.2.2 TFOSC Spectrometer
The optical spectrometric data are taken by TFOSC. Its optical design is similar to the FOSC444http://www.astro.ku.dk/ per/fosc/index.html series. For this study the grism 15 is used, which provides the maximal light efficiency and the widest spectral range (3230-9120 ). Obtained spectral resolution is 8. We acquired 900 s for each source. Wavelength calibration was performed using Neon lamp. Reduction of spectroscopic data was done with IRAF.
3 ANALYSIS and RESULTS
3.1 Temperature distribution of ICM
First, we examined hot plasma that surrounds the cluster galaxies. Global X-ray spectrum was extracted from a circle of radius 5 arcmin central region. Background estimate was obtained from blank-sky event lists (Ref. \refcitelum-02) after applying the same screening and filtering. The required response and auxiliary files for spectra were produced by rmfgen-1.53.5 and arfgen-1.66.4, respectively.
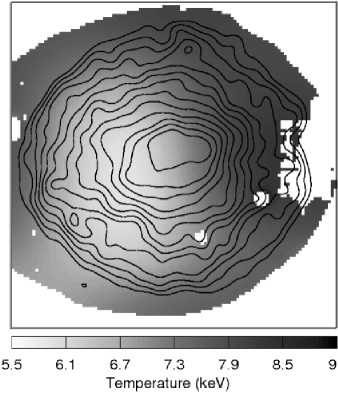
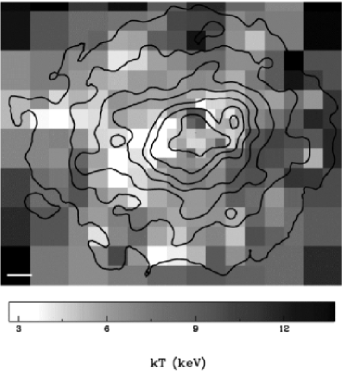
We fitted the spectrum with a singel MEKAL model. It is an emission spectrum from hot diffuse gas based on the model calculations of Mewe and Kaastra with Fe L calculations by Liedahl (Ref. \refcitekaa-92). The absorption is fixed to the Galactic value ( 2.6 1020 cm-2 (Ref. \refcitedic-90). The temperature value is keV and metal abundance value is solar. The temperature map is obtained by the multi-scale spectro-imaging algorithm described in detail by Ref. \refcitebou-04. Figure 3 shows both our temperature map and previous map from Ref. \refcitesak-06. Both maps show a nonuniform distribution of temperature. The best fitted temperature values are keV for east and keV for west, respectively. This result verifies the temperature variation from east to west is significant. Our obtained global value and temperature distribution of A2255 are in good agreement with previous work of Ref. \refcitesak-06. In this study, A2255 is selected to investigate member galaxies; therefore, a preliminary check of A2255 ICM is enough for our objectives. For a detailed study of the A2255 temperature distribution and ICM dynamical state, the reader is referred to recent analysis results of Ref. \refcitesak-06 and the references therein.
3.2 X-Ray source detection and spectra
Sources are detected using two different the SAS routines (EMLDETECT and EWAVELET) for comparison. The detection probability was set at by selecting maximum-likelihood of ML=10 and 4 gaussian of the signal-to-noise ratio, respectively. The detection is applied to soft (0.5-2 keV) and hard (2-10 keV) X-ray images. The energy cuts are designed to diagnose possible intrinsic absorption and/or hard excess emission features. This selection also breaks the counts equally, which is statistically favorable. The soft and hard source-lists are merged by SAS command SRCMATCH. A total of 11 X-ray sources are qualified in the final list from the cluster field. The source locations are displayed in Figure 2.
The sources are expected to have different spectral types, and hence not all sources were detected significantly in both soft and hard energy bands. Of these, 7 sources were detected only in the soft band. The other 4 sources (1, 5, 7 and 8 from Figure 2) were identified in both soft and hard energy bands. The point-like source spectra are extracted within circles by covering 90% fractional energy of the energy encircled function (EEF). The background count rates were produced from surrounding annulus for each sources. With this selection, we intended to remove cluster emission as well as standard background components. Only PN data is used for the rest of the analysis, because it has higher sensitivity than MOS cameras.
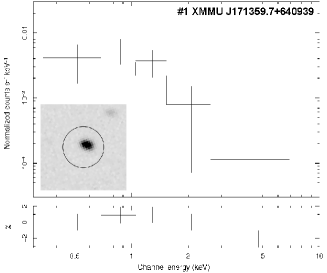
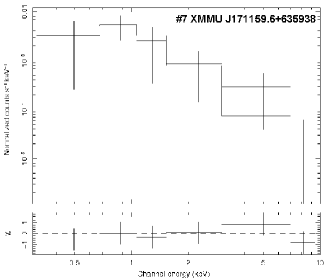
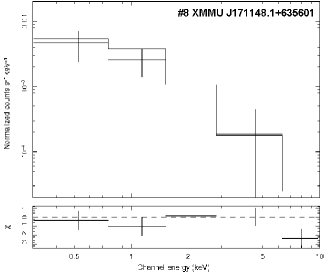
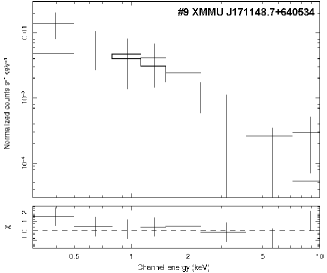
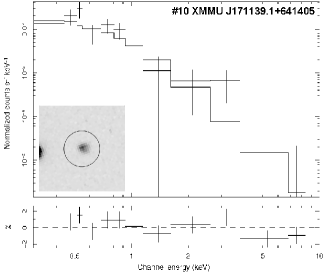
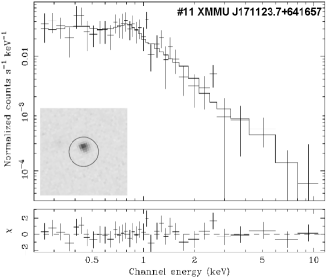
Figure 4 shows the spectra for the sources with no X-ray spectral information in the literature (sources 1, 7, 8, 9, 10 and 11). Optical followups (if there is any) of the sources are shown at the bottom left corner. The X-ray spectra were fitted with a single power-law emission model except source 11-XMMU J171123.7+641657. There was strong deviation in the soft X-ray band (E2 keV) for the brightest X-ray source 11. Single power-law model gave an index 1.98 with 0.78 (31). Additional thermal (MEKA) model of hot gas with 0.65 keV temperature to the power-law model (1.89) improved the spectrum significantly (0.59, 32).
The X-ray spectra for all the sources were fitted by single power-law model. The values were found acceptable, corresponding to the probability of 0.90. The power-law indices of the best-fit values were in the physically tolerable range (13.5), clustering around the 2.08. The sources 3 and 4 have too few counts ( 110) for a spectral fit. For these sources, the luminosities were calculated using a power-law index fixed to 2.0 in the spectra. The detected source properties with the best fit spectral parameters are summarized in table 3.2. The columns show (1) source id, (2) acronmy, (3) positional error, (4) power-law index (5) FX and (6) log at 2-10 keV, (7) reduced and (8) net counts after background subtraction.
The list of detected X-ray point sources. \topruleID ACRONYM R FX(1E-13) log Net arcsec erg cm-2s-1 erg s-1 Count (1) (2) (3) (4) (5) (6) (7) (8) \colrule1 XMMU J171359.7+640939 0.82 2.18 4.32 44.25 0.73 131 2 XMMU J171342.3+640454 1.35 1.23 3.26 41.69 0.70 156 3 XMMU J171325.4+641000 1.36 2.00b 0.19 40.48 0.67 115 4 XMMU J171236.2+640035 1.06 2.00b 0.90 41.15 0.66 106 5 XMMU J171220.9+641007 0.62 1.32 5.32 … 0.50 232 6 XMMU J171216.2+640210 1.41 1.72 5.56 41.94 0.75 289 7 XMMU J171159.6+635938 2.17 3.51 0.68 41.08 0.63 190 8 XMMU J171148.1+635601 0.81 1.79 1.85 41.49 0.82 127 9 XMMU J171148.7+640534 0.80 1.98 1.68 41.45 0.52 232 10 XMMU J171139.1+641405 2.25 3.09 0.76 43.17 0.67 181 11 XMMU J171123.7+641657 0.56 1.89 15.52 42.39 0.59 372 \botrule
3.3 log()-log()
The flux values in hard band (2-10 keV) derived from spectral fitting have provided good measurements of the source number counts, or log()-log() relationship. The sample includes 11 sources with fluxes between 10-11.8 and 10-13.7 ergs cm-2 s-1. The results are compared with Lockman Hole (non-cluster field). We acknowledge that the number of sources is admittedly low, but it can be regarded as being a rational method to infer appreciable knowledge on cluster galaxies. The cumulative source number per area (degree-2) can be calculated as the sum of the inverse areas of all sources brighter than flux , . Using the integrated formula of source numbers in units of deg-2, deg, where is the detected source number and is the sky coverage for the flux of the -th source, the relation between source number and flux is derived. It is a well known fact that each pixel on detector is not equally sensitive. The survey area decreases with the flux, and hence the detection probability decreases as off-axis angle increases. To determine the number counts per area with precision, it is necessary to correct for the incompleteness of the sample. Figure 5 shows a comparison of the obtained log()-log() plot for A2255 and the Lockman Hole results (Refs. \refcitehas-01, ). The dotted-lines include statistical and systematic instrumental errors. The statistical error was represented with 1 poisson errors (deg-2) in the source numbers. The systematic instrumental errors related to vignetting and the point spread function (PSF) is considered as 3.5% by Ref. \refcitesax-03 for an off-axis source. To be conservative, we favor to use 10% absolute calibrational error defined by Ref. \refcitekir-06. The source numbers at each flux level was corrected by considering the corresponding sky coverage. Each flux value in the plot was corrected by using the sensitivity map (top left corner of Figure 5). The map shows the survey area, deg2, as a function of the limiting fluxes in the 2-10 keV band. The counting rates were derived with the assumption of 2.0 and the galactic value of the hydrogen absorption column density (Ref. \refcitedic-90).

Figure 5 also includes the Lockman Hole X-ray source study by Ref. \refcitehas-01. One of the other recent works on Lockman Hole by Ref. \refcitehud-06 also investigated the source properties by modelling. Based on their study, single power law assumption converts the field source numbers, , where the slope is 1.16 and the normalization is deg-2. The solid-line in Figure 5 shows the model-line for Lockman Hole.
The log()-log() plot shows large population of X-ray sources in A2255 cluster clearly. The significance increases at the brighter end. The source density value corresponds to 10239 sources deg-2 for the cluster field around the flux value of erg cm-2 s-1. From the above mentioned equation, a density of 223 sources deg-2 from Lockman Hole was calculated at this flux level. The error corresponds to field-to-field variation of the blank field, which is known as cosmic variance. Based on the most sensitive mesurement to the date, it is reported to be less than 15% in the 2-10 keV band (Ref. \refcitecappe-05). If we perform a descriptive calculation by using the minumum possible source density from A2255 and the maximum source density for the Lockman Hole, the number density is 38 sources deg-2 for A2255. This worse-case scenario calculation confirms that 40% of the detected X-ray sources are A2255 members. It corresponds to at least a factor of 4 times higher source number excess from the cluster region at this flux level. However, it vanishes gradually at the fainter end as expected.
3.4 Optical imaging and photospectrum
X-ray selected sources from the cluster field are observed by ground based RTT-150 telescope for 1500s exposures with five pointings. Figure 2 shows the pointings with detected 11 x-ray sources (circles). Of these, 7 sources were found with optical counterpart (limiting magnitude =18.48). The locatization accuracy was high enough that optical followup sources were not tested for positional match. The largest shift between optical and x-ray peak was =4.36 arcsec for source 4. This was in the confidence range considering R errors. We assigned and magnitudes to the whole spectroscopic sample. Important parameters derived from optical observations are given in Table 3.4. The columns are (1) id; (2) acronmys; (3) apparent magnitude; (4) apparent magnitude; (5) absolute magnitude calculated from apparent magnitude and distance, as ; (6) luminosity in solar-units, defined as log ; (7) optical redshifts calculated from TFOSC spectroscopy (see 4.3 for detail).
Optical RTT-150 observations for the X-ray selected cluster galaxies. \topruleID ACRONYM log () (1) (2) (3) (4) (5) (6) (7) \colrule1 XMMU J171359.7+640939 17.66 17.98 … … … 2 XMMU J171342.3+640454 15.03 16.64 -20.77 10.47 0.0824 3 XMMU J171325.4+641000 13.92 15.80 -21.62 10.81 0.0811 4 XMMU J171236.2+640035 17.10 18.68 -18.73 9.66 0.0883 6 XMMU J171216.2+640210 14.85 17.00 -20.41 10.33 0.0851 10 XMMU J171139.1+641405 15.17 18.98 … … … 11 XMMU J171123.7+641657 18.48 19.09 -18.32 9.49 … \botrule
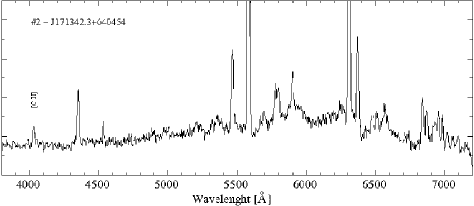
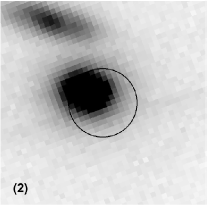
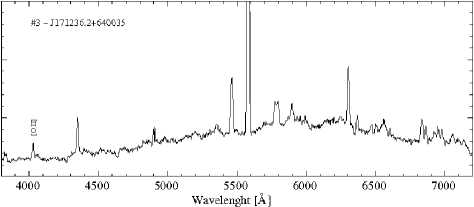
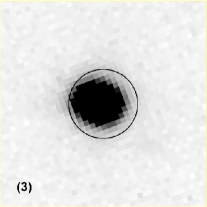
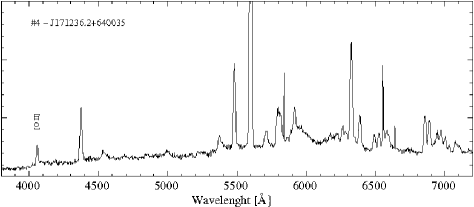
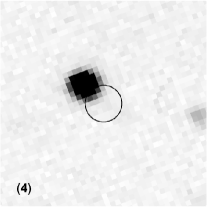
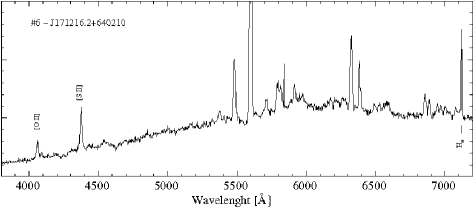
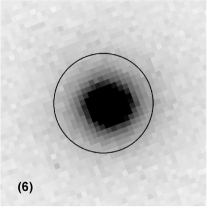
Sources 1 (XMMU J171359.7+640939) and 10 (XMMU J171139.1+641405) were identified as background objects. The reshifts are = 1.363 (Ref. \refcitesch-02) and = 0.925 (Ref. \refciteric-04), respectively. Source 11 (XMMU J171123.7+641657) had the faintest optical counterpart. Sources 2, 3, 4 and 6 were studied with TFOSC spectrometer and redshift values were obtained. Figure 6 shows the optical spectra with [O II] emission lines and ANDOR band images for the sources. The images are 20′′ 20′′ sized cutouts. The spectral wavelength range of TFOSC Grism 15 was enough for the coverage of redshifted [O II] 3727, Hα 6563, and [SII] 6716, 6731 doublet. The spectra are severely comprised by plenty of unkown emission lines. [O II] emission line is known as strong indicator of galaxy colour and good tracer of star formation (Ref. \refcitegal-89). Therefore we principally applied [O II] line for the redshift calculations where the spectra is less ambiguous (Fig. 6).
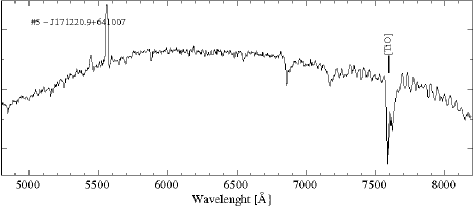
The source 5 was not pointed in ANDOR observations (see Fig. 2), but TFOSC spectrum was studied for this source. Figure 7 shows the spectrum for source 5 (XMMU J171220.9+641007). Strong TiO absorbtion was interpreted as optical spectra of M4 star. The absorption band appears near 7590 . The X-ray spectrum of the source was fairly hard ( 1.3) which is caused by magnetic activity (Ref. \refcitebra-05). It has an X-ray flux of 5.32 10-13 ergs cm-2 s-1. Based on this result, the source was not reobserved with ANDOR photometer.
4 Discussion
We detected 11 X-ray sources from A2255 outskirts. Based on the log()-log() (See Figure 5) the source number was estimated to be about 4 times higher relative to the field at = 1 ergs cm-2 s-1 flux limit. The X-ray luminosity values range between 40.48 log(LX) 42.39 ergs s-1, clustering at log(LX) = 41.37 ergs s-1. This excess indicates either an elavated X-ray emission or/and higher population of point sources from the cluster field.
X-ray emission from early-type galaxies has two origins: thermal emission from interstellar hot gas (ISM) and non-thermal energy release from accretion processes. If the matter accretes onto lower mass ( 1) of neutron star or black hole the system is known as low-mass X-ray binary (LMXB). If the accretion is due to supermassive blackhole (108 ) then the source is called active galactic nucleus (AGN). X-ray luminosity of thermal emission from hot halo is log(LX) 3738 ergs s-1 (Ref. \refcitebla-01). Expected luminosity from accetion processes is log(LX) 3839 ergs s-1 for LMXB and log(LX) 40 ergs s-1 for AGNs (Refs. \refcitebla-01, \refciteran-06). Regarding the luminosity range observed in our study (log(LX) 40.48 ergs s-1), we believe that x-ray emission is dominated by discrete sources (LMXBs) rather than hot halo (e.g., Refs. \refciteleh-07, \refcitedav-06, \refcitesar-01, \refcitebla-01 and references therein) unless a central AGN contributes to the emission.
In order to interpret the origin of this excess emission, we compared x-ray and optical properties. If the emission in optical wavelength is also elaveted with the same amount, the x-ray excess would not be suprising. According to the standard picture of galaxy clusters, red, early-type galaxies with less star formation are longer residents (Refs. \refciteell-04; \refcitekod-01). Blue, later-type galaxies are more likely to locate at outer regions (e.g. Refs. \refcitedre-80, \refcitewhi-93). In this study of A2255, the sources at larger radii (R 0.5 Mpc), the populations from red cores to bluish outskirts were emphasized. We calculated B and R magnitudes of the optical follow-up sources through our RTT-150 observations. Figure 8 shows the comparisons of flux (lef panel) and luminosity (right panel) ratio values. The details are discussed in the following sections, 4.1 and 4.2.
4.1 X-ray to optical fluxes - log (/)
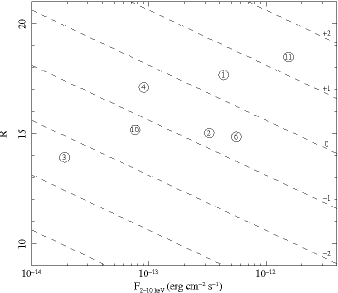
X-ray to optical flux ratio is a very helpful tool and provides important information on the variety of X-ray sources (Ref. \refcitemac-88). The ratio is applied in many X-ray surveys for its simplicity and clarity (e.g. Refs. \refcitekru-07; \refcitemai-02). Figure 8 shows the -band magnitudes (from ANDOR) versus hard band flux for X-ray detected galaxies in our sample. We have illustrated several diagonal dashed lines to indicate constant X-ray to optical flux ratio values [log () = 2, 1, 0, 1, 2] in the figure which are calculated by the Kron-Cousins filter transmission function as defined by Ref. \refcitezom-90, . Since the ratio is independent of distance, it is very useful to distinguish X-ray source variation by impeding redshift uncertainties. The normal galaxies and stars have log () 2 and AGNs show higher ratio values (Ref. \refcitemai-02). Log () 1 is comprehended as clear indication of unobscured AGN activity (e.g. Ref. \refciteleh-07). A Large fraction of our sources spans in the ratio range of ( 1 2) which is typical for AGNs. Log () plot (Figure 8 left panel) demostrates that majority of our samples are either a bright x-ray source or an AGN. However, x-ray to optical flux ratio is insufficient for a definite explanation of source types. We explore X-ray-to-optical luminosity ratios (/) in the next section to explore possible AGN activity.
4.2 X-ray to optical luminosity relation (/)
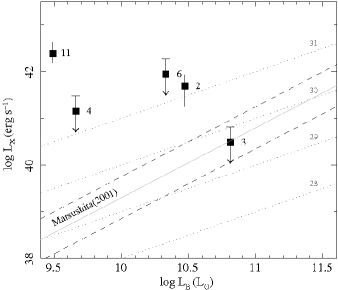
X-ray studies of local early-type galaxies have revelaed that the total X-ray luminosity is associated with optical luminosity (e.g. Refs. \refciteosu-01; \refciteelli-04). Ref. \refcitesar-06 reviews the nature of elliptical galaxies and explains how the interstellar gas is heated by high velocity interactions of stars and kinetic energy produced by Type Ia supernovae. Consequently, the / luminosity ratio demonstrates the stellar velocity dispersions of a definite galaxy () and the stellar mass () of that galaxy (Refs. \refciteleh-07; \refcitemah-01). Ref. \refcitecan-87 defines X-ray to optical luminosity correlation as for optically bright sources. The correlation for optically faint galaxies are observed to be rather linear, (e.g. Ref. \refcitegil-04).
We plotted logarithm of the 210 keV luminosity () vs. the logarithm of the band luminosity (), in Figure 8 right panel. The dotted gray lines show log(/) 28, 29, 30, 31 for visual aid. For comparison the average ratio distribution of early-type galaxies and 90% confidence limit reported by Ref. \refcitemat-01 is represented in solid and dashed lines. A positive dispersion is evident in the plot. The majority of the sources have log(/) 31. One source (#3) shows the properties of normal elliptical galaxy.
The above mentioned / plot (Figure 8 right panel) was obtained only for the sources with optical counterparts. We also checked / ratios for the sources with no optical follow-ups (i.e. #7, #8 and #9). Considering the limiting magnitute of =18.48, optical luminosity values were assinged. Source #7 is found to be in the range of normal ellipticals. And sources #8 and #9 have the ratio similar to that of either bright ellipticals or AGNs.
4.3 Notes on individual sources
XMMU J171359.7+640939 (#1) and XMMU J171139.1+641405 (#10) are background objects. The X-ray spectra were best fitted by fairly large power-law indices ( 2.2). Both sources are identified as QSOs, with = 1.363 (Ref. \refcitesch-02) and = 0.925 (Ref. \refciteric-04), respectively. The EPIC-PN X-ray counts were insufficient for redshift determination. And yet in Figure 8 both sources show strong deviation. In this study we verified that they both are QSOs and do not reside in A2255 gravitatinal potential.
XMMU J171342.3+640454 (#2) is a soft X-ray source. About 60% of the X-ray emission if detected below 2 keV. The best fitted power-law model gives an index of =1.29. Chandra data was better fitted with 0.57 keV thermal emission of an elliptical galaxy (Ref. \refcitedav-03). However, in our survey the net source count was not of sufficient quality to rule out thermal emission. The source is possibly interacting with the nearby ( 20 kpc) spiral galaxy (Fig. 6). The TFOSC spectrum shows a weak feature at 4034 which is assumed to be [O II] emission line (Fig. 6). The determined redshift for this source is = 0.0824. It is comparable to the value of Ref. \refcitezwi-71 ( = 0.0847), formerly known as ZwCl 1710.4+6401 40. The X-ray and optical properties are consistent with that of Chandra (Ref. \refcitedav-03). The source has log () 1 and / = 31.22 (see Fig. 8). These values are higher than those of nornal elliptical or starburst galaxies. Based on the above results, the source is very bright galaxy, if not classified as an AGN.
A new redshift value is determined for XMMU J171325.4+641000 (#3). TFOSC spectrum has an [O II] emission line at 4029.3 . The redshift we measure is = 0.0811 which is the first distance calculation for the source. The morphology shows signs of elongation in sout-east direction. The X-ray emission is dominated in soft energies and LX 3.0 1040 ergs s-1. The object negatively deviates in the flux and luminosity ratios (see Fig. 8). It has log () = -2.4 and / = 29.67 which is expected from a normal galaxy. Being the faintest X-ray source in our sample, fairly bright in band and lacking of strong AGN features, we identify this object as a normal galaxy. The source is not buried into the extend ICM X-ray emission as has been shown Figure 1. It is probably approaching to the cluster potential in the FOV direction.
Sources XMMU J171236.2+640035 (#4) is fairly bright. TFOCS spectrum showed [O II] line at 4056 (Fig. 6). The obtained redshift is = 0.0883. The x-ray and optical peaks do not coincide. The shift is about 4 arcsec ( 6.5 kpc) (See Fig. 6). Considering x-ray and optical positional errors, this distance can be presumed in the confidence range. The calculated redshift value suggests that the source is merging to cluster from behind in the south-west direction.
TFOSC spectrum of source #5 (XMMU J171220.9+641007) shows M star-like properties. Strong TiO absorbtion is evident in the optical spectrum of Figure 7, which is strong in M-stars. The absorption band appears near 7590 . The X-ray spectrum of the source is fairly hard ( 1.3) which is probably caused by magnetic activity (Ref. \refcitebra-05). X-ray flux is obtained to be 5.32 10-13 ergs cm-2 s-1.
XMMU J171216.2+640210 (#6) is the second brightest X-ray source in our survey. X-ray properties is also studied by Ref. \refcitedav-03 with Chandra. Our best fitted spectra result and calculated luminosity with XMM is consistent with that of Chandra (Ref. \refcitedav-03). The galaxy is also a powerful head-tail radio source (Ref. \refcitefer-97). The emission line at 4373.6 in TFOSC spectrum is evident. If this line is associated to S II (rest frame 4072), our calculated redshift value of = 0.0741 is comparable to the = 0.0714 value of Ref. \refciteowe-95. The optical spectrum shows emission features of [O II] (rest frame 3727) and [H] at 7121.5 (see Figure 6). [H] line is seen from galaxies classified as star-forming. The Ca II H and K and CH around 4665 (rest frame 4280-4300 ) absorption bands are also weakly present. The weak absorption features at 7053.4 is assumed to be Ca II + Ba II blend. These match the redshift to be = 0.0851 and place the source closer to the cluster potential well, which is very tempting. A consistent redshift value ( = 0.0714) is observed, but = 0.0851 as indicated by weaker lines is not totally ruled out. The and the / values are consistent with that of AGNs. Ref. \refcitecol-02 studied luminous X-ray source that are not AGNs at 1041 ergs s-1. Therefore, source #6 appears to be a very luminous galaxy, but may also be an AGN as noted by Ref. \refcitedav-03 as well.
The sources with no optical follow-ups (#7, #8 and #9) were bright in X-rays (see Table 3.2). Considering the confidence range of the X-ray luminosities, XMMU J171159.6+635938 (#7) can be explained by normal ellipticals. The X-ray emission from XMMU J171148.1+635601(#8) and XMMU J171148.7+640534 (#9) is contaminated by unresolved discrete sources in these galaxies. X-ray spectrum of XMMU J171123.7+641657 (#11) is studied in detail for the very first time in this study. The / study (see Fig. 6) indicates that source #11 may be an AGN. It is the brightest X-ray source of our sample, but the faintest in optical band (see. Fig 4). if sources #8, #9 and #11 really possess active nuclei, the possible mechanism that would obscure the optical emission from sources is very intriguing. One of the possible explanations would be X-ray bright optically normal galaxies (XBONGs). XBONGs are thought to be luminous AGNs (Refs. \refcitecom-02; \refciteyua-04). This is also an ideal solution for our result, especially regarding our luminosity value of = 2.5 1042 erg s-1 for source #11.
The recent studies show that the X-ray sources are not randomly distributed within clusters (Refs. \refcitemar-02, \refcitejoh-03). The brighter sources are likely to reside at the outskirts, while faint ones are closer to the core (R 1Mpc). Activating or deactivating x-ray sources are discussed with possible AGN fueling and quenching mechanisms (Refs. \refcitemar-06, \refcitehud-06). Considering the luminosity range of our sample (1040.8 1042.39 erg s-1), the sources from A2255 outskirts are likely to be undergoing a similar physical processes. The cluster environments are the places with high probability of collisions and close passages. Particularly, the outskirts are dynamically complex due to new arrivals. Normally galaxies are inbalance within itself, particularly in terms of accreeting matter. When a galaxy begins to experience cluster gravitational potential and encounters high density ICM, the balances are then disturbed. The stability between accreeting system is rearranged. Depending the mass of the compact object, new LMXBs and AGNs might be formed or they get brighter as more matter accretes. It is known that, if not all, galaxies host a black hole (BH) at its center. Most of them are not energetic, waiting for fuel to awake. The dynamical high density environment of cluster outskirts may trigger these kinds of starved BHs, which increases the X-ray source density in cluster outskirts. This explains excess of X-ray emission and crowd of x-ray sources in A2255 outskirts. The infall induced nuclear activities is the suggested solution for our results.
5 Conclusions
With XMM archival data we detected 11 point sources at the outskirts of A2255. Optical follow-up sources are observed by RTT-150 optical telescope. X-ray spectra for several sources (#7, #8, #9 and #11) were studied for the very first time. The results for source #2, #4 and #6 are found to be in reasonably good aggreement with their earlier studies (Refs. \refcitedav-03, \refciteyua-04). Source #5 identified to be an M-type star with strong TiO absorption. The redshift value of = 0.0811 found for source #3 through our TFOSC optical observations. The sources #1 and #10 verified to be possible QSOs. Based on log()-log() study, an elavated X-ray emission and/or higher source population is evident from the cluster outskirt. The source population is calculated to be 4 times higher than the field at the flux value of erg cm-2 s-1. We suggest that X-ray emission is triggered by either increased accretion onto LMXBs, fueling of AGNs and awakening of BHs in the cluster outskirts.
Acknowledgement
This work is financially supported by a Grant-in-Aid by Academic R&D Funding System contract No. 106T310, through The Scientific & Technological Research Council of Turkey (TUBITAK). M.H. is supported by TUBITAK Post-Doctoral Fellowship. The authors also acknowledge the partial support by Boğaziçi University Research Foundation via code number 06HB301. We would like thank Dr. Graziella Branduardi-Raymont for her useful suggestions and comments. This research made use of data obtained through the XMM-Newton, an ESA Science Mission with instruments and contributions directly funded by ESA member states and the US (NASA).
References
- [1] Osterbrock D. E. 1960, ApJ, 132, 325
- [2] Gisler G. R. 1978, MNRAS, 183, 633
- [3] Dressler A., Gunn J. E., & Schneider D. P. 1985, ApJ, 294, 70
- [4] Cappi, M., Mazzotta, P., Elvis, M., Burke, D. J., Comastri, A., Fiore, F., Forman, W., Fruscione, A., Green, P., Harris, D., and 14 coauthors, 2001, ApJ, 548, 624
- [5] Molnar S. M., Hughes J. P., Donahue M., & Joy M. 2002, ApJ, 573, L91
- [6] Johnson O., Best P. N., & Almaini O. 2003, MNRAS, 343, 924
- [7] Cappelluti N., Cappi M., Dadina M. et al., 2005, A&A, 430, 39
- [8] Ruderman J. T., & Ebeling H., 2005, ApJ, 183, 743
- [9] Martini P., Kelson D. D., Kim E., et al., 2006, ApJ, 644, 116
- [10] Hudaverdi M., Kunieda H., Tanaka T. et al., 2006, PASJ, 58, 931
- [11] Yuan Q., Zhou X. Jiang Z., 2003, ApJS, 149, 53
- [12] Burns J. O., Roettiger K., Pinkney J., et al., 1995, ApJ, 446, 583
- [13] Giovannini G., Tordi M., & Feretti L., 1999, New Astron., 4, 141
- [14] Govoni F., Murgia M., Feretti L., et al., 2005, A&A, 579, 571
- [15] Davis D. S., White R. E, III, 1998, ApJ, 492, 57
- [16] Sakelliou I. & Ponman T.J., 2006, MNRAS, 367, 1409
- [17] Davis D. S., Miller C. A., Mushotzky R. F., 2003, ApJ, 597, 202
- [18] Martini P., Kelson D. D., Mulchaey J. & Trager S. C., 2002, ApJ, 576, L109
- [19] Turner M. J. L. et al., 2001, A&A, 365, L27
- [20] Strüder L., et al., 2001, A&A, 365, L18
- [21] Ehle M., Breitfellner M., Diaz Trigo M., et al., 2003, XMM-Newton Users’ Handbook, Issue 2.5
- [22] Hudaverdi M., Yamashita K. Furuzawa A., 2005, AdSpR, 36, 643
- [23] Aslan Z., Bikmaev, I. F., Vitrichenko, É. A., 2001, AstL. 27, 398
- [24] Stetson P. B., 1987, PASP, 99, 191
- [25] Lump D. H., Warhick R. S., Page M. De Luca A. 2002, AA, 389, 93
- [26] Kaastra, J.S. 1992, An X-Ray Spectral Code for Optically Thin Plasmas (Internal SRON-Leiden Report, updated version 2.0)
- [27] Dickey J. M. Lockman F. J. 1990, ARAA, 28, 215
- [28] Bourdin H., Sauvaget J. L., Slezak E., Bijaoui A. Teyssier R. 2004, AA, 414, 429
- [29] Hasinger G., Altieri B., Arnaud M., et al. 2001, A&A, 365, L45
- [30] Saxton, R. D. 2003, XMM-SOC-CAL-TN-0023
- [31] Kirsch, M., 2006, XMM-Science Ops Centre Technical Note, XMM-SOC-CAL-TN-0018
- [32] Schneider D. P., Richards G. T., Fan, X. et al., 2002, AJ, 123, 567
- [33] Richards G. T., Nichol R. C., Gray A. G., 2004, ApJS, 155, 257
- [34] Gallagher, J. S., Hunter, D. A. & Bushouse, H., 1989, AJ, 97, 700
- [35] Brandt W. N. Hasinger, G., 2005, ARAA, 43, 827
- [36] Blanton E. L., Sarazin C. L., & Irwin, J. A. 2001, ApJ, 552, 106
- [37] Randall S. W., Sarazin C. L. and Irwin J. A. 2006, ApJ, 636, 200
- [38] Lehmer B. D., Brandt W. N., Alexander D. M., et al., 2007, ApJ, 657, 681
- [39] David L. P., Jones C., Forman W., et al., 2006, ApJ, 653, 207
- [40] Sarazin, C. L., Irwin, J. A., & Bregman, J. N. 2001, ApJ, 556, 533
- [41] Ellingson E., 2004, ogci.conf., 327
- [42] Kodama T., Smail I., Nakata F., et al., 2001, ApJ, 562, 9
- [43] Dressler, A. 1980, ApJ, 42, 565
- [44] Whitmore B. C., Gilmore D. M., Jones C., 1993, ApJ, 407, 489
- [45] Maccacaro T., Gioia I. M., Wolter A., et al., 1988, ApJ, 326, 680
- [46] Krumpe M., Lamer G., Schwope A. D., Wagner S., Zamorani G., Mignoli M., Staubert R., Wisotzki L., Hasinger G., 2007, AA, 466, 41
- [47] Mainieri V., Bergeron J., Hasinger G., Lehmann I., Rosati P., Schmidt M., Szokoly G. Della Ceca R., 2002, AA, 393, 425
- [48] Zombeck M. V. 1990, Handbook of space astronomy and astrophysics, Cambridge University Press
- [49] O’Sullivan E., Forbes D. A., & Ponman T. J. 2001, MNRAS, 328, 461
- [50] Ellis S. C., & O’Sullivan E. 2006, MNRAS, 367, 627
- [51] Sarazin C. L. 1997, in ASP Conf. Ser. 116, The Nature of Elliptical Galaxies, ed. M. Arnaboldi, G. S. Da Costa, & P. Saha (San Francisco: ASP), 375
- [52] Mahdavi A., & Geller M. J. 2001, ApJ, 554, L129
- [53] Canizares C. R., Fabbiano G., & Trinchieri G. 1987, ApJ, 312, 503
- [54] Gilfanov M. 2004, MNRAS, 349, 146
- [55] Matsushita K., 2001, ApJ, 547, 693
- [56] Zwicky F., 1971, Catalogue of selected compact galaxies and of post-eruptive galaxies, Zuerich, Switzerland
- [57] Feretti L., Boehringer H., Giovannini G., et al., 1997, AA, 317, 432
- [58] Owen F. N., Ledlow M. J. Keel W. C., 1995, AJ, 109, 14
- [59] Colbert E. Ptak A. 2002, ApjS, 143, 25
- [60] Comastra A., Brusa M., Ciliegi P., Mignoli, M., Fiore, F., Maiolino, R., Severgnini, P., Baldi, A., Molendi, S., Vignali, C., La Franca, F., Matt, G., Perola, G. C., 2002, arXiv:astro-ph/0203019
- [61] Yuan F. & Narayan R., 2004, ApJ, 612, 724